Stocks: U.S. Stocks Start September On A Sour Note, Fall In Holiday-Shortened Week; Defensives Lead, While Tech, Cyclicals Lag; Economic Slowdown Fears Again Make The Rounds, Weighing On Small-Caps.
Download Weekly Market Commentary | September 9 2024
What We’re Watching:
- The National Federation of Independent Business (NFIB) Small Business Index for August is released Tuesday after a 93.7 reading in July. A higher reading is preferred.
- U.S. Consumer Price Index (CPI) for August is released Wednesday. Headline CPI is expected to rise 0.2% month over month and 2.6% year over year, while core CPI, which excludes volatile food and energy prices, is expected to rise 0.2% month over month and 3.2% year over year.
- The University of Michigan’s September Index of Consumer Sentiment is released Friday with a preliminary reading of 68.0 expected, which would be modestly above the 67.9 reading from August.
Key Observations
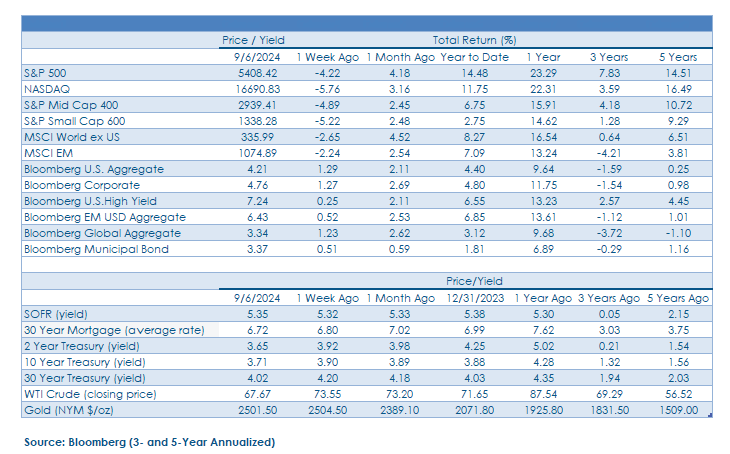
- U.S. stocks began September on their back foot as signs the labor market was cooling again spurred fears of an economic slowdown and called into question the outlook for earnings growth. Leadership took on a decidedly defensive tone during the week with consumer staples, real estate, and utilities outperforming, while economically sensitive sectors such as energy, industrials, materials, and semiconductors acted as drags on the broader index.
- With U.S. economic data, broadly speaking, coming in weak, it’s of little surprise that cyclical sectors and domestically focused small cap stocks lagged, but with low trading volume and limited liquidity during the holiday-shortened week, we hesitate to view last week’s price action as a character change for the market and little more than noise at present.
- August nonfarm payrolls fell short of expectations with 142k jobs created during the month, below the 160k estimate, but the unemployment rate fell to 4.2% from 4.3% in July. The FOMC is focused primarily on the labor market leading up to its mid-September meeting, and this report will likely lead to an intense debate within the Committee between a 25-basis point rate cut and a more aggressive 50-basis point move. A quarter-point cut remains our base case, but with continued signs of cooling in the labor market evident and given there is a sizable seven-week gap between FOMC meetings, the case for a more impactful half-point cut could be made.
What Happened Last Week:
Stocks: U.S. Stocks Start September On A Sour Note, Fall In Holiday-Shortened Week; Defensives Lead, While Tech, Cyclicals Lag; Economic Slowdown Fears Again Make The Rounds, Weighing On Small-Caps.
Hesitate To Read Too Much Into Last Week’s Market Action As Limited Liquidity Backdrop Can Provide More Noise Than Signal. While U.S. equities were certainly challenged last week, we hesitate to take too much away from last week’s lackluster price action due largely to where we were/are in the calendar and the low volume/limited liquidity backdrop that tends to materialize surrounding the Labor Day holiday. All else being equal, we tend to put more ‘stock’ in selloffs accompanied by higher trading volume, which is typically a sign large institutional investors are exiting positions. Based on that measure alone, last week’s pullback falls short of telling us much of anything as NYSE Composite volume in all four trading days fell below the daily average over the trailing year. With the FOMC’s media blackout period now in place in the lead-up to the Committee’s mid-September meeting, we won’t have Fed chatter to rattle markets and contribute to elevated volatility, making it possible for U.S. stocks to stabilize and find their footing.
Defensives Lead As Information Technology, Some Cyclical Sectors Give Ground As ‘Growth Scare’ Narrative Gains Traction. Consumer staples and real estate were the best performing S&P 500 sectors last week, each posting modest gains while the S&P 500 overall fell 4.2%. This is an undesirable leadership profile for those bullish on the near- term outlook for stocks as it highlights a desire for safety and income at the expense of price appreciation, which is understandable given some of the lackluster economic data points we received over the balance of last week. On the other side of the ledger, information technology was the biggest drag on the index as the sector fell 7.4%, pulled lower by weakness in semiconductor stocks as the VanEck Semiconductor ETF (SMH) slid 11.7% on the week. Outside of technology, weakness in some of economically sensitive sectors caught our eye as energy, industrials, and materials each fell by 4.2% or more on the week and underperformed the S&P 500. Weakness in these pro-cyclical areas was a byproduct of continued lackluster manufacturing data, which has been a constant in the past two years, along with further signs the labor market was cooling with job openings falling more than expected and the August nonfarm payrolls report showing fewer jobs were created during the month than anticipated.
U.S. Small Caps Face Tough Sledding As Economic Growth Concerns Weigh – Again. The S&P Small Cap 600 index fell 5.2% last week as two key readings on the health of the labor market – JOLTS and nonfarm payrolls – pointed toward a continued cooling, which investors interpreted as implying slower U.S. economic growth in the coming quarters. Small caps will likely remain beholden to forthcoming economic data and the path forward for monetary policy. At present, the labor market is softening, which should help alleviate some of the wage and margin pressures faced by smaller companies in recent years but continues to point toward an economic soft landing being the most likely outcome, which makes it less likely we see the FOMC cut the funds rate by a more impactful 50-basis points in September. We maintain exposure to small and mid-cap (SMid) U.S. stocks in-line with our strategic long-term benchmark, but don’t envision this area outperforming over the near-term barring some significant unforeseen upside economic surprises.
Bonds: Softening Labor Market Data Forces Treasury Yields Lower On The Week; Weekly Corporate Bond Sales Reach Four Year High And Credit Spreads Widen On Fears Of A U.S. Economic Slowdown.
Yield Curve Normalizes Amid Continued Cooling Labor Market Data. Bond market participants spent most of last week sifting through waves of economic data spanning from a slower U.S. Manufacturing PMI, a mixed August Nonfarm Payrolls report, and the August Job Openings and Labor Turnover Survey (JOLTS) that showed far fewer jobs were open last month than anticipated. The JOLTS report mid-week initially brought the 2-Year U.S. Treasury yield below the 10-year yield, a re-steepening of the yield curve that was sustained into the weekend the pair closed out the with yields of 3.65% for the 2-year and 3.67% for the 10- year. To cap off the week, Friday’s Nonfarm Payrolls from August came in below the consensus forecast as well, with downward revisions of 86k to the payrolls reports from June and July stoking fears the labor market has been softer than believed for some time now and that the FOMC is behind the curve. Fed funds futures initially shifted Friday morning to price in a 44% chance of a 50-basis point cut in mid-September before settling at around 22% by the end of the day, down from a 31% chance at the beginning of the week but did increase the likelihood of a larger rate cut in early November on the heels of the August payrolls report. U.S. benchmark rates fell across the curve every day last week with the 10-year yield, specifically, dropping by an unsettling 23-basis points over the balance of the week, leading duration sensitive assets to outperform. The Bloomberg Aggregate Bond Index registered a 1.4% gain on the week and is now 10.2% higher over the trailing 12-months. Investors allocating to core bonds, specifically Treasuries, haven’t had the smoothest rise over the past four or so quarters, but those sticking to their strategic positions to this segment of the bond market have been rewarded for doing so.
Borrowers Flood The Market With Debt Deals Post-Labor Day. Corporate issuers took little time to settle into their seats Tuesday after the long holiday weekend as an abbreviated trading week did little to discourage companies from floating new paper as around 30 investment grade issuers brought bonds to market on Tuesday alone with 59 doing so over the balance of last week. This has been a noticeable trend in recent years as 55 firms tapped markets in 2023’s post-Labor Day borrowing spree as yields on the investment grade bond index hit a 24-month low at 4.78%, providing ample reason for companies looking for fresh capital for upcoming projects to get a cash injection. While corporate treasurers appeared eager to take advantage of lower yields last week with $80B+ of issuance well ahead of the $50B estimate, roughly $125B is expected to come to market this month still a tick below the 5-year average for high grade bonds issuance of $136B, we wouldn’t call the volume alarming. Valuations are undoubtedly playing a role as the Treasury rally in recent weeks had investment grade credit spreads inside of 1% at 97-basis points to close out the week, but lower rates have also lowered borrowing
costs, and the Bloomberg U.S. Corporate Bond Index turned out a respectable 1.2% gain on the week, in-line with the Bloomberg Aggregate Bond Index despite the outsized level of corporate issuance.
Credit’s Sensitivity To Slowing Growth Masked By Lower Rates. High yield corporate bond valuations came under pressure last week as market sentiment appeared to waver on every economic data release. The option-adjusted, or credit spread on the Bloomberg U.S. Corporate High Yield index ticked higher last week from 3% over the Treasury curve to 3.2%, a notable one-week move, particularly given how well-bid lower quality corporate bonds have been this year. The Manufacturing PMI data on Tuesday appeared to sway credit investors last week as credit spreads made their largest daily move higher since the early August selloff on the heels of the release. However, bond prices hardly felt the impact of wider spreads as the drop in Treasury yields effectively offset the change in valuation with the Corporate High Yield Index posting a 0.2% gain on the week. Despite the risk-off tone in equity markets that often translates into weakness in high yield bonds, the lowest CCC-rated securities outperformed on the week, one indication that selling pressure has been modest thus far. For the better part of 2024, that story has held true to form as buyer demand for high yielding paper has kept a floor on just how discounted/cheap lower quality bonds could get, a positive technical environment that gives us cautious confidence in the sub-asset class at present.
IMPORTANT DISCLOSURES: THIS PUBLICATION HAS BEEN PREPARED BY THE STAFF OF HIGHLAND ASSOCIATES, INC. FOR DISTRIBUTION TO, AMONG OTHERS, HIGHLAND ASSOCIATES, INC. CLIENTS. HIGHLAND ASSOCIATES IS REGISTERED WITH THE UNITED STATES SECURITY AND EXCHANGE COMMISSION UNDER THE INVESTMENT ADVISORS ACT OF 1940. HIGHLAND ASSOCIATES IS A WHOLLY OWNED SUBSIDIARY OF REGIONS BANK, WHICH IN TURN IS A WHOLLY OWNED SUBSIDIARY OF REGIONS FINANCIAL CORPORATION. RESEARCH SERVICES ARE PROVIDED THROUGH MULTI-ASSET SOLUTIONS, A DEPARTMENT OF THE REGIONS ASSET MANAGEMENT BUSINESS GROUP WITHIN REGIONS BANK. THE INFORMATION AND MATERIAL CONTAINED HEREIN IS PROVIDED SOLELY FOR GENERAL INFORMATION PURPOSES ONLY. TO THE EXTENT THESE MATERIALS REFERENCE REGIONS BANK DATA, SUCH MATERIALS ARE NOT INTENDED TO BE REFLECTIVE OR INDICATIVE OF, AND SHOULD NOT BE RELIED UPON AS, THE RESULTS OF OPERATIONS, FINANCIAL CONDITIONS OR PERFORMANCE OF REGIONS BANK. UNLESS OTHERWISE SPECIFICALLY STATED, ANY VIEWS, OPINIONS, ANALYSES, ESTIMATES AND STRATEGIES, AS THE CASE MAY BE (“VIEWS”), EXPRESSED IN THIS CONTENT ARE THOSE OF THE RESPECTIVE AUTHORS AND SPEAKERS NAMED IN THOSE PIECES AND MAY DIFFER FROM THOSE OF REGIONS BANK AND/OR OTHER REGIONS BANK EMPLOYEES AND AFFILIATES. VIEWS AND ESTIMATES CONSTITUTE OUR JUDGMENT AS OF THE DATE OF THESE MATERIALS, ARE OFTEN BASED ON CURRENT MARKET CONDITIONS, AND ARE SUBJECT TO CHANGE WITHOUT NOTICE. ANY EXAMPLES USED ARE GENERIC, HYPOTHETICAL AND FOR ILLUSTRATION PURPOSES ONLY. ANY PRICES/QUOTES/STATISTICS INCLUDED HAVE BEEN OBTAINED FROM SOURCES BELIEVED TO BE RELIABLE, BUT HIGHLAND ASSOCIATES, INC. DOES NOT WARRANT THEIR COMPLETENESS OR ACCURACY. THIS INFORMATION IN NO WAY CONSTITUTES RESEARCH AND SHOULD NOT BE TREATED AS SUCH. THE VIEWS EXPRESSED HEREIN SHOULD NOT BE CONSTRUED AS INDIVIDUAL INVESTMENT ADVICE FOR ANY PARTICULAR PERSON OR ENTITY AND ARE NOT INTENDED AS RECOMMENDATIONS OF PARTICULAR SECURITIES, FINANCIAL INSTRUMENTS, STRATEGIES OR BANKING SERVICES FOR A PARTICULAR PERSON OR ENTITY. THE NAMES AND MARKS OF OTHER COMPANIES OR THEIR SERVICES OR PRODUCTS MAY BE THE TRADEMARKS OF THEIR OWNERS AND ARE USED ONLY TO IDENTIFY SUCH COMPANIES OR THEIR SERVICES OR PRODUCTS AND NOT TO INDICATE ENDORSEMENT, SPONSORSHIP, OR OWNERSHIP BY REGIONS OR HIGHLAND ASSOCIATES. EMPLOYEES OF HIGHLAND ASSOCIATES, INC., MAY HAVE POSITIONS IN SECURITIES OR THEIR DERIVATIVES THAT MAY BE MENTIONED IN THIS REPORT. ADDITIONALLY, HIGHLAND’S CLIENTS AND COMPANIES AFFILIATED WITH HIGHLAND ASSOCIATES MAY HOLD POSITIONS IN THE MENTIONED COMPANIES IN THEIR PORTFOLIOS OR STRATEGIES. THIS MATERIAL DOES NOT CONSTITUTE AN OFFER OR AN INVITATION BY OR ON BEHALF OF HIGHLAND ASSOCIATES TO ANY PERSON OR ENTITY TO BUY OR SELL ANY SECURITY OR FINANCIAL INSTRUMENT OR ENGAGE IN ANY BANKING SERVICE. NOTHING IN THESE MATERIALS CONSTITUTES INVESTMENT, LEGAL, ACCOUNTING OR TAX ADVICE. NON-DEPOSIT PRODUCTS INCLUDING INVESTMENTS, SECURITIES, MUTUAL FUNDS, INSURANCE PRODUCTS, CRYPTO ASSETS AND ANNUITIES: ARE NOT FDIC-INSURED I ARE NOT A DEPOSIT I MAY GO DOWN IN VALUE I ARE NOT BANK GUARANTEED I ARE NOT INSURED BY ANY FEDERAL GOVERNMENT AGENCY I ARE NOT A CONDITION OF ANY BANKING ACTIVITY.
NEITHER REGIONS BANK NOR REGIONS ASSET MANAGEMENT (COLLECTIVELY, “REGIONS”) ARE REGISTERED MUNICIPAL ADVISORS NOR PROVIDE ADVICE TO MUNICIPAL ENTITIES OR OBLIGATED PERSONS WITH RESPECT TO MUNICIPAL FINANCIAL PRODUCTS OR THE ISSUANCE OF MUNICIPAL SECURITIES (INCLUDING REGARDING THE STRUCTURE, TIMING, TERMS AND SIMILAR MATTERS CONCERNING MUNICIPAL FINANCIAL PRODUCTS OR MUNICIPAL SECURITIES ISSUANCES) OR ENGAGE IN THE SOLICITATION OF MUNICIPAL ENTITIES OR OBLIGATED PERSONS FOR SUCH SERVICES. WITH RESPECT TO THIS PRESENTATION AND ANY OTHER INFORMATION, MATERIALS OR COMMUNICATIONS PROVIDED BY REGIONS, (A) REGIONS IS NOT RECOMMENDING AN ACTION TO ANY MUNICIPAL ENTITY OR OBLIGATED PERSON, (B) REGIONS IS NOT ACTING AS AN ADVISOR TO ANY MUNICIPAL ENTITY OR OBLIGATED PERSON AND DOES NOT OWE A FIDUCIARY DUTY PURSUANT TO SECTION 15B OF THE SECURITIES EXCHANGE ACT OF 1934 TO ANY MUNICIPAL ENTITY OR OBLIGATED PERSON WITH RESPECT TO SUCH PRESENTATION, INFORMATION, MATERIALS OR COMMUNICATIONS, (C) REGIONS IS ACTING FOR ITS OWN INTERESTS, AND (D) YOU SHOULD DISCUSS THIS PRESENTATION AND ANY SUCH OTHER INFORMATION, MATERIALS OR COMMUNICATIONS WITH ANY AND ALL INTERNAL AND EXTERNAL ADVISORS AND EXPERTS THAT YOU DEEM APPROPRIATE BEFORE ACTING ON THIS PRESENTATION OR ANY SUCH OTHER INFORMATION, MATERIALS OR COMMUNICATIONS.
SOURCE: BLOOMBERG INDEX SERVICES LIMITED. BLOOMBERG® IS A TRADEMARK AND SERVICE MARK OF BLOOMBERG FINANCE L.P. AND ITS AFFILIATES (COLLECTIVELY “BLOOMBERG”). BARCLAYS® IS A TRADEMARK AND SERVICE MARK OF BARCLAYS BANK PLC (COLLECTIVELY WITH ITS AFFILIATES, “BARCLAYS”), USED UNDER LICENSE. BLOOMBERG OR BLOOMBERG’S LICENSORS, INCLUDING BARCLAYS, OWN ALL PROPRIETARY RIGHTS IN THE BLOOMBERG BARCLAYS INDICES. NEITHER BLOOMBERG NOR BARCLAYS APPROVES OR ENDORSES THIS MATERIAL OR GUARANTEES THE ACCURACY OR COMPLETENESS OF ANY INFORMATION HEREIN, OR MAKES ANY WARRANTY, EXPRESS OR IMPLIED, AS TO THE RESULTS TO BE OBTAINED THEREFROM AND, TO THE MAXIMUM EXTENT ALLOWED BY LAW, NEITHER SHALL HAVE ANY LIABILITY OR RESPONSIBILITY FOR INJURY OR DAMAGES ARISING IN CONNECTION THEREWITH.