Stocks: Good Economic News Equates To Bad News For U.S. Equity Indices – For Now; Small Caps Sell Off As Investors Take Profits In Recent Highflyers, Rate Cut Beneficiaries; U.S. Dollar Strength, Energy Rebound Weighs On Emerging Markets.
Download Weekly Market Commentary | September 29 2025
What We’re Watching:
- The Conference Board releases its Consumer Confidence survey for September on Tuesday. The reading is expected to fall/weaken to 96.0 from 97.4 in August.
- The Institute for Supply Management (ISM) Manufacturing index for September is released Wednesday with the reading expected to improve to 49.0 from 48.7 in August. A reading above 50 indicates expansion or growth, while a reading below 50 indicates contraction.
- U.S. Nonfarm Payrolls for September are released Friday with the consensus estimate calling for 50k jobs to have been created during the month, with the unemployment rate remaining steady at 4.3%. Beyond just the headline jobs growth in September, revisions to payrolls from July and August will also be worth watching.
Key Observations
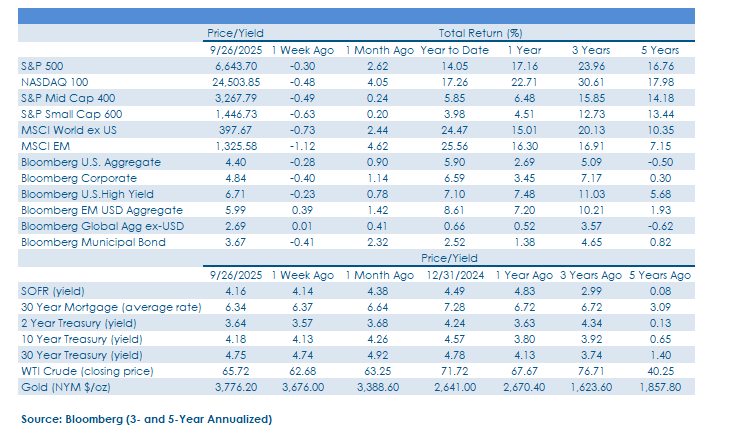
- Headline U.S. stock indices turned out modest losses on the week as profit taking and quarter-end rebalancing weighed most heavily on recent highflyers such as U.S. small caps, and some of the artificial intelligence (AI)/data center beneficiaries. Many of these areas were stretched and trading in overbought territory after rallying over the past month, so profit taking to remove some of the ‘froth’ and reset sentiment is likely a healthy event.
- With the U.S. dollar strengthening and commodity prices rising on better-than-expected U.S. economic data, investors took the opportunity to book some profits in emerging market stocks. Bifurcation in performance at the country level was stark, highlighting the importance of active management as Mexico was a standout performer on the upside, while India, South Korea, and Taiwan were drags on the MSCI EM index.
- Treasury yields across the curve ended the week higher, with the largest moves taking place on bonds maturing between 2 and 7 years as economic growth expectations were upgraded and investors appeared less convinced that aggressive monetary policy easing was in the cards. Investment-grade corporate bonds were noticeably weak as rising Treasury yields in the belly of the curve, along with sizable weekly issuance forced credit spreads wider weighed on this segment.
What Happened Last Week:
Stocks: Good Economic News Equates To Bad News For U.S. Equity Indices – For Now; Small Caps Sell Off As Investors Take Profits In Recent Highflyers, Rate Cut Beneficiaries; U.S. Dollar Strength, Energy Rebound Weighs On Emerging Markets.
Profit-Taking, Quarter-End Rebalancing Drags Down U.S. Indices. The S&P 500 ended a 3-week winning streak, falling 0.3% on the week as profit-taking and quarter-end rebalancing led investors to sell some of the 3rd quarter’s biggest winners. From a sector perspective, energy and utilities were the best performers in the S&P 500, but Friday’s rebound also pulled the real estate sector into positive territory, if only by a few basis points. It’s notable that energy has been one of the worst performing S&P 500 sectors this year, making it less subject to profit taking, and rebalancing may have driven an uptick in demand for exposure to this sector. On the other end of the spectrum, communication services, consumer staples, health care, and materials all ended the week lower by 1% or more. Further downside could lie ahead in the coming weeks potential upside catalysts are few and far between in the lead-up to the start of earnings season in mid-October. However, the back-half of October through January has historically been the strongest stretch for stocks in a given calendar year, and with U.S. indices higher year-to-date and most active managers underperforming their benchmark, we expect performance chasing to commence.
Encouraging economic data was a headwind for stocks last week due in large part to market participants pricing in a more gradual path forward for rate cuts, but from an equity investor’s perspective, we would prefer an improved outlook for U.S. economic growth and stable short-term interest rates as opposed to a weaker U.S. economy and a more aggressive pace of policy easing. Given our view that the U.S. economy is on stable footing despite ongoing trade uncertainty, and with our expectation that the Fed funds rate will likely gradually move lower in the coming quarters, investors would likely be well served to focus on fundamentals and the outlook for earnings in the coming year(s), which are reasons to remain constructive on U.S. stocks, broadly speaking.
Profit Taking Hits Small Caps As Investors Ratchet Lower Rate Cut Expectations Amid Better Economic Data. U.S. small cap stocks started the week on firm footing, but after 2Q GDP was revised higher early in the week, investors began to price out cuts to the Fed funds rate in the coming months, spurring profit taking in the S&P Small Cap 600 index. Small caps were susceptible to a pullback due to the sizable quarter-to-date rally the asset class has experienced, and with the pendulum swinging too far in favor of an aggressive path forward for rate cuts in the coming months, even modest downgrades to those expectations were likely to result in some profit taking. Additional near-term downside for small caps could be in the cards should rate cut hopes fade and/or credit spreads widen due to increased issuance. However, the current pullback will likely prove to be a healthy event for the asset class with the November through January stretch historically kind to U.S. stocks across the market cap spectrum, which could be particularly true this time around with U.S. economic data improving, on balance.
Abroad, Developed Outperforms Emerging On The Week. Developed equity markets abroad were rudderless on the week with most country indices ending the week either higher or lower by less than 0.5%, with Canada’s 1.4% drop a notable exception. The Europe Stoxx 600 index was volatile as crosscurrents abound. Midweek business surveys signaled modest growth in eurozone economic activity, but German sentiment worsened, raising questions about recovery prospects. On Thursday, the Swiss National Bank held its key policy rate at 0% due to subdued inflation, while corporate headlines such as BBVA’s revised takeover offer for Sabadell and SAP facing an EU probe created opportunities for active managers. Emerging markets outperformed developed markets abroad early in the week but gave up that advantage into the weekend as weakness out of India, South Korea, and Taiwan more than offset gains out of Mexico. Strength in the U.S. dollar and rising crude oil prices likely contributed to the drop in EM, but we view profit taking in this cohort of stocks as healthy and the MSCI EM index is still higher by 5.5% on a total return basis this month even after last week’s 1% pullback.
Bonds: Treasury Yields Rise For The ‘Right Reasons;’ 2Q GDP Revision, Lower Jobless Claims, Sticky Inflation Throw Cold Water On The Idea That Aggressive Monetary Policy Easing Is In The Cards.
10-Year Treasury Yield Continues To Move Higher, Closes Above 4.15% On Better Than Expected Economic Data. The U.S. Treasury yield curve flattened over the balance of last week as 2Q25 GDP was revised higher to 3.8% Q/Q from the prior 3.3% estimate, leading to a 7-basis point rise in the 2-year yield and a less drastic 5- basis point move in the 10-year Treasury yield. With the short end of the curve tied to expectations surrounding the path forward for the Fed funds rate, the rise in yields is primarily a function of market participants expecting a more gradual pace of rate cuts to materialize in the coming quarters. However, the move can also be attributable to modest improvement in the outlook for U.S. economic growth as well, along with continued sticky inflation evident in the August PCE release. Given the backdrop outlined above, we continue to see risks skewed to the upside for Treasury yields and to the downside for prices, and we are now looking at the 4.20% level for the 10-year yield as resistance that, if broken, could spur a move back into the 4.20% to 4.60% range that held from May through the end of August. A move back into this trading range would likely lead to outperformance from high yield corporate bonds relative to investment-grade issues.
Credit Spreads On Corporate Bonds Widen As Issuance Ramps Up, But Economic Data Is Supportive Of Tight Credit Spreads. As Treasury yields rose and U.S. equities wobbled to wrap up last week, corporate bonds saw modest downside as well. The Bloomberg Corporate Bond index and U.S. High Yield Corporate index turned out losses of 0.4% and 0.2%, respectively, on the week as credit spreads widened and issuance remained elevated. The credit spread over U.S. Treasuries for the Bloomberg U.S. Corporate High Yield index closed out the week at 269 basis points, or just 17 basis points above November 2024 tight levels. Investment grade spreads widened by 2 basis points on the week, closing at 73 basis points over similar duration Treasuries, even as weekly issuance topped $56B and approached $200B for the month of September. It’s notable that the $200B monthly threshold has only been surpassed 3 times previously, all in 2020. With another $25B of corporate issuance projected for next week, modest credit spread widening could be in the cards in the near term. We attribute tight credit spreads to investors looking to lock in high absolute yields prior to further cuts to the Fed funds rate, and with economic data surprising to the upside last week providing further evidence of a resilient U.S. economy, credit spreads are unlikely to widen materially in the near-term as investors are willing to reach for yield in riskier pockets of the fixed income market.
August Inflation Data In-Line With Estimates, While Income/Spending Surprise To The Upside. August Personal Consumption Expenditure (PCE) was released Friday with the headline reading rising 0.3% month over month and 2.7% year over year, in-line with consensus estimates. Core PCE, which the FOMC pays close attention to, rose 0.2% month over month and 2.9% year over year, and both readings were also in-line with estimates.August PCE likely won’t alter the path forward for the Fed as inflation remains sticky at elevated levels but also shows few signs of getting out of hand and running away to the upside. PCE was ultimately a non-event for the market, but in concert with that release came August Personal Income and Spending data from August. Personal Income rose 0.6% during the month, while spending rose 0.4%, both 0.1% above the consensus estimate, and real personal spending rose 0.4%, above the 0.2% estimate. All told, these readings are encouraging and leave us with the view that U.S. consumers remain willing and able to spend, which could lead to upward revisions to economic growth and inflation estimates in the coming quarter(s), potentially putting upward pressure on Treasury yields and leading investors to price out rate cuts.
Initial, Continuing Claims Point To Some Recent Stabilization In The Labor Market. Initial jobless claims for the week ended September 20 and continuing jobless claims for the week ended September 13 were released Thursday and both readings came in below the consensus estimate. Initial claims fell to 218k from 233k the prior week, while continuing claims fell to 1,926k from 1,932k the prior week, which on the surface may appear to be modest moves lower, but after an unsettling rise in both metrics at the start of September, these readings don’t back up the view that the labor market has weakened materially in recent weeks. Combined with 2Q GDP coming in above the consensus estimate, initial and continuing claims dropping week over week also helped throw a bucket of cold water on hopes for cuts to the Fed funds rate between now and year-end. Fed funds futures ratcheted lower expectations for cuts between now and year-end and now project less than 40-basis points of cuts, while slightly favoring a cut in October over one in December.
IMPORTANT DISCLOSURES: THIS PUBLICATION HAS BEEN PREPARED BY THE STAFF OF HIGHLAND ASSOCIATES, INC. FOR DISTRIBUTION TO, AMONG OTHERS, HIGHLAND ASSOCIATES, INC. CLIENTS. HIGHLAND ASSOCIATES IS REGISTERED WITH THE UNITED STATES SECURITY AND EXCHANGE COMMISSION UNDER THE INVESTMENT ADVISORS ACT OF 1940. HIGHLAND ASSOCIATES IS A WHOLLY OWNED SUBSIDIARY OF REGIONS BANK, WHICH IN TURN IS A WHOLLY OWNED SUBSIDIARY OF REGIONS FINANCIAL CORPORATION. RESEARCH SERVICES ARE PROVIDED THROUGH MULTI-ASSET SOLUTIONS, A DEPARTMENT OF THE REGIONS ASSET MANAGEMENT BUSINESS GROUP WITHIN REGIONS BANK. THE INFORMATION AND MATERIAL CONTAINED HEREIN IS PROVIDED SOLELY FOR GENERAL INFORMATION PURPOSES ONLY. TO THE EXTENT THESE MATERIALS REFERENCE REGIONS BANK DATA, SUCH MATERIALS ARE NOT INTENDED TO BE REFLECTIVE OR INDICATIVE OF, AND SHOULD NOT BE RELIED UPON AS, THE RESULTS OF OPERATIONS, FINANCIAL CONDITIONS OR PERFORMANCE OF REGIONS BANK. UNLESS OTHERWISE SPECIFICALLY STATED, ANY VIEWS, OPINIONS, ANALYSES, ESTIMATES AND STRATEGIES, AS THE CASE MAY BE (“VIEWS”), EXPRESSED IN THIS CONTENT ARE THOSE OF THE RESPECTIVE AUTHORS AND SPEAKERS NAMED IN THOSE PIECES AND MAY DIFFER FROM THOSE OF REGIONS BANK AND/OR OTHER REGIONS BANK EMPLOYEES AND AFFILIATES. VIEWS AND ESTIMATES CONSTITUTE OUR JUDGMENT AS OF THE DATE OF THESE MATERIALS, ARE OFTEN BASED ON CURRENT MARKET CONDITIONS, AND ARE SUBJECT TO CHANGE WITHOUT NOTICE. ANY EXAMPLES USED ARE GENERIC, HYPOTHETICAL AND FOR ILLUSTRATION PURPOSES ONLY. ANY PRICES/QUOTES/STATISTICS INCLUDED HAVE BEEN OBTAINED FROM SOURCES BELIEVED TO BE RELIABLE, BUT HIGHLAND ASSOCIATES, INC. DOES NOT WARRANT THEIR COMPLETENESS OR ACCURACY. THIS INFORMATION IN NO WAY CONSTITUTES RESEARCH AND SHOULD NOT BE TREATED AS SUCH. THE VIEWS EXPRESSED HEREIN SHOULD NOT BE CONSTRUED AS INDIVIDUAL INVESTMENT ADVICE FOR ANY PARTICULAR PERSON OR ENTITY AND ARE NOT INTENDED AS RECOMMENDATIONS OF PARTICULAR SECURITIES, FINANCIAL INSTRUMENTS, STRATEGIES OR BANKING SERVICES FOR A PARTICULAR PERSON OR ENTITY. THE NAMES AND MARKS OF OTHER COMPANIES OR THEIR SERVICES OR PRODUCTS MAY BE THE TRADEMARKS OF THEIR OWNERS AND ARE USED ONLY TO IDENTIFY SUCH COMPANIES OR THEIR SERVICES OR PRODUCTS AND NOT TO INDICATE ENDORSEMENT, SPONSORSHIP, OR OWNERSHIP BY REGIONS OR HIGHLAND ASSOCIATES. EMPLOYEES OF HIGHLAND ASSOCIATES, INC., MAY HAVE POSITIONS IN SECURITIES OR THEIR DERIVATIVES THAT MAY BE MENTIONED IN THIS REPORT. ADDITIONALLY, HIGHLAND’S CLIENTS AND COMPANIES AFFILIATED WITH HIGHLAND ASSOCIATES MAY HOLD POSITIONS IN THE MENTIONED COMPANIES IN THEIR PORTFOLIOS OR STRATEGIES. THIS MATERIAL DOES NOT CONSTITUTE AN OFFER OR AN INVITATION BY OR ON BEHALF OF HIGHLAND ASSOCIATES TO ANY PERSON OR ENTITY TO BUY OR SELL ANY SECURITY OR FINANCIAL INSTRUMENT OR ENGAGE IN ANY BANKING SERVICE. NOTHING IN THESE MATERIALS CONSTITUTES INVESTMENT, LEGAL, ACCOUNTING OR TAX ADVICE. NON-DEPOSIT PRODUCTS INCLUDING INVESTMENTS, SECURITIES, MUTUAL FUNDS, INSURANCE PRODUCTS, CRYPTO ASSETS AND ANNUITIES: ARE NOT FDIC-INSURED I ARE NOT A DEPOSIT I MAY GO DOWN IN VALUE I ARE NOT BANK GUARANTEED I ARE NOT INSURED BY ANY FEDERAL GOVERNMENT AGENCY I ARE NOT A CONDITION OF ANY BANKING ACTIVITY.
NEITHER REGIONS BANK NOR REGIONS ASSET MANAGEMENT (COLLECTIVELY, “REGIONS”) ARE REGISTERED MUNICIPAL ADVISORS NOR PROVIDE ADVICE TO MUNICIPAL ENTITIES OR OBLIGATED PERSONS WITH RESPECT TO MUNICIPAL FINANCIAL PRODUCTS OR THE ISSUANCE OF MUNICIPAL SECURITIES (INCLUDING REGARDING THE STRUCTURE, TIMING, TERMS AND SIMILAR MATTERS CONCERNING MUNICIPAL FINANCIAL PRODUCTS OR MUNICIPAL SECURITIES ISSUANCES) OR ENGAGE IN THE SOLICITATION OF MUNICIPAL ENTITIES OR OBLIGATED PERSONS FOR SUCH SERVICES. WITH RESPECT TO THIS PRESENTATION AND ANY OTHER INFORMATION, MATERIALS OR COMMUNICATIONS PROVIDED BY REGIONS, (A) REGIONS IS NOT RECOMMENDING AN ACTION TO ANY MUNICIPAL ENTITY OR OBLIGATED PERSON, (B) REGIONS IS NOT ACTING AS AN ADVISOR TO ANY MUNICIPAL ENTITY OR OBLIGATED PERSON AND DOES NOT OWE A FIDUCIARY DUTY PURSUANT TO SECTION 15B OF THE SECURITIES EXCHANGE ACT OF 1934 TO ANY MUNICIPAL ENTITY OR OBLIGATED PERSON WITH RESPECT TO SUCH PRESENTATION, INFORMATION, MATERIALS OR COMMUNICATIONS, (C) REGIONS IS ACTING FOR ITS OWN INTERESTS, AND (D) YOU SHOULD DISCUSS THIS PRESENTATION AND ANY SUCH OTHER INFORMATION, MATERIALS OR COMMUNICATIONS WITH ANY AND ALL INTERNAL AND EXTERNAL ADVISORS AND EXPERTS THAT YOU DEEM APPROPRIATE BEFORE ACTING ON THIS PRESENTATION OR ANY SUCH OTHER INFORMATION, MATERIALS OR COMMUNICATIONS.
SOURCE: BLOOMBERG INDEX SERVICES LIMITED. BLOOMBERG® IS A TRADEMARK AND SERVICE MARK OF BLOOMBERG FINANCE L.P. AND ITS AFFILIATES (COLLECTIVELY “BLOOMBERG”). BARCLAYS® IS A TRADEMARK AND SERVICE MARK OF BARCLAYS BANK PLC (COLLECTIVELY WITH ITS AFFILIATES, “BARCLAYS”), USED UNDER LICENSE. BLOOMBERG OR BLOOMBERG’S LICENSORS, INCLUDING BARCLAYS, OWN ALL PROPRIETARY RIGHTS IN THE BLOOMBERG BARCLAYS INDICES. NEITHER BLOOMBERG NOR BARCLAYS APPROVES OR ENDORSES THIS MATERIAL OR GUARANTEES THE ACCURACY OR COMPLETENESS OF ANY INFORMATION HEREIN, OR MAKES ANY WARRANTY, EXPRESS OR IMPLIED, AS TO THE RESULTS TO BE OBTAINED THEREFROM AND, TO THE MAXIMUM EXTENT ALLOWED BY LAW, NEITHER SHALL HAVE ANY LIABILITY OR RESPONSIBILITY FOR INJURY OR DAMAGES ARISING IN CONNECTION THEREWITH.