Stocks: Rising Tensions In The Middle East Force Energy Prices Higher, Weighing On Investor Sentiment And Risk Appetite; China A Standout For Another Week, But We Remain Skeptical.
Download Weekly Market Commentary | October 7 2024
What We’re Watching:
- The National Federation of Independent Business (NFIB) small business optimism survey for September is released Tuesday with a reading of 92.0 expected, which would be a modest improvement from the 91.2 reading in August.
- U.S. Consumer Price Index (CPI) for September is released Wednesday. Headline CPI is expected to rise 0.1% month over month and 2.3% year over year after 0.2% and 2.5% readings in August. Core CPI, which excludes food and energy, is expected to rise 0.2% month over month and 3.2% year over year versus 0.3% and 3.2% readings the prior month.
- The University of Michigan’s Consumer Sentiment Index for October is released Friday with a 70.5 reading expected, which would be slightly above the 70.1 reading in September.
Key Observations
- Rising tensions in the Middle East pushed energy prices higher and weighed on investor sentiment and risk appetite over the balance of the week, leading to choppy and rudderless price action. A series of U.S. economic data releases were better than expected, broadly speaking, creating uncertainty surrounding the path forward for economic growth, inflation, and monetary policy, contributing to heightened interest rate volatility in the process.
- Markets in mainland China were closed for Golden Week, but Chinese stocks traded in Hong Kong continued to rally and the MSCI China index is now higher by over 37% in the past month. While we remain constructive on emerging markets broadly and believe China’s stimulus efforts will put a higher floor under global economic growth, we question the sustainability of the rise in Chinese stocks as much of the move appears to have been driven by short covering, and the rally in the U.S. dollar in recent weeks could also pose a headwind to this cohort of stocks.
- Bonds had a rough week as encouraging economic data releases created uncertainty surrounding the outlook for U.S. growth, inflation and the path forward for monetary policy, putting upward pressure on U.S. Treasury yields. Lower yielding and more interest rate sensitive U.S. Treasuries and investment grade corporates fared poorly on an absolute and relative basis while riskier high yield bonds and emerging market debt also gave ground but performed well on a relative basis due to higher yields and/or shorter maturity profiles.
What Happened Last Week:
Stocks: Rising Tensions In The Middle East Force Energy Prices Higher, Weighing On Investor Sentiment And Risk Appetite; China A Standout For Another Week, But We Remain Skeptical.
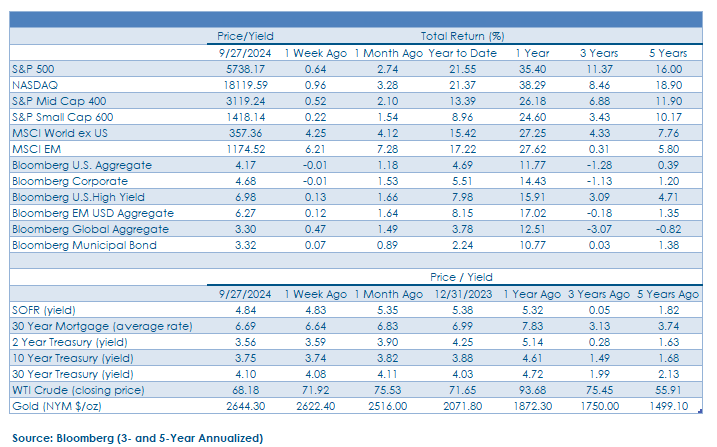
U.S. Stocks Moe Sideways To Kick Off The Month As Geopolitical Tensions Weigh On Risk Appetite, Offsetting Encouraging Economic Data. The S&P 500 finished the week with a modest 0.1% gain as the communication services, energy, financial services, industrials, and utilities sectors each turned out a 0.5% or greater return on the week. Energy was far and away the best performing sector with a 6.8% weekly gain, On the other side of the ledger, consumer discretionary, consumer staples, health care, materials, and real estate lagged. Given the strange mix of sectors in the leaders and laggards categories, we take very little away from last week’s price action. Investors may be looking to sell into strength in the lead-up to earnings season and the election in November, but we will continue to take our cue from market breadth, and with over 70% of S&P 500 constituents trading above their 50- and 200- day moving average as of last Friday, U.S. large cap stocks appear to be on strong footing into year-end. Notably, after faltering early in the week, the S&P Small Cap 600 index staged a comeback on Friday as a blowout September nonfarm payrolls report boosted optimism surrounding the U.S. economy and sentiment for stocks of smaller companies that have lagged the S&P 500 meaningfully since the end of July.
Crude Oil, Energy Stocks Rise As Fears Of Escalation In The Middle East Build, But Inventories Remain High. Tensions in the Middle East continued to escalate last week, rekindling concerns that global crude oil supply could be negatively impacted. Prices of “black gold” rose because of these fears with West Texas Intermediate (WTI) crude jumping from $68.18 to 74.38 a barrel. The 9% weekly jump in WTI led to positive price momentum in the beleaguered S&P 500 energy sector, evidenced by its 6.8% gain, the sector’s strongest weekly performance since March of 2023. The bounce in energy stocks shows the value of maintaining a diversified equity portfolio and staying close to market- weight in undervalued areas, but it’s notable that the energy sector is still lagging even some of the historically least volatile sectors such as utilities and consumer staples year to date. Approximately 1.5M barrels per day, or roughly half of OPEC’s daily production, could potentially be offline should a targeted attack on Iran take place, but it’s worth noting that OPEC is holding back roughly 6M in spare capacity that could reenter the market if oil prices top $75 to $80 per barrel. This supply dynamic is reflected in the futures curve with prices of oil contracts for delivery in the coming months trading below the current month contract, signaling prices are expected to fall in coming months as demand shrinks and/or supply picks up to take advantage of currently elevated prices. The supply/demand imbalance appears to be widening after U.S. crude oil inventories have surprised to the upside in recent weeks as potential buyers may be willing to stay on the sidelines for now and await lower prices in the coming months.
Chinese Equities, While Overbought, Drive Continued Gains For Emerging Market Indices The MSCI Emerging Markets (EM) index ended the week with a 0.4% gain and outperformed U.S. stocks for the 3rd consecutive week. The MSCI China index gained another 11.7% on the week and was easily the best performing country exposure in the EM index. The rally in Chinese stocks began with stimulus announcements two weeks ago and has persisted into early October, leading the MSCI EM to its best performance stretch since May. Investors have been clamoring to get back to market-weight exposure to Chinese stocks after being consistently underweight post-COVID as the country’s economy has lagged. The advance last week comes as onshore markets were closed for the Golden Week holiday, a potential indication that it wasn’t news flow but instead the prospect of further easing that is enticing traders to chase recent gains. With momentum carrying the country’s stock market well into overbought territory regardless of how you slice it, we’d prefer to see some sideways price action above key levels to confirm a trend change from bearish to bullish. Admittedly, we’re skeptical this ongoing China trade is anything more than that for now but stand ready to re-evaluate that stance should we see follow-through. It’s notable that while Chinese stocks had another good week, those gains appeared to come at the expense of India, South Africa, South Korea, and Taiwan, among others, with indices tied to those four countries falling between 1.7% and 4.3% on the week.
Bonds: Rough Week For Longer Duration Bonds As Treasury Yields Close The Week Higher As Better Economic Data Forces Investors To Revisit Growth And Inflation Expectations; Strong Payrolls Report Forces Market Participants To Temper Expectations For Rate Cuts Through Year-End.
Treasury Yields Close Higher As Labor Market Data, Global Central Bank Easing Rekindles Inflation Concerns. U.S. Treasury yields pushed higher over the balance of last week as stronger economic and labor market data forced market participants to reconsider their views on economic growth and inflation. Tuesday’s JOLTS report was notable as job openings rose more than expected by 347k and was followed by the ADP employment report that saw an upside surprise of 18K with both figures registering upward revisions to the prior month’s data. Lastly, on Friday, September Nonfarm Payrolls growth shattered expectations to the tune of 254K jobs added during the month, well above the consensus estimate of 150K, with an upward revision to both the July and August data that sent the 10-year Treasury yield higher by 13-basis points on the day to 3.98%. While these data releases on an individual basis are less than reliable given low response rates and seasonal adjustments, among other reasons, but when taken together these metrics gives us a useful baseline on current employment trends which currently suggest that concerns surrounding a weaker labor market and economic downturn are overblown.
Better Labor Market Data Throws Cold Water On The Economic Slowdown Narrative. Last week was an active one on the economic data front and, on balance, releases pointed toward a stabilizing labor market and potentially a reacceleration of U.S. economic growth in September. Initial and continuing jobless claims were again in-line with expectations on Thursday and the September nonfarm payrolls report on Friday showed 254k jobs were created during the month, well ahead of the 150k estimate, with the unemployment rate falling to 4.1% from 4.2% the prior month. On balance, these releases point toward stability returning to the labor market which should be supportive of improved consumer confidence, and potentially spending, in the coming months.
Market Participants Recalibrate Rate Cut Expectations In A Big Way. Outside of the nonfarm payrolls report on Friday, one other notable economic release during the week contributed to upward pressure on Treasury yields. The Institute for Supply Management (ISM) Services Purchasing Managers Index (PMI) headline reading jumped to 54.9 from 51.7 in August (a reading above 50 indicates expansion or growth), and the prices paid component of this index rose to 59.4 from 56.0 the prior month. Strength in the services sector has been a hallmark of the U.S. economy in the past couple of years, but the month over month rise in the Services PMI is indicative of potential economic reacceleration taking root, and the sharp rise in the prices paid component of the index shouldn’t be dismissed as it could point toward building inflationary pressures in the coming months, calling into question how aggressively the FOMC may be able to cut the Fed funds rate between now and year-end. On the heels of the stronger payrolls report and Services PMI, Fed funds futures reduced the likelihood of a 50-basis point rate cut the FOMC’s November or December meeting and now expect a total of 50-basis points of rate cuts between now and year-end, down from 75 after the FOMC’s September meeting. Also of note, futures now show the Fed funds rate hitting 3% in January of 2026 versus July of 2025 as strength in the labor market is expected to allow the FOMC to gradually make monetary policy less restrictive.
IMPORTANT DISCLOSURES: THIS PUBLICATION HAS BEEN PREPARED BY THE STAFF OF HIGHLAND ASSOCIATES, INC. FOR DISTRIBUTION TO, AMONG OTHERS, HIGHLAND ASSOCIATES, INC. CLIENTS. HIGHLAND ASSOCIATES IS REGISTERED WITH THE UNITED STATES SECURITY AND EXCHANGE COMMISSION UNDER THE INVESTMENT ADVISORS ACT OF 1940. HIGHLAND ASSOCIATES IS A WHOLLY OWNED SUBSIDIARY OF REGIONS BANK, WHICH IN TURN IS A WHOLLY OWNED SUBSIDIARY OF REGIONS FINANCIAL CORPORATION. RESEARCH SERVICES ARE PROVIDED THROUGH MULTI-ASSET SOLUTIONS, A DEPARTMENT OF THE REGIONS ASSET MANAGEMENT BUSINESS GROUP WITHIN REGIONS BANK. THE INFORMATION AND MATERIAL CONTAINED HEREIN IS PROVIDED SOLELY FOR GENERAL INFORMATION PURPOSES ONLY. TO THE EXTENT THESE MATERIALS REFERENCE REGIONS BANK DATA, SUCH MATERIALS ARE NOT INTENDED TO BE REFLECTIVE OR INDICATIVE OF, AND SHOULD NOT BE RELIED UPON AS, THE RESULTS OF OPERATIONS, FINANCIAL CONDITIONS OR PERFORMANCE OF REGIONS BANK. UNLESS OTHERWISE SPECIFICALLY STATED, ANY VIEWS, OPINIONS, ANALYSES, ESTIMATES AND STRATEGIES, AS THE CASE MAY BE (“VIEWS”), EXPRESSED IN THIS CONTENT ARE THOSE OF THE RESPECTIVE AUTHORS AND SPEAKERS NAMED IN THOSE PIECES AND MAY DIFFER FROM THOSE OF REGIONS BANK AND/OR OTHER REGIONS BANK EMPLOYEES AND AFFILIATES. VIEWS AND ESTIMATES CONSTITUTE OUR JUDGMENT AS OF THE DATE OF THESE MATERIALS, ARE OFTEN BASED ON CURRENT MARKET CONDITIONS, AND ARE SUBJECT TO CHANGE WITHOUT NOTICE. ANY EXAMPLES USED ARE GENERIC, HYPOTHETICAL AND FOR ILLUSTRATION PURPOSES ONLY. ANY PRICES/QUOTES/STATISTICS INCLUDED HAVE BEEN OBTAINED FROM SOURCES BELIEVED TO BE RELIABLE, BUT HIGHLAND ASSOCIATES, INC. DOES NOT WARRANT THEIR COMPLETENESS OR ACCURACY. THIS INFORMATION IN NO WAY CONSTITUTES RESEARCH AND SHOULD NOT BE TREATED AS SUCH. THE VIEWS EXPRESSED HEREIN SHOULD NOT BE CONSTRUED AS INDIVIDUAL INVESTMENT ADVICE FOR ANY PARTICULAR PERSON OR ENTITY AND ARE NOT INTENDED AS RECOMMENDATIONS OF PARTICULAR SECURITIES, FINANCIAL INSTRUMENTS, STRATEGIES OR BANKING SERVICES FOR A PARTICULAR PERSON OR ENTITY. THE NAMES AND MARKS OF OTHER COMPANIES OR THEIR SERVICES OR PRODUCTS MAY BE THE TRADEMARKS OF THEIR OWNERS AND ARE USED ONLY TO IDENTIFY SUCH COMPANIES OR THEIR SERVICES OR PRODUCTS AND NOT TO INDICATE ENDORSEMENT, SPONSORSHIP, OR OWNERSHIP BY REGIONS OR HIGHLAND ASSOCIATES. EMPLOYEES OF HIGHLAND ASSOCIATES, INC., MAY HAVE POSITIONS IN SECURITIES OR THEIR DERIVATIVES THAT MAY BE MENTIONED IN THIS REPORT. ADDITIONALLY, HIGHLAND’S CLIENTS AND COMPANIES AFFILIATED WITH HIGHLAND ASSOCIATES MAY HOLD POSITIONS IN THE MENTIONED COMPANIES IN THEIR PORTFOLIOS OR STRATEGIES. THIS MATERIAL DOES NOT CONSTITUTE AN OFFER OR AN INVITATION BY OR ON BEHALF OF HIGHLAND ASSOCIATES TO ANY PERSON OR ENTITY TO BUY OR SELL ANY SECURITY OR FINANCIAL INSTRUMENT OR ENGAGE IN ANY BANKING SERVICE. NOTHING IN THESE MATERIALS CONSTITUTES INVESTMENT, LEGAL, ACCOUNTING OR TAX ADVICE. NON-DEPOSIT PRODUCTS INCLUDING INVESTMENTS, SECURITIES, MUTUAL FUNDS, INSURANCE PRODUCTS, CRYPTO ASSETS AND ANNUITIES: ARE NOT FDIC-INSURED I ARE NOT A DEPOSIT I MAY GO DOWN IN VALUE I ARE NOT BANK GUARANTEED I ARE NOT INSURED BY ANY FEDERAL GOVERNMENT AGENCY I ARE NOT A CONDITION OF ANY BANKING ACTIVITY.
NEITHER REGIONS BANK NOR REGIONS ASSET MANAGEMENT (COLLECTIVELY, “REGIONS”) ARE REGISTERED MUNICIPAL ADVISORS NOR PROVIDE ADVICE TO MUNICIPAL ENTITIES OR OBLIGATED PERSONS WITH RESPECT TO MUNICIPAL FINANCIAL PRODUCTS OR THE ISSUANCE OF MUNICIPAL SECURITIES (INCLUDING REGARDING THE STRUCTURE, TIMING, TERMS AND SIMILAR MATTERS CONCERNING MUNICIPAL FINANCIAL PRODUCTS OR MUNICIPAL SECURITIES ISSUANCES) OR ENGAGE IN THE SOLICITATION OF MUNICIPAL ENTITIES OR OBLIGATED PERSONS FOR SUCH SERVICES. WITH RESPECT TO THIS PRESENTATION AND ANY OTHER INFORMATION, MATERIALS OR COMMUNICATIONS PROVIDED BY REGIONS, (A) REGIONS IS NOT RECOMMENDING AN ACTION TO ANY MUNICIPAL ENTITY OR OBLIGATED PERSON, (B) REGIONS IS NOT ACTING AS AN ADVISOR TO ANY MUNICIPAL ENTITY OR OBLIGATED PERSON AND DOES NOT OWE A FIDUCIARY DUTY PURSUANT TO SECTION 15B OF THE SECURITIES EXCHANGE ACT OF 1934 TO ANY MUNICIPAL ENTITY OR OBLIGATED PERSON WITH RESPECT TO SUCH PRESENTATION, INFORMATION, MATERIALS OR COMMUNICATIONS, (C) REGIONS IS ACTING FOR ITS OWN INTERESTS, AND (D) YOU SHOULD DISCUSS THIS PRESENTATION AND ANY SUCH OTHER INFORMATION, MATERIALS OR COMMUNICATIONS WITH ANY AND ALL INTERNAL AND EXTERNAL ADVISORS AND EXPERTS THAT YOU DEEM APPROPRIATE BEFORE ACTING ON THIS PRESENTATION OR ANY SUCH OTHER INFORMATION, MATERIALS OR COMMUNICATIONS.
SOURCE: BLOOMBERG INDEX SERVICES LIMITED. BLOOMBERG® IS A TRADEMARK AND SERVICE MARK OF BLOOMBERG FINANCE L.P. AND ITS AFFILIATES (COLLECTIVELY “BLOOMBERG”). BARCLAYS® IS A TRADEMARK AND SERVICE MARK OF BARCLAYS BANK PLC (COLLECTIVELY WITH ITS AFFILIATES, “BARCLAYS”), USED UNDER LICENSE. BLOOMBERG OR BLOOMBERG’S LICENSORS, INCLUDING BARCLAYS, OWN ALL PROPRIETARY RIGHTS IN THE BLOOMBERG BARCLAYS INDICES. NEITHER BLOOMBERG NOR BARCLAYS APPROVES OR ENDORSES THIS MATERIAL OR GUARANTEES THE ACCURACY OR COMPLETENESS OF ANY INFORMATION HEREIN, OR MAKES ANY WARRANTY, EXPRESS OR IMPLIED, AS TO THE RESULTS TO BE OBTAINED THEREFROM AND, TO THE MAXIMUM EXTENT ALLOWED BY LAW, NEITHER SHALL HAVE ANY LIABILITY OR RESPONSIBILITY FOR INJURY OR DAMAGES ARISING IN CONNECTION THEREWITH.