Stocks: U.S. Large Caps Rally, Close The Week At An All-Time High; Profit Taking Continues In Some Of 2025’s Hottest Themes; Breadth Abroad Looking Up; Precious Metals Pull Back After Parabolic Move To The Upside.
Download Weekly Market Commentary | October 27 2025
What We’re Watching:
- Earnings, earnings, and more earnings! Five of the members of the ‘Magnificent 7’ are set to post quarterly results this week with Alphabet, Meta Platforms, and Microsoft reporting Wednesday and Amazon and Apple reporting Thursday. With the S&P 500 closing out the week just shy of an all-time high, these earnings releases will dictate whether the index can break out to the upside this month in advance of the historically strong November through January time frame.
- The Conference Board releases its Consumer Confidence survey for October on Tuesday with the reading expected to fall modestly to 93.4 from 94.2 in September.
- The Federal Open Market Committee (FOMC) concludes its two-day meeting on Wednesday and is widely expected to cut the Fed funds rate by 0.25%. We will be closely monitoring Chair Jerome Powell’s post-meeting press conference for any hints as to what the Committee might do next and how they plan to navigate an environment that could continue to be characterized by scarce economic data.
Key Observations
- The positioning shakeout in some of 2025’s best performing themes continued for the second consecutive week as profit taking was evident early in the week as companies tied to artificial intelligence, data centers, precious metals mining, nuclear energy, and quantum computing, among other industries, experienced sizable drawdowns before most rebounded into the weekend.
- Capital flowing out of some of this year’s biggest winners made its way into the ‘Magnificent 7’ as Tesla posted quarterly results and five other members of this cohort of stocks prepared to report in the coming week. The information technology sector was the best performer on the week, followed by energy, industrials, and health care, all of which outperformed the broader S&P 500 index on the week.
- It was a non-event week in the fixed income market as yields across the Treasury curve strayed very little from where they began the week. With yields and credit spreads steady over the balance of the week, holders of investment-grade and high yield corporate bonds had a clip your coupon type week. Minimal movement in Treasury yields along with stable credit spreads provides a supportive backdrop for stocks and riskier corporate bonds.
What Happened Last Week:
Stocks: U.S. Large Caps Rally, Close The Week At An All-Time High; Profit Taking Continues In Some Of 2025’s Hottest Themes; Breadth Abroad Looking Up; Precious Metals Pull Back After Parabolic Move To The Upside.
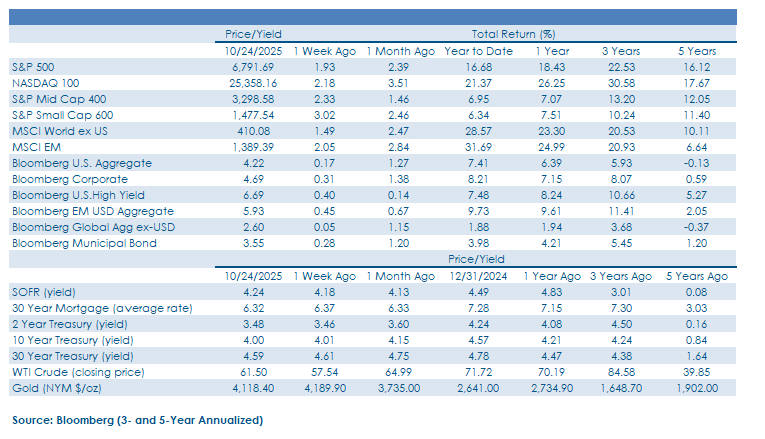
U.S. Large Caps Tack On Gains, Close The Week At New All-Time High. There was finally resolution to the S&P 500’s recent trading range as the U.S. large cap index broke out to the upside on Friday and closed out the week just shy of 6,800 after a cooler September CPI report. With five of the ‘Magnificent 7’ set to post quarterly results in the coming week and President Trump slated to meet with Chinese President Xi on Friday with hopes for a trade deal high, volatility could pick up, but we expect the S&P 500’s 50-day moving average, currently just below 6,600, will provide support and limit any drawdown in the broader market into year-end. With almost 80% of the companies having posted quarterly results topping the consensus estimate for earnings per share, and with the FOMC likely to cut the Funds rate this week, we expect ‘buy any dip’ to remain the market’s mantra.
Profit Taking In Some Of 2025’s Hottest Themes/Factors A Healthy Event. For the second consecutive week, rotation out of some of this year’s ‘hot dots’ was evident as profit taking continued to take a toll on high flying names tied to themes such as artificial intelligence, data centers, precious metals mining, nuclear energy, and quantum computing, among others. These themes have been highly correlated with one another, rising in tandem since the April lows as these areas have been attractive hunting grounds for strategies focused on owning stocks with the best/strongest momentum profile. The search for momentum has led strategies to buy stocks with the highest betas, or those making outsized moves higher relative to those of the broader market, and the greatest volatility due to these being the names exhibiting the strongest upside momentum year-to-date. However, momentum is a double-edged sword as it can drive substantial short-term gains as market participants lever up and press bets, but too much exposure to the momentum factor can be exceedingly painful when investors de-lever and reallocate capital elsewhere as they have in recent weeks. The shift out of high beta and high volatility factors that tend to be associated with story stocks and lower quality leadership is a healthy development and a sentiment reset puts the broader market on more stable footing. For the moment, market participants are looking for value and quality growth and are less willing to ride the momentum wave, but this could prove short-lived as the positive seasonal backdrop spurs risk taking and performance chasing. All told, investors gravitating back into quality in U.S. large cap stocks should provide a tailwind for the ‘Magnificent 7,’ specifically, and the S&P 500 into year-end.
All-Time Highs For Japan’s Nikkei Nothing New, But The Jury Is Still Out On Europe. Japan’s Nikkei 225 made more all-time closing highs last week and has now risen 31.5% year-to-date on a total return basis as yen weakness and improvements in corporate governance have garnered increased investor interest. We have been and remain impressed with the broad participation and leadership behind the move, and with over 75% of index constituents trading above their 20-day moving average and close to 90% trading above their 200-day moving average, it’s tough to make a bearish case on Japanese stocks at the present time. Japan’s rally likely has legs well into 2026 with the country recently electing a new prime minister that is a fan of fiscal spending. Europe-focused indices have bounced in October, pulled higher by France and Switzerland, but it’s notable that Germany hasn’t participated, sending up a caution flag for this cohort of stocks. We expect the European Central Bank (ECB) to stand pat on rates in the coming months, but with inflation cooling in the U.K. of late the Bank of England may have room to ease policy, potentially leading to relative outperformance out of the FTSE 100 versus the Eurostoxx 600 in the quarters to come. Valuations have been recalibrated and reset higher for Eurozone and U.K. stocks this year as earnings growth expectations have been ratcheted higher, but the earnings outlook remains murky, in our view, which leaves us skeptical that strong relative performance is sustainable into 2026.
Gold Reverses Course After Parabolic Move. Gold fell 3.2% on the week, ending a 9-week winning streak as investors took profits amid overbought conditions. Gold prices have garnered headlines after making an impressive move to the upside, with spot gold higher by 62% year-to-date through October 17 before last week’s modest pullback. After such a large move in a short period of time, and with no pullbacks to speak of along the way, positioning in precious metals became aggressive, and with massive inflows into gold-related ETFs in recent weeks a positioning shakeout is a healthy event. The rise in gold prices year-to-date has been driven by a confluence of powerful tailwinds. Central banks abroad have sold U.S. Treasuries and bought gold on the heels of tariff/trade uncertainty, putting downward pressure on the U.S. dollar in the process. This dynamic provided another tailwind as investors have sought out alternative stores of value due to concerns surrounding the U.S. dollar which weakened materially throughout the first six months of this year. Lastly, with Treasury yields falling and the Fed expected to cut rates further, the opportunity cost of holding precious metals, which turn off no income/cash flows, has decreased, increasing its appeal. With the U.S. dollar attempting to make a move back to late-July highs, enthusiasm surrounding gold could remain subdued in the near-term and we would wait for the price to base before considering adjusting allocations. Regarding sizing, precious metals should be a satellite position in portfolios due to their volatile nature, and any exposure should likely be capped at 5%, in our view.
Bonds: Minimal Movement For Treasury Yields On The Week Allows Holders To Clip Coupons; FOMC Set To Cut The Funds Rate Again This Week; Inflation Still Elevated, But Isn’t At Risk Of Running Away To The Upside.
Treasury Yields, Credit Spreads End The Week Little Changed. Treasury yields were well behaved over the balance of last week, with yields on bonds maturing inside of 6-months moving lower by between 5- and 8-basis points on the week as market participants briefly priced in more than 50-basis points of rate cuts prior to year-end. Longer-term yields strayed little from where they began the week, with the 10-year yield closing the week at 4%, down just 1 basis point on the week. From a technical perspective, it appears as though 3.95% is the line in the sand and new level worth watching as the 10-year encountered resistance at that level and bounced into the weekend as even a well-received/strong 20-year bond auction on Wednesday failed to push yields lower. With little movement in Treasury yields, investors in investment grade and high yield corporate bonds found themselves clipping coupons over the balance of the week as credit spreads stabilized after a bout of volatility the prior week.
Short On Economic Data, The FOMC Prepares To Cut Again. The Federal Open Market Committee (FOMC) concludes its two-day meeting on Wednesday and is widely expected to cut the funds rate by another 25-basis points.Fed funds futures place a 99% likelihood on a cut this week and view another cut in mid-December as a slam dunk as well. The confidence investors appear to have regarding the path forward for monetary policy in the U.S. is unlikely to be echoed by the FOMC this week. The U.S. government remains shut down, and as a result the Committee is forced to rely on unusual sources for data upon which to base its decision making.The FOMC does not release an updated dot plot at this meeting, so market participants will likely focus even more than they normally would on Chair Jerome Powell’s post-meeting remarks as they attempt to glean any insight into what the Committee anticipates it will do into year-end. We will be focused on how Chair Powell discusses the balance of risks between labor market softness and sticky inflation as last week’s CPI release is timelier than any labor market data available from government sources. Market participants have already placed their chips on the table by bidding up short-dated bonds, pulling the 2-year Treasury yield lower to 3.46% last Friday. The move lower in the 2-year yield implies that market participants believe current monetary policy is overly restrictive and that the FOMC will need to cut the funds rate further in the coming months. However, we would tread carefully as telegraphing further policy easing that will coincide with the end of balance sheet runoff or quantitative tightening (QT) could provide too much liquidity and spur a rise in inflation expectations while pushing long-term yields higher.
Cooler September CPI Doesn’t Alter The Path Forward For The FOMC. One of the few data points we’ve received from government sources since the start of the month was the September Consumer Price Index (CPI) last Friday. Headline CPI rose 0.3% month over month and 3.0% year over year, with both readings coming in 0.1% below the consensus estimate. Core CPI, which is more closely monitored by policymakers, rose 0.2% month over month and 3.0% year over year, which were both also 0.1% below the consensus estimate. While the FOMC isn’t in position to signal the all-clear on the inflation fighting front, the fact that CPI remains elevated but is exhibiting few/no signs of running away to the upside is likely good enough to warrant a rate cut this coming week. While the absence of bad news in the September CPI release is likely enough to get another ‘risk management cut’ out of the FOMC this week, the market’s view that at least a 25-basis point rate cut in December is a slam dunk may be called into question and come under closer scrutiny once the government reopens and data begins to flow as usual.
IMPORTANT DISCLOSURES: THIS PUBLICATION HAS BEEN PREPARED BY THE STAFF OF HIGHLAND ASSOCIATES, INC. FOR DISTRIBUTION TO, AMONG OTHERS, HIGHLAND ASSOCIATES, INC. CLIENTS. HIGHLAND ASSOCIATES IS REGISTERED WITH THE UNITED STATES SECURITY AND EXCHANGE COMMISSION UNDER THE INVESTMENT ADVISORS ACT OF 1940. HIGHLAND ASSOCIATES IS A WHOLLY OWNED SUBSIDIARY OF REGIONS BANK, WHICH IN TURN IS A WHOLLY OWNED SUBSIDIARY OF REGIONS FINANCIAL CORPORATION. RESEARCH SERVICES ARE PROVIDED THROUGH MULTI-ASSET SOLUTIONS, A DEPARTMENT OF THE REGIONS ASSET MANAGEMENT BUSINESS GROUP WITHIN REGIONS BANK. THE INFORMATION AND MATERIAL CONTAINED HEREIN IS PROVIDED SOLELY FOR GENERAL INFORMATION PURPOSES ONLY. TO THE EXTENT THESE MATERIALS REFERENCE REGIONS BANK DATA, SUCH MATERIALS ARE NOT INTENDED TO BE REFLECTIVE OR INDICATIVE OF, AND SHOULD NOT BE RELIED UPON AS, THE RESULTS OF OPERATIONS, FINANCIAL CONDITIONS OR PERFORMANCE OF REGIONS BANK. UNLESS OTHERWISE SPECIFICALLY STATED, ANY VIEWS, OPINIONS, ANALYSES, ESTIMATES AND STRATEGIES, AS THE CASE MAY BE (“VIEWS”), EXPRESSED IN THIS CONTENT ARE THOSE OF THE RESPECTIVE AUTHORS AND SPEAKERS NAMED IN THOSE PIECES AND MAY DIFFER FROM THOSE OF REGIONS BANK AND/OR OTHER REGIONS BANK EMPLOYEES AND AFFILIATES. VIEWS AND ESTIMATES CONSTITUTE OUR JUDGMENT AS OF THE DATE OF THESE MATERIALS, ARE OFTEN BASED ON CURRENT MARKET CONDITIONS, AND ARE SUBJECT TO CHANGE WITHOUT NOTICE. ANY EXAMPLES USED ARE GENERIC, HYPOTHETICAL AND FOR ILLUSTRATION PURPOSES ONLY. ANY PRICES/QUOTES/STATISTICS INCLUDED HAVE BEEN OBTAINED FROM SOURCES BELIEVED TO BE RELIABLE, BUT HIGHLAND ASSOCIATES, INC. DOES NOT WARRANT THEIR COMPLETENESS OR ACCURACY. THIS INFORMATION IN NO WAY CONSTITUTES RESEARCH AND SHOULD NOT BE TREATED AS SUCH. THE VIEWS EXPRESSED HEREIN SHOULD NOT BE CONSTRUED AS INDIVIDUAL INVESTMENT ADVICE FOR ANY PARTICULAR PERSON OR ENTITY AND ARE NOT INTENDED AS RECOMMENDATIONS OF PARTICULAR SECURITIES, FINANCIAL INSTRUMENTS, STRATEGIES OR BANKING SERVICES FOR A PARTICULAR PERSON OR ENTITY. THE NAMES AND MARKS OF OTHER COMPANIES OR THEIR SERVICES OR PRODUCTS MAY BE THE TRADEMARKS OF THEIR OWNERS AND ARE USED ONLY TO IDENTIFY SUCH COMPANIES OR THEIR SERVICES OR PRODUCTS AND NOT TO INDICATE ENDORSEMENT, SPONSORSHIP, OR OWNERSHIP BY REGIONS OR HIGHLAND ASSOCIATES. EMPLOYEES OF HIGHLAND ASSOCIATES, INC., MAY HAVE POSITIONS IN SECURITIES OR THEIR DERIVATIVES THAT MAY BE MENTIONED IN THIS REPORT. ADDITIONALLY, HIGHLAND’S CLIENTS AND COMPANIES AFFILIATED WITH HIGHLAND ASSOCIATES MAY HOLD POSITIONS IN THE MENTIONED COMPANIES IN THEIR PORTFOLIOS OR STRATEGIES. THIS MATERIAL DOES NOT CONSTITUTE AN OFFER OR AN INVITATION BY OR ON BEHALF OF HIGHLAND ASSOCIATES TO ANY PERSON OR ENTITY TO BUY OR SELL ANY SECURITY OR FINANCIAL INSTRUMENT OR ENGAGE IN ANY BANKING SERVICE. NOTHING IN THESE MATERIALS CONSTITUTES INVESTMENT, LEGAL, ACCOUNTING OR TAX ADVICE. NON-DEPOSIT PRODUCTS INCLUDING INVESTMENTS, SECURITIES, MUTUAL FUNDS, INSURANCE PRODUCTS, CRYPTO ASSETS AND ANNUITIES: ARE NOT FDIC-INSURED I ARE NOT A DEPOSIT I MAY GO DOWN IN VALUE I ARE NOT BANK GUARANTEED I ARE NOT INSURED BY ANY FEDERAL GOVERNMENT AGENCY I ARE NOT A CONDITION OF ANY BANKING ACTIVITY.
NEITHER REGIONS BANK NOR REGIONS ASSET MANAGEMENT (COLLECTIVELY, “REGIONS”) ARE REGISTERED MUNICIPAL ADVISORS NOR PROVIDE ADVICE TO MUNICIPAL ENTITIES OR OBLIGATED PERSONS WITH RESPECT TO MUNICIPAL FINANCIAL PRODUCTS OR THE ISSUANCE OF MUNICIPAL SECURITIES (INCLUDING REGARDING THE STRUCTURE, TIMING, TERMS AND SIMILAR MATTERS CONCERNING MUNICIPAL FINANCIAL PRODUCTS OR MUNICIPAL SECURITIES ISSUANCES) OR ENGAGE IN THE SOLICITATION OF MUNICIPAL ENTITIES OR OBLIGATED PERSONS FOR SUCH SERVICES. WITH RESPECT TO THIS PRESENTATION AND ANY OTHER INFORMATION, MATERIALS OR COMMUNICATIONS PROVIDED BY REGIONS, (A) REGIONS IS NOT RECOMMENDING AN ACTION TO ANY MUNICIPAL ENTITY OR OBLIGATED PERSON, (B) REGIONS IS NOT ACTING AS AN ADVISOR TO ANY MUNICIPAL ENTITY OR OBLIGATED PERSON AND DOES NOT OWE A FIDUCIARY DUTY PURSUANT TO SECTION 15B OF THE SECURITIES EXCHANGE ACT OF 1934 TO ANY MUNICIPAL ENTITY OR OBLIGATED PERSON WITH RESPECT TO SUCH PRESENTATION, INFORMATION, MATERIALS OR COMMUNICATIONS, (C) REGIONS IS ACTING FOR ITS OWN INTERESTS, AND (D) YOU SHOULD DISCUSS THIS PRESENTATION AND ANY SUCH OTHER INFORMATION, MATERIALS OR COMMUNICATIONS WITH ANY AND ALL INTERNAL AND EXTERNAL ADVISORS AND EXPERTS THAT YOU DEEM APPROPRIATE BEFORE ACTING ON THIS PRESENTATION OR ANY SUCH OTHER INFORMATION, MATERIALS OR COMMUNICATIONS.
SOURCE: BLOOMBERG INDEX SERVICES LIMITED. BLOOMBERG® IS A TRADEMARK AND SERVICE MARK OF BLOOMBERG FINANCE L.P. AND ITS AFFILIATES (COLLECTIVELY “BLOOMBERG”). BARCLAYS® IS A TRADEMARK AND SERVICE MARK OF BARCLAYS BANK PLC (COLLECTIVELY WITH ITS AFFILIATES, “BARCLAYS”), USED UNDER LICENSE. BLOOMBERG OR BLOOMBERG’S LICENSORS, INCLUDING BARCLAYS, OWN ALL PROPRIETARY RIGHTS IN THE BLOOMBERG BARCLAYS INDICES. NEITHER BLOOMBERG NOR BARCLAYS APPROVES OR ENDORSES THIS MATERIAL OR GUARANTEES THE ACCURACY OR COMPLETENESS OF ANY INFORMATION HEREIN, OR MAKES ANY WARRANTY, EXPRESS OR IMPLIED, AS TO THE RESULTS TO BE OBTAINED THEREFROM AND, TO THE MAXIMUM EXTENT ALLOWED BY LAW, NEITHER SHALL HAVE ANY LIABILITY OR RESPONSIBILITY FOR INJURY OR DAMAGES ARISING IN CONNECTION THEREWITH.