Stocks: S&P 500’s Losing Streak Hits Three Weeks; Attractive Valuations, Sector Exposures Are Feathers In The Cap Of U.S. Mid-Caps; U.S. Dollar Strength Weighs On Developed Market Stocks Abroad.
Download Weekly Market Commentary | November 24 2025
What We’re Watching:
- The Conference Board releases its Consumer Confidence survey for November on Tuesday with the reading expected to drop modestly to 93.4 from 94.6 in October.
- Initial jobless claims for the week ended November 22 are released Wednesday, with a reading of 225k expected, which would compare to a prior reading of 220k.
- Happy Thanksgiving! The Iron Bowl and Egg Bowl will be at the top of our list of things to watch this week.
Key Observations
- Limited liquidity contributed to some wild intra-day swings for U.S. equities, and that dynamic is unlikely to change in the coming week, which could lead to sizable moves on little/no news. Thursday’s reversal to the downside after opening sharply higher was disheartening and could tamp down sentiment and risk appetite, but Friday’s rally should provide investors with some hope that the worst of the deleveraging and repositioning is in the rearview mirror. The next week could bring with it more volatility as liquidity remains paltry, but we expect the backdrop for risk assets to improve once the calendar turns to December.
- Abroad, most Eurozone country indices, as well as Japan’s Nikkei 225 index, fell more than U.S. indices as sovereign bond yields rose and currencies weakened relative to the U.S. dollar – an unwelcome combination. Emerging market stocks were also poor performers as de-risking and de-leveraging negatively impacted this more volatile cohort of stocks. Country indices tied to China, South Korea, and Taiwan, which together account for over 60% of the MSCI EM index, each fell between 3.5% and 5% on the week as investors took profits and repositioned portfolios.
- Treasury yields fell as investors took a risk-off approach over the balance of the week, despite hawkish chatter out of a parade of voting and non-voting FOMC members over the balance of the week. Fed funds futures shifted into the weekend on NY Fed President John Williams’ remarks and were again favoring a rate cut at the Committee’s December 9-10 meeting, but expectations are likely to remain in-flux in the coming weeks, contributing to volatility in the rates market.
What Happened Last Week:
Stocks: S&P 500’s Losing Streak Hits Three Weeks; Attractive Valuations, Sector Exposures Are Feathers In The Cap Of U.S. Mid-Caps; U.S. Dollar Strength Weighs On Developed Market Stocks Abroad.
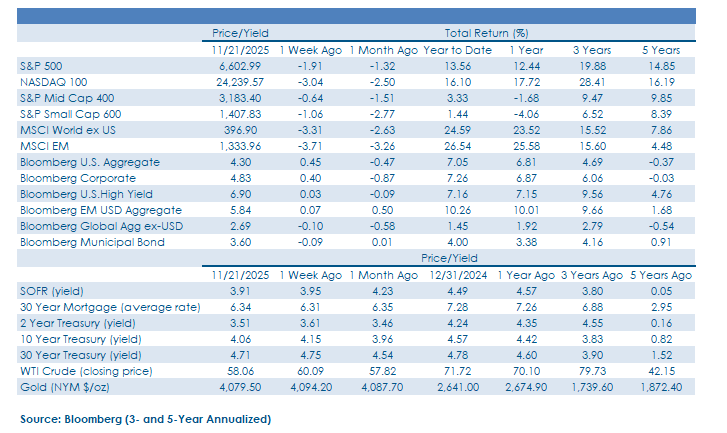
S&P 500 Posts Three-Week Losing Streak As Nvidia’s Impressive Quarterly Results Fail To Stem The Selling Tide. U.S. large cap stocks started off the week on shaky ground, with the S&P 500 falling 1.7% on Monday and Tuesday, and after reversing sharply lower on Thursday on the heels of Nvidia’s impressive earnings report, and then moving higher on Friday, the index closed the week lower by 1.9%. The consumer discretionary and information technology sectors were the biggest drags on the week, with the former falling 2.3% and the latter 5.1%. On the other side of the ledger, defensive sectors such as consumer staples and health care held up well, as did communication services, a sector with a split between offensive and defensive areas. Price action after Nvidia’s release was discouraging, to say the least, as a nearly 2% S&P 500 gain midday on Thursday was erased and turned into a 1.5% daily decline. We expected Thursday’s drawdown to give investors pause and weigh on sentiment into the weekend and into the Thanksgiving holiday, but Friday’s 1.3% rally provided some relief and gives us hope that the worst of the forced selling/deleveraging is now behind us. The last three weeks haven’t dissuaded us or altered our view as we still see reasons to remain constructive on U.S. stocks into year-end. Specifically, we expect strong earnings, cheaper valuations, improved liquidity, the end of tax loss harvesting later this month, and corporate share buybacks reaccelerating in the coming weeks should buoy indices into 2026. In the near-term, however, technical damage has been done that will likely take time to be repaired. Should the S&P 500 breach its 100-day moving average around 6,550 to the downside, trend following strategies could be forced to increase short positions, which could exacerbate any move to the downside as trading desks will be thinly staffed and liquidity/book depth even more limited due to the Thanksgiving holiday. Should a deeper drawdown materialize this week, active managers needing to play catch up with their benchmark would likely still view this as an opportunity to buy some of this year’s biggest winners at discounted prices, contributing to a year-end performance chase that pushes indices higher.
Mid-Caps Approach Oversold Territory, With Valuations, Sector Exposures Reasons For Optimism. U.S. equities were relative winners last week as global risk-assets, broadly speaking, sold off, and encouragingly, small and mid-cap stocks fell less than the NASDAQ 100 and the MSCI All-Country World ex-US on the week. Last week’s downside protection provided by mid-caps is a byproduct of oversold technical conditions combined with appealing valuations as the S&P 400 trades at 14.7x forward earnings. A relative strength reading below 30 suggests the pullback in mid-caps, specifically, is likely overdone as the last time its RSI was in the low 30’s was back in March and April. When it comes to mapping out how midcaps could regain their footing, we find it helpful to revisit sector exposures and considering 40% of the S&P 400 index is allocated to industrials and financials, reaccelerating economic growth might be required to boost stocks in those sectors. From our perspective, upside to economic growth would be more impactful for midcap stocks than interest rate cuts as total debt to enterprise value for the S&P 400 Midcap index is around 32%, but closer to 41% for the S&P 600 Small Cap index. The potential for an upside surprise to growth in the coming year is something we’re watching closely as stimulus from the OBBBA hits tax refunds early next year and last Friday, the US Services PMI reached 55, its second highest reading of the year.
European, Japanese Stocks Pull Back As The U.S. Dollar Pushes Higher. Developed markets abroad had a rough week, evidenced by the MSCI EAFE index’s 3.4% drop, with weakness noticeably broad-based. In the Eurozone, country indices tied to France, Germany, Italy, and Spain each fell over 3% on the week, while the MSCI U.K. index fared a bit better, falling 2%. While Europe’s pullback shouldn’t be ignored, what really has our attention is what’s going on in Japan. After Japan’s Nikkei 225 index posted a 36.4% year-to-date total return through October, the index has since pulled back by 8.6% in November. The fall in Japanese stocks has been due in large part to an undesirable combination of currency weakness which has coincided with rising Japanese Government Bond (JGB) yields. The Japanese yen has fallen to 157.60¥ to $1, challenging the year-to-date low of 158.35¥ to $1 seen in early January, while the yield on the 10-year JGB has consistently moved higher and hit 1.81% last Thursday, the highest yield seen on that bond since 2007. So, why does this matter? Some of the rise in Japanese stocks this year has been predicated upon the belief that the country would step up fiscal spending/stimulus in the coming quarters – which it announced it would do last week – thus boosting GDP growth and corporate profits. But should the yen continue to fall and approach 160¥ to $1, the Bank of Japan (BoJ) might be forced to step in and hike short-term interest rates, which could weigh on growth expectations and contribute to a further drop in Japanese stocks as expansionary fiscal policy would be met by more restrictive monetary policy.
Bonds: Treasuries Catch A Half-Hearted Bid As Market Participants De-Risk, De-Lever; Fed Funds Futures In-Flux As FOMC Speakers Send Conflicting Messages; Credit Spreads Continue To Move Wider, With Limited Liquidity One Potential Culprit.
Treasury Yields Fall As Perceived Safe Haven Assets Catch A Bid As Deleveraging, Portfolio Derisking Takes Hold. U.S. Treasuries caught a safe-haven bid in the back-half of the week as equity markets reversed course and moved lower after a parade of FOMC members threw more cold water on the prospect of a rate cut at the Committee’s December meeting. The Bloomberg Aggregate Bond index posted a 0.4% weekly gain, aided by the fall in yields in the belly of the Treasury curve on bonds maturing between 3- and 10-years. The 10-year yield ended the week lower by 9 basis points at 4.06%, close to the midpoint of the 3.95% to 4.20% trading range that has held since early September. The relative calm and absence of volatility that has been a hallmark of the rates market for almost three months now is likely on borrowed time. We expect Treasury yields in the belly and long-end of the yield curve to move higher relatively early in the new year as economic growth picks up and tax refunds lead to increased consumption, putting upward pressure on prices of goods, broadly speaking. We expect upward pressure on sovereign bond yields to be a global phenomenon in the coming year, a byproduct of stepped-up deficit/fiscal spending, increasing the importance of diversification to mitigate volatility and limit portfolio drawdown along the way.
Market Participants As Divided, Uncertain As FOMC Voters Appear To Be On The Path Forward For The Funds Rate. Midweek, market participants were of the view that the FOMC would stand pat when it meets in December and would punt until January, with the likelihood of a rate cut next month falling to just 29% as a drop in imports and more hawkish FOMC minutes from the prior meeting threw cold water on easing hopes. However, that dynamic shifted meaningfully on Friday as New York Fed President John Williams noted that he still sees room to lower the Fed funds rate in the near term, citing downside risks to the labor market and monetary policy that remains modestly restrictive as the rationale for doing so. Williams’ view aligns with recent research out of the San Francisco Federal Reserve that took the position that tariffs were deflationary due to their ability to dampen demand and increase unemployment. We hold the view that next month’s FOMC meeting is truly a tossup, and market participants also have little conviction as to what will happen, evidenced by Fed funds futures placing the probability of a rate cut at 65%, a low figure and representative of a lack of confidence in the lead-up to the meeting. This dynamic could contribute to elevated volatility in the rates market in the near term.
Cheaper Corporate Bond Valuations Don’t Tell The Full Story. Often when market observers see wider credit spreads, they envision the bonds are trading at a discount to their prior valuation, but that wasn’t the case last week for investment grade corporate bonds. Despite wider credit spreads, the yield-to-worst on the Bloomberg U.S. Corporate index fell over the course of the week and the index returned 0.4%. Credit spreads only widened because the index price didn’t rise to the same degree as benchmark Treasury rates, with the 10-year treasury yield falling from 4.15% to 4.06%. That drop in yields wasn’t mirrored in investment grade bonds as borrowers continue to issue new paper at a breakneck pace with November on track to break historical monthly issuance totals, just like we saw in the last two months. Buyers are staying active with oversubscriptions for new issues well above average, but last week new offerings provided extra concessions, implying better yields for those willing to buy the new bonds. High yield spreads, on the other hand, followed a more traditional path last week as both credit spreads and yields rose, leading the index to close the week unchanged. That move brings the option-adjusted spread (OAS) on the high yield index above 300-bps for only the third time since June, a valuation that more fairly reflects the current uncertain backdrop for risk assets. An OAS at that level now more than justifies a neutral stance in our view, and we’d be looking to increase our exposure to spread product should we see this push higher into the 350-400bps range in the coming months. However, it’s worth noting that is not our base case, as again, demand for yield has been insatiable with high yield valuations consistently below 350-bps dating back to early May.
IMPORTANT DISCLOSURES: THIS PUBLICATION HAS BEEN PREPARED BY THE STAFF OF HIGHLAND ASSOCIATES, INC. FOR DISTRIBUTION TO, AMONG OTHERS, HIGHLAND ASSOCIATES, INC. CLIENTS. HIGHLAND ASSOCIATES IS REGISTERED WITH THE UNITED STATES SECURITY AND EXCHANGE COMMISSION UNDER THE INVESTMENT ADVISORS ACT OF 1940. HIGHLAND ASSOCIATES IS A WHOLLY OWNED SUBSIDIARY OF REGIONS BANK, WHICH IN TURN IS A WHOLLY OWNED SUBSIDIARY OF REGIONS FINANCIAL CORPORATION. RESEARCH SERVICES ARE PROVIDED THROUGH MULTI-ASSET SOLUTIONS, A DEPARTMENT OF THE REGIONS ASSET MANAGEMENT BUSINESS GROUP WITHIN REGIONS BANK. THE INFORMATION AND MATERIAL CONTAINED HEREIN IS PROVIDED SOLELY FOR GENERAL INFORMATION PURPOSES ONLY. TO THE EXTENT THESE MATERIALS REFERENCE REGIONS BANK DATA, SUCH MATERIALS ARE NOT INTENDED TO BE REFLECTIVE OR INDICATIVE OF, AND SHOULD NOT BE RELIED UPON AS, THE RESULTS OF OPERATIONS, FINANCIAL CONDITIONS OR PERFORMANCE OF REGIONS BANK. UNLESS OTHERWISE SPECIFICALLY STATED, ANY VIEWS, OPINIONS, ANALYSES, ESTIMATES AND STRATEGIES, AS THE CASE MAY BE (“VIEWS”), EXPRESSED IN THIS CONTENT ARE THOSE OF THE RESPECTIVE AUTHORS AND SPEAKERS NAMED IN THOSE PIECES AND MAY DIFFER FROM THOSE OF REGIONS BANK AND/OR OTHER REGIONS BANK EMPLOYEES AND AFFILIATES. VIEWS AND ESTIMATES CONSTITUTE OUR JUDGMENT AS OF THE DATE OF THESE MATERIALS, ARE OFTEN BASED ON CURRENT MARKET CONDITIONS, AND ARE SUBJECT TO CHANGE WITHOUT NOTICE. ANY EXAMPLES USED ARE GENERIC, HYPOTHETICAL AND FOR ILLUSTRATION PURPOSES ONLY. ANY PRICES/QUOTES/STATISTICS INCLUDED HAVE BEEN OBTAINED FROM SOURCES BELIEVED TO BE RELIABLE, BUT HIGHLAND ASSOCIATES, INC. DOES NOT WARRANT THEIR COMPLETENESS OR ACCURACY. THIS INFORMATION IN NO WAY CONSTITUTES RESEARCH AND SHOULD NOT BE TREATED AS SUCH. THE VIEWS EXPRESSED HEREIN SHOULD NOT BE CONSTRUED AS INDIVIDUAL INVESTMENT ADVICE FOR ANY PARTICULAR PERSON OR ENTITY AND ARE NOT INTENDED AS RECOMMENDATIONS OF PARTICULAR SECURITIES, FINANCIAL INSTRUMENTS, STRATEGIES OR BANKING SERVICES FOR A PARTICULAR PERSON OR ENTITY. THE NAMES AND MARKS OF OTHER COMPANIES OR THEIR SERVICES OR PRODUCTS MAY BE THE TRADEMARKS OF THEIR OWNERS AND ARE USED ONLY TO IDENTIFY SUCH COMPANIES OR THEIR SERVICES OR PRODUCTS AND NOT TO INDICATE ENDORSEMENT, SPONSORSHIP, OR OWNERSHIP BY REGIONS OR HIGHLAND ASSOCIATES. EMPLOYEES OF HIGHLAND ASSOCIATES, INC., MAY HAVE POSITIONS IN SECURITIES OR THEIR DERIVATIVES THAT MAY BE MENTIONED IN THIS REPORT. ADDITIONALLY, HIGHLAND’S CLIENTS AND COMPANIES AFFILIATED WITH HIGHLAND ASSOCIATES MAY HOLD POSITIONS IN THE MENTIONED COMPANIES IN THEIR PORTFOLIOS OR STRATEGIES. THIS MATERIAL DOES NOT CONSTITUTE AN OFFER OR AN INVITATION BY OR ON BEHALF OF HIGHLAND ASSOCIATES TO ANY PERSON OR ENTITY TO BUY OR SELL ANY SECURITY OR FINANCIAL INSTRUMENT OR ENGAGE IN ANY BANKING SERVICE. NOTHING IN THESE MATERIALS CONSTITUTES INVESTMENT, LEGAL, ACCOUNTING OR TAX ADVICE. NON-DEPOSIT PRODUCTS INCLUDING INVESTMENTS, SECURITIES, MUTUAL FUNDS, INSURANCE PRODUCTS, CRYPTO ASSETS AND ANNUITIES: ARE NOT FDIC-INSURED I ARE NOT A DEPOSIT I MAY GO DOWN IN VALUE I ARE NOT BANK GUARANTEED I ARE NOT INSURED BY ANY FEDERAL GOVERNMENT AGENCY I ARE NOT A CONDITION OF ANY BANKING ACTIVITY.
NEITHER REGIONS BANK NOR REGIONS ASSET MANAGEMENT (COLLECTIVELY, “REGIONS”) ARE REGISTERED MUNICIPAL ADVISORS NOR PROVIDE ADVICE TO MUNICIPAL ENTITIES OR OBLIGATED PERSONS WITH RESPECT TO MUNICIPAL FINANCIAL PRODUCTS OR THE ISSUANCE OF MUNICIPAL SECURITIES (INCLUDING REGARDING THE STRUCTURE, TIMING, TERMS AND SIMILAR MATTERS CONCERNING MUNICIPAL FINANCIAL PRODUCTS OR MUNICIPAL SECURITIES ISSUANCES) OR ENGAGE IN THE SOLICITATION OF MUNICIPAL ENTITIES OR OBLIGATED PERSONS FOR SUCH SERVICES. WITH RESPECT TO THIS PRESENTATION AND ANY OTHER INFORMATION, MATERIALS OR COMMUNICATIONS PROVIDED BY REGIONS, (A) REGIONS IS NOT RECOMMENDING AN ACTION TO ANY MUNICIPAL ENTITY OR OBLIGATED PERSON, (B) REGIONS IS NOT ACTING AS AN ADVISOR TO ANY MUNICIPAL ENTITY OR OBLIGATED PERSON AND DOES NOT OWE A FIDUCIARY DUTY PURSUANT TO SECTION 15B OF THE SECURITIES EXCHANGE ACT OF 1934 TO ANY MUNICIPAL ENTITY OR OBLIGATED PERSON WITH RESPECT TO SUCH PRESENTATION, INFORMATION, MATERIALS OR COMMUNICATIONS, (C) REGIONS IS ACTING FOR ITS OWN INTERESTS, AND (D) YOU SHOULD DISCUSS THIS PRESENTATION AND ANY SUCH OTHER INFORMATION, MATERIALS OR COMMUNICATIONS WITH ANY AND ALL INTERNAL AND EXTERNAL ADVISORS AND EXPERTS THAT YOU DEEM APPROPRIATE BEFORE ACTING ON THIS PRESENTATION OR ANY SUCH OTHER INFORMATION, MATERIALS OR COMMUNICATIONS.
SOURCE: BLOOMBERG INDEX SERVICES LIMITED. BLOOMBERG® IS A TRADEMARK AND SERVICE MARK OF BLOOMBERG FINANCE L.P. AND ITS AFFILIATES (COLLECTIVELY “BLOOMBERG”). BARCLAYS® IS A TRADEMARK AND SERVICE MARK OF BARCLAYS BANK PLC (COLLECTIVELY WITH ITS AFFILIATES, “BARCLAYS”), USED UNDER LICENSE. BLOOMBERG OR BLOOMBERG’S LICENSORS, INCLUDING BARCLAYS, OWN ALL PROPRIETARY RIGHTS IN THE BLOOMBERG BARCLAYS INDICES. NEITHER BLOOMBERG NOR BARCLAYS APPROVES OR ENDORSES THIS MATERIAL OR GUARANTEES THE ACCURACY OR COMPLETENESS OF ANY INFORMATION HEREIN, OR MAKES ANY WARRANTY, EXPRESS OR IMPLIED, AS TO THE RESULTS TO BE OBTAINED THEREFROM AND, TO THE MAXIMUM EXTENT ALLOWED BY LAW, NEITHER SHALL HAVE ANY LIABILITY OR RESPONSIBILITY FOR INJURY OR DAMAGES ARISING IN CONNECTION THEREWITH.