Stocks: Back to The Top End OF The S&P 500’s Trading Range; Small Caps Large Caps for 7th Straight Week.
Download Weekly Market Commentary | May 8 2023
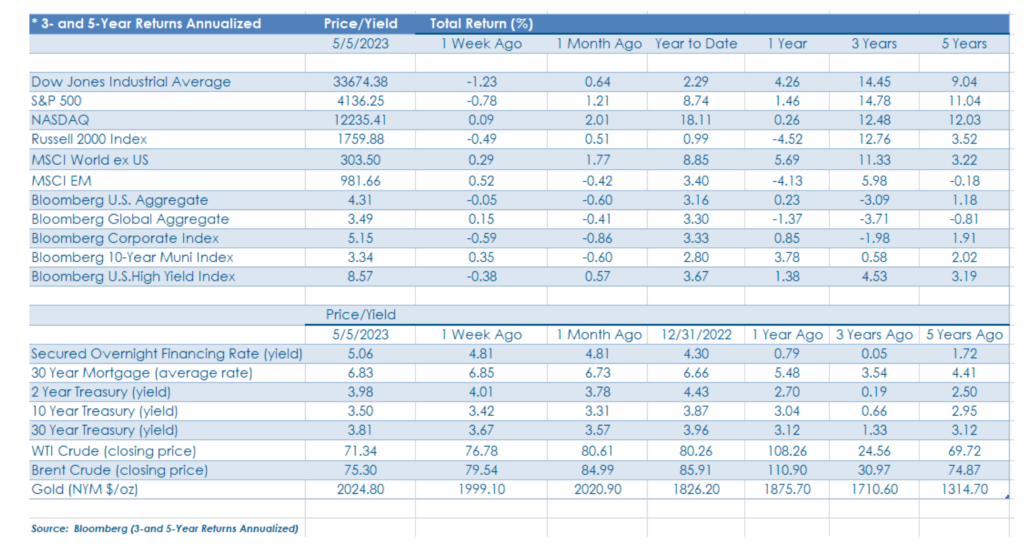
The S&P 500 fell 0.7% on the week after trading in a relatively wide range between 4,050 on the low end and 4,185 on the high side. While the broader index lost ground on the week, what stood out to us was the floor of support provided by the 4,050-level as the S&P 500 re-tested its April low. Bears tried to push the S&P 500 below 4,050 on multiple occasions last Thursday, but were turned away each time, and with the broader index rallying on Friday to close out the week, it appears as though that level may be a battleground of sorts as the bulls appear willing to step in to defend it, for now anyway. 4,050 is now the level worth watching on the downside for the S&P 500, and a break below would be notable, but very little appears to have changed after last week. Until the bulls can muster up the fortitude and capital to generate a push higher, the 3,800 to 4,200 trading range remains intact. With earnings season winding down, companies will likely be stepping in over coming weeks to repurchase stock, which could provide a tailwind for equities, but with debt ceiling discussions likely to prove contentious, uncertainty on this front is likely to act as a wet blanket and limit gains.
- It was a relatively quiet week abroad with holidays in Europe leading to a shortened week of trading. The MSCI EAFE developed markets index ending higher by 0.3% while the MSCI Emerging Markets (EM) index closed with a 0.5% gain. Japan rallied 1.1% while many euro area country indices, along with the U.K. ended the week +/- 0.5%. South Korea and Taiwan outperformed the MSCI EM index on the week, while China and India were market performers.
- West Texas Intermediate (WTI) crude oil closed out a volatile week lower by 7% at $71.34 per barrel, reversing the bulk of its post-OPEC supply cut rally as demand concerns weighed. The bounce in crude prices generated by the April 2 OPEC announcement proved short lived, as is often the case with such moves, and its increasingly likely that the $83 per barrel level may mark the year-to-date high for WTI. That price level will likely provide a formidable ceiling of resistance for prices over the coming quarters. On the downside, the year-to-date closing low of $66.74 per barrel reached on St. Patrick’s Day is a potential floor of support for the commodity that is well worth watching as a break below could bring the $50’s into play, which wouldn’t paint a very rosy picture for U.S. or global economic growth. With WTI at the lower end of the $66 to $83 trading range and with the seasonally strong summer driving season lying ahead, we have a bias toward crude prices moving higher over the near-term, which could provide a most welcome tailwind for the S&P 500 energy sector, which is down 8.2% year-to-date and is the worst performing S&P 500 sector up to this point.
- Gold rallied to an all-time high at $2,065 per ounce last Thursday as safe haven or store of value inflows forced prices higher, before paring gains Friday on the heels of the strong May payrolls report. Gold catching a bid alongside long-dated U.S. Treasuries is likely a function of market participants putting the debt ceiling playbook into action as both performed quite well during 2011 leading up to S&P’s downgrade of U.S. government debt. With the Federal Open Market Committee (FOMC) hinting at a pause in its rate hiking cycle last week while inflationary pressures remain elevated, gold prices could continue to trend higher over the coming months as the U.S. economy slows and the debt ceiling debate remains front and center. Gold doesn’t provide an income like bonds, while storage and unquantifiable opportunity costs tied to holding the precious metal should be considered. Thus, investor’s exposure must be properly sized, likely in the 1% to 5% of assets range for most.
Bonds: Mixed Messages on The Economic Front Lead to A Volatile Week in The Rates Market; Stagflation Narrative Could Gain Traction Post-GDP, PCE.
Both the Federal Open Market Committee (FOMC) and European Central Bank (ECB) took what the market was giving them last week, with each hiking their respective rates by 25-basis points as was widely anticipated. While noteworthy, central bank actions took a backseat to a Treasury auction and the May nonfarm payrolls report. Treasury auctioned off $50B of 4-week T-bills Thursday at a high yield of 5.84%, or 265 bps higher than the yield on one-month T-bills auctioned just two weeks prior. The sharp move higher in the 1-month yield is attributable to debt ceiling uncertainty after Treasury Secretary Yellen stated last week that the U.S. Treasury could run out of cash as soon as June 1. This admission led investors to require a substantially higher yield on 4-week paper to adequately compensate them for taking on the risk that principal and interest payments could potentially be delayed and received after the maturity date for these newly issued bills. President Biden is set to meet with Congressional leaders Tuesday to discuss debt ceiling demands, and the tone coming out of that meeting will likely loom large for fixed income investors and set the course for rates in May.
- The Federal Open Market Committee (FOMC) hiked the Fed funds rate by another 25-basis points at the conclusion of its May meeting last Wednesday, taking the upper bound of the Fed’s target range to 5.25%. In his post-meeting press conference, Chair Jerome Powell noted that the Committee’s decision was unanimous and stated that the FOMC is committed to returning inflation to its stated 2% target. Chair Powell reiterated that the path forward for monetary policy would remain data dependent and that his own forecast calls for modest economic growth, not a recession. Chair Powell hinted at a pause when the Committee meets in June but was noncommittal and avoided backing the Committee into a corner when it meets next month.
- The European Central Bank (ECB) met Thursday and hiked its benchmark deposit rate by 25-basis points to 3.25%, a downshift from a 50-basis point increase at each of the ECB’s prior three meetings, but the decision was not unanimous as some voters lobbied for a more aggressive half-point hike. The ECB also announced it was preparing to end the reinvestment of proceeds of maturing bonds beginning in July, sooner than was previously anticipated. Eurozone inflation remains far too high for the central bank’s comfort, with a headline Consumer Price Index (CPI) reading of 7% year over year in April, above the 6.9% reading in March, while core CPI of 5.6% year over year fell only 0.1% from the March reading. The ECB acknowledged that it has more to do to combat inflation and given a sizable initial move lower in the 10-year German bund yield on the heels of the ECB’s announcement, the market appears to believe that the central bank will be successful, but at the expense of economic growth.
- Manufacturing orders out of Germany for March released Friday showed a 10.7% month over month drop and 11.0% year over year decline. Some of the drop is likely attributable to the uneven nature of China’s economy reopening, but lackluster demand out of the U.S. likely played a sizable role as well. The release of the April data in early June will be worth monitoring given Germany’s status as the manufacturing ‘bell cow’ of the euro area, and another sizable drop month over month would potentially lead to questions surrounding the durability of the improvement in Leading Economic Indicators (LEIs) witnessed over recent months.
- Credit spreads widened modestly week over week, driving a 0.3% weekly decline in the Bloomberg U.S. High Yield index and a larger 0.5% drop for investment-grade corporates that make up the Bloomberg Corporate index. Notably, some recent new issues on the investment-grade corporate side of the ledger have traded poorly over recent weeks, a dynamic worth monitoring as new issuance ramps up over coming weeks as Apple and others float new offerings.
- The May nonfarm payrolls report showed 253k jobs were created during the month, above the 179k estimate, and the unemployment rate fell to 3.4% from 3.6% in April. Average hourly earnings rose 0.5% month over month and 4.4% year over year versus the consensus estimate of 0.3% and 4.2%, which points toward continued tightness in the labor market. While payrolls for February and March were revised lower, the May release, on balance, displayed strength in the labor market and may provide the FOMC to hike rates again in June, although the April CPI release this Wednesday will also factor into the decision and is well worth monitoring.
What We’re Watching:
- U.S. Consumer Price Index (CPI) for April is released Wednesday and the headline reading is expected to rise 0.4% month over month, well above the 0.1% month over month reading from March. Core CPI, which excludes food and energy, is also expected to rise 0.3% month over month, in-line with the March reading. Year over year, headline CPI is expected to rise 5.0% in April, while core CPI is expected to show a 5.4% jump.
- U.S. Producer Price Index (PPI) for April is released Thursday and is expected to rise 0.3% month over month after a 0.5% drop in March. Year over year, PPI is expected to rise 2.4%, below the 2.7% reading from March.
- The University of Michigan Consumer Sentiment index is released Friday, with a May reading of 63.0 expected, down modestly from a 63.5 reading in April.
IMPORTANT DISCLOSURES: THIS PUBLICATION HAS BEEN PREPARED BY THE STAFF OF HIGHLAND ASSOCIATES, INC. FOR DISTRIBUTION TO, AMONG OTHERS, HIGHLAND ASSOCIATES, INC. CLIENTS. HIGHLAND ASSOCIATES IS REGISTERED WITH THE UNITED STATES SECURITY AND EXCHANGE COMMISSION UNDER THE INVESTMENT ADVISORS ACT OF 1940. HIGHLAND ASSOCIATES IS A WHOLLY OWNED SUBSIDIARY OF REGIONS BANK, WHICH IN TURN IS A WHOLLY OWNED SUBSIDIARY OF REGIONS FINANCIAL CORPORATION. RESEARCH SERVICES ARE PROVIDED THROUGH MULTI-ASSET SOLUTIONS, A DEPARTMENT OF THE REGIONS ASSET MANAGEMENT BUSINESS GROUP WITHIN REGIONS BANK. THE INFORMATION AND MATERIAL CONTAINED HEREIN IS PROVIDED SOLELY FOR GENERAL INFORMATION PURPOSES ONLY. TO THE EXTENT THESE MATERIALS REFERENCE REGIONS BANK DATA, SUCH MATERIALS ARE NOT INTENDED TO BE REFLECTIVE OR INDICATIVE OF, AND SHOULD NOT BE RELIED UPON AS, THE RESULTS OF OPERATIONS, FINANCIAL CONDITIONS OR PERFORMANCE OF REGIONS BANK. UNLESS OTHERWISE SPECIFICALLY STATED, ANY VIEWS, OPINIONS, ANALYSES, ESTIMATES AND STRATEGIES, AS THE CASE MAY BE (“VIEWS”), EXPRESSED IN THIS CONTENT ARE THOSE OF THE RESPECTIVE AUTHORS AND SPEAKERS NAMED IN THOSE PIECES AND MAY DIFFER FROM THOSE OF REGIONS BANK AND/OR OTHER REGIONS BANK EMPLOYEES AND AFFILIATES. VIEWS AND ESTIMATES CONSTITUTE OUR JUDGMENT AS OF THE DATE OF THESE MATERIALS, ARE OFTEN BASED ON CURRENT MARKET CONDITIONS, AND ARE SUBJECT TO CHANGE WITHOUT NOTICE. ANY EXAMPLES USED ARE GENERIC, HYPOTHETICAL AND FOR ILLUSTRATION PURPOSES ONLY. ANY PRICES/QUOTES/STATISTICS INCLUDED HAVE BEEN OBTAINED FROM SOURCES BELIEVED TO BE RELIABLE, BUT HIGHLAND ASSOCIATES, INC. DOES NOT WARRANT THEIR COMPLETENESS OR ACCURACY. THIS INFORMATION IN NO WAY CONSTITUTES RESEARCH AND SHOULD NOT BE TREATED AS SUCH. THE VIEWS EXPRESSED HEREIN SHOULD NOT BE CONSTRUED AS INDIVIDUAL INVESTMENT ADVICE FOR ANY PARTICULAR PERSON OR ENTITY AND ARE NOT INTENDED AS RECOMMENDATIONS OF PARTICULAR SECURITIES, FINANCIAL INSTRUMENTS, STRATEGIES OR BANKING SERVICES FOR A PARTICULAR PERSON OR ENTITY. THE NAMES AND MARKS OF OTHER COMPANIES OR THEIR SERVICES OR PRODUCTS MAY BE THE TRADEMARKS OF THEIR OWNERS AND ARE USED ONLY TO IDENTIFY SUCH COMPANIES OR THEIR SERVICES OR PRODUCTS AND NOT TO INDICATE ENDORSEMENT, SPONSORSHIP, OR OWNERSHIP BY REGIONS OR HIGHLAND ASSOCIATES. EMPLOYEES OF HIGHLAND ASSOCIATES, INC., MAY HAVE POSITIONS IN SECURITIES OR THEIR DERIVATIVES THAT MAY BE MENTIONED IN THIS REPORT. ADDITIONALLY, HIGHLAND’S CLIENTS AND COMPANIES AFFILIATED WITH HIGHLAND ASSOCIATES MAY HOLD POSITIONS IN THE MENTIONED COMPANIES IN THEIR PORTFOLIOS OR STRATEGIES. THIS MATERIAL DOES NOT CONSTITUTE AN OFFER OR AN INVITATION BY OR ON BEHALF OF HIGHLAND ASSOCIATES TO ANY PERSON OR ENTITY TO BUY OR SELL ANY SECURITY OR FINANCIAL INSTRUMENT OR ENGAGE IN ANY BANKING SERVICE. NOTHING IN THESE MATERIALS CONSTITUTES INVESTMENT, LEGAL, ACCOUNTING OR TAX ADVICE. NON-DEPOSIT PRODUCTS INCLUDING INVESTMENTS, SECURITIES, MUTUAL FUNDS, INSURANCE PRODUCTS, CRYPTO ASSETS AND ANNUITIES: ARE NOT FDIC-INSURED I ARE NOT A DEPOSIT I MAY GO DOWN IN VALUE I ARE NOT BANK GUARANTEED I ARE NOT INSURED BY ANY FEDERAL GOVERNMENT AGENCY I ARE NOT A CONDITION OF ANY BANKING ACTIVITY.
NEITHER REGIONS BANK NOR REGIONS ASSET MANAGEMENT (COLLECTIVELY, “REGIONS”) ARE REGISTERED MUNICIPAL ADVISORS NOR PROVIDE ADVICE TO MUNICIPAL ENTITIES OR OBLIGATED PERSONS WITH RESPECT TO MUNICIPAL FINANCIAL PRODUCTS OR THE ISSUANCE OF MUNICIPAL SECURITIES (INCLUDING REGARDING THE STRUCTURE, TIMING, TERMS AND SIMILAR MATTERS CONCERNING MUNICIPAL FINANCIAL PRODUCTS OR MUNICIPAL SECURITIES ISSUANCES) OR ENGAGE IN THE SOLICITATION OF MUNICIPAL ENTITIES OR OBLIGATED PERSONS FOR SUCH SERVICES. WITH RESPECT TO THIS PRESENTATION AND ANY OTHER INFORMATION, MATERIALS OR COMMUNICATIONS PROVIDED BY REGIONS, (A) REGIONS IS NOT RECOMMENDING AN ACTION TO ANY MUNICIPAL ENTITY OR OBLIGATED PERSON, (B) REGIONS IS NOT ACTING AS AN ADVISOR TO ANY MUNICIPAL ENTITY OR OBLIGATED PERSON AND DOES NOT OWE A FIDUCIARY DUTY PURSUANT TO SECTION 15B OF THE SECURITIES EXCHANGE ACT OF 1934 TO ANY MUNICIPAL ENTITY OR OBLIGATED PERSON WITH RESPECT TO SUCH PRESENTATION, INFORMATION, MATERIALS OR COMMUNICATIONS, (C) REGIONS IS ACTING FOR ITS OWN INTERESTS, AND (D) YOU SHOULD DISCUSS THIS PRESENTATION AND ANY SUCH OTHER INFORMATION, MATERIALS OR COMMUNICATIONS WITH ANY AND ALL INTERNAL AND EXTERNAL ADVISORS AND EXPERTS THAT YOU DEEM APPROPRIATE BEFORE ACTING ON THIS PRESENTATION OR ANY SUCH OTHER INFORMATION, MATERIALS OR COMMUNICATIONS.
SOURCE: BLOOMBERG INDEX SERVICES LIMITED. BLOOMBERG® IS A TRADEMARK AND SERVICE MARK OF BLOOMBERG FINANCE L.P. AND ITS AFFILIATES (COLLECTIVELY “BLOOMBERG”). BARCLAYS® IS A TRADEMARK AND SERVICE MARK OF BARCLAYS BANK PLC (COLLECTIVELY WITH ITS AFFILIATES, “BARCLAYS”), USED UNDER LICENSE. BLOOMBERG OR BLOOMBERG’S LICENSORS, INCLUDING BARCLAYS, OWN ALL PROPRIETARY RIGHTS IN THE BLOOMBERG BARCLAYS INDICES. NEITHER BLOOMBERG NOR BARCLAYS APPROVES OR ENDORSES THIS MATERIAL OR GUARANTEES THE ACCURACY OR COMPLETENESS OF ANY INFORMATION HEREIN, OR MAKES ANY WARRANTY, EXPRESS OR IMPLIED, AS TO THE RESULTS TO BE OBTAINED THEREFROM AND, TO THE MAXIMUM EXTENT ALLOWED BY LAW, NEITHER SHALL HAVE ANY LIABILITY OR RESPONSIBILITY FOR INJURY OR DAMAGES ARISING IN CONNECTION THEREWITH.