Stocks: U.S. Indices Build On Gains From The Prior Week As ‘Magnificent 7’ Earnings Provide A Tailwind, Lift Investor Spirits; The U.S. Dollar Finds Support, Buat Is Close To Running Into Resistance; International Markets Keep Pace With U.S. Stocks Even As ‘Growthier’ Areas Catch A Bid.
Download Weekly Market Commentary | May 5 2025
What We’re Watching:
- The Institute for Supply Management’s (ISM) Services Index for April is released Monday with a modest decline to 50.2 from 50.8 in March expected. A reading above 50 indicates expansion, while a reading below 50 indicates contraction in the services sector of the U.S. economy.
- The Federal Open Market Committee (FOMC) meets Wednesday and is expected to leave the Fed funds rate unchanged with a midpoint between the upper and lower bound of 4.375%.
- Initial jobless claims for the week ended May 3 and continuing claims for the week ended April 26 are released Thursday. These data points are worth watching to see if layoffs are accelerating after both measures came in above the consensus estimate the prior week. For reference, initial jobless claims were 241k for the week ended April 26, and continuing claims were 1,916k for the week ended April 19.
Key Observations
- More rumors of progress being made on the tariff/trade front, along with better than feared earnings out of four of the ‘Magnificent 7’ names pulled U.S. equity indices higher over the balance of the week. Early in the week, stocks rallied on news that the U.S. was preparing to announce a trade deal, with India or South Korea viewed as the most likely counterparty, and the rally rolled on mid-week as Meta Platforms and Microsoft posted quarterly earnings that pointed toward continued tailwinds for the artificial intelligence (AI) theme.
- Some notable divergences were evident last week that are worthy of attention. Specifically, while U.S. equity indices rallied and Treasury yields rose on the heels of Friday’s better than expected payrolls data, the U.S. Dollar index (DXY) weakened, perhaps providing some evidence of skepticism on the part of investors that U.S. economic resiliency can/will continue in the coming months.
- The release of the March Job Openings and Labor Turnover Survey (JOLTS), along with initial and continuing claims for unemployment insurance, pointed toward continued cooling of the U.S. labor market. But concerns that the jobs market was on the brink of collapse were eased by the April nonfarm payrolls report on Friday which surprised to the upside and pointed toward continued resiliency of the labor market and the broader U.S. economy. April payrolls growth surprising to the upside led to a sharp move higher for U.S. Treasury yields as cuts to the Fed funds rate were pushed out from June to July.
What Happened Last Week:
Stocks: U.S. Indices Build On Gains From The Prior Week As ‘Magnificent 7’ Earnings Provide A Tailwind, Lift Investor Spirits; The U.S. Dollar Finds Support, But Is Close To Running Into Resistance; International Markets Keep Pace With U.S. Stocks Even As ‘Growthier’ Areas Catch A Bid.
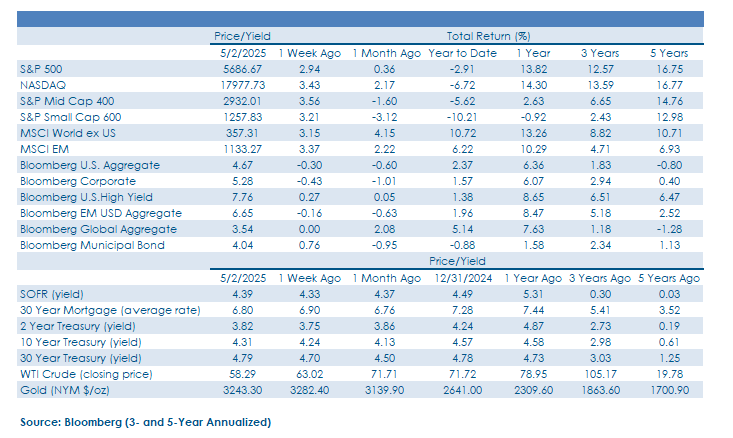
Tailwinds From Trade Rumors, Mega-Cap Tech Earnings Evoke Confidence. Top names in the technology sector pushed higher last week after select ‘Magnificent 7’ earnings came through with mixed results as Microsoft, Meta Platforms (Facebook), Apple and Amazon outpaced estimates though shares in the latter two traded flat to negative as guidance reflected trade headwinds. Microsoft and Meta were pack leaders, notching high single digit gains on the week that put the tech-heavy NASDAQ index ahead of the S&P 500 with the pair returning 2.9% and 3.4% respectively. Broader domestic equities also benefited from rumors that the U.S. was potentially closing in on finalizing trade deals with one or more countries in the Asia-Pacific region, chatter that drowned out tariff induced decisions from General Motors and Harley-Davidson to cut or pull forward guidance altogether. The positive tone in markets led to the second consecutive weekly gain for S&P 500 that brought the index price to 5,628, above its 50-day moving average of 5,582 for the first time since mid-February, but the 200-day of 5,746 is likely to pose staunch resistance in the coming weeks. Another encouraging sign last week was modest appreciation out of the U.S. dollar for the 2nd consecutive week, but we’re looking for the index to break above and hold the 100.50 level to signal the domestic outlook is improving rather than degrading near-term.
SMid Shaping Up For A Snapback Reversal At Some Point. Small cap equities narrowly outperformed domestic large caps last week, but it was the S&P 400 Midcap index that led the charge. Mid-caps, specifically, may continue to garner investor interest as the index boasted a 5.4% free cash flow yield at the end of April, the cheapest valuation by that metric since late 2010. Valuation on its own makes mid-caps interesting, but as most value-oriented investors can attest, waiting for the market to adopt your viewpoint can be a lengthy and grueling process. Part of the valuation discount is a product of the market’s prejudice toward the sub-asset class, with the S&P Midcap 400 index still down 13.5% off its November high. That valuation discount, alongside solid fundamentals rivaling large caps at present could make this an appealing place to look for long ideas in the coming months, assuming trade tensions deescalate. Earnings season is off to a slow start for small and midcap companies with only half the names in the SMid index having reported thus far, but sales growth has impressed while earnings growth is roughly flat/negative through the end of last week.
U.S. Dollar Finds Support, Approaches Key Resistance. The U.S. Dollar Index, or DXY, has bounced 2% after bottoming on April 21 as the greenback has rallied versus the euro and Japanese yen. The DXY ran up to just below 100.50 last Thursday, a potential resistance level worth watching as this area provided support last August/September and could now turn into resistance and limit the dollar’s ascent. Curiously, despite the upside surprise to the April nonfarm payrolls report on Friday, DXY fell on the day, the opposite of what we would have anticipated on the heels of such a release. This reversal on better data has our attention and should the dollar’s promising advance stall and the currency reverse course, U.S. stocks could see profit taking and move lower in the coming week(s), while international stocks would likely benefit on a relative basis from such a move.
Markets Abroad Keep Pace With U.S. Large-Caps Even As ‘Growthier’ Areas Outperform. Foreign markets rose alongside U.S. indices last week and modestly outperformed U.S. large-cap indices despite the S&P 500 carrying a larger allocation to information technology stocks, which fared well as investors dove back into ‘growth.’ Exposure to the artificial intelligence (AI) theme was in demand again last week as earnings releases out of Meta Platforms (Facebook) and Microsoft gave investors reasons for optimism and cause to revisit positioning in beneficiaries of this theme. This fact that the MSCI EAFE developed markets index and the MSCI Emerging Markets index outperformed the S&P 500 on the week is impressive given that the S&P 500 has an outsized exposure to the information technology sector relative to the EAFE and EM indices. Except for Spain, most Eurozone country indices turned out gains of between 2% and 3% on the week, while the FTSE 100 in the U.K ended the week higher by 1.8%. The MSCI Japan closed higher by 2% in U.S. dollar terms as the Japanese yen continued to slide versus the greenback as the Bank of Japan (BoJ) talked down the prospect of rate hikes. Investors viewed this as a powerful signal that the BoJ would like for the yen to weaken further, likely increasing demand for Japanese exports as it does so. Within the MSCI Emerging Markets index, Taiwan was a standout performer, rising 9.9% as Taiwan Semiconductor, which accounts for over 21% of the MSCI Taiwan index, rallied 8.5% on the week in sympathy with U.S. semiconductor stocks. The MSCI India index rose 2% as rumors of a U.S./India trade deal being struck and announced in the coming week(s) boosted interest in the country’s equity market, but escalating tensions between India and Pakistan tamped down sentiment.
Bonds: Treasury Yields Close Modestly Higher After A Busy Week On The Economic Data Front; Consumer Confidence Continues To Wane, But Betting Against The Willingness Of The U.S. Consumer To Spend Remains A Fool’s Errand; Unpacking Mixed Messages After A Big Week For Labor Market Data.
Preliminary Report On 1st Quarter GDP More Than Meets The Eye. Perhaps the most closely watched data release last week was the preliminary read on 1st quarter GDP. The consensus estimate called for GDP to contract 0.2% quarter over quarter on an annualized basis but by that metric alone the U.S. economy slowed more than expected, shrinking by 0.3%. The negative preliminary GDP reading was driven in large part by a sizable net import drag as companies pulled forward demand in advance of potential tariffs being levied in April. The headline reading was less than encouraging, but beneath the surface private domestic demand (combined household and business spending) was solid, and the personal consumption component of the release was better than anticipated, rising 1.8% quarter over quarter, above the 1.2% estimate. For those with stagflation as their base-case for the U.S. economy, the release did little to alter that view as the Core PCE Price Index rose 3.5% quarter over quarter, above the 3.1% estimate and well north of the 2.3% reading from the 4th quarter. Interestingly, Treasury yields ended the day little changed as investors appeared more concerned about slowing economic growth and were willing to either ignore or dismiss the ‘hotter’ than expected price increases.
Energy Sector Seeing Wider Spreads As Recession Calls Grow Louder. Credit markets weathered closed out a volatile week relatively unchanged at the index level, with the Bloomberg U.S. High Yield Corporate index inching forward to a 0.3% total return. That landing point doesn’t capture the midweek spread widening that occurred in the energy sector with valuations going from 391-basis points above Treasuries at the onset to as high as 447- bps on Wednesday as the first read on Q1 GDP led to calls of a U.S. recession being the base case. The energy sector was hampered by the steep decline in West Texas Intermediate (WTI) crude last week which closed the week at $58 a barrel, notching the lowest closing price since early 2021. Energy related companies make up roughly 11% of the broader high yield index, so its noteworthy that risk-sentiment in the remaining sectors were able to pick up the slack and offset losses in the segment. Valuations on the broader index were only marginally higher by a handful of basis points but the lowest quality CCC-rated paper saw more meaningful movement with the spread widening by 11-bps, suggesting appetite is still tilted toward names that would appear in the fallen angel category or rising star category of BB-rated bonds.
Consumers Concerned About The Future But Continue To Spend Anyway. The Conference Board’s Consumer Confidence survey for April released last Tuesday fell more than expected to 86.0, below the 88.0 expected and the 92.9 reading in March. The Present Situation portion of the survey held up well, coming in at 133.5 versus a 134.5 reading the prior month, but the Expectations component of the survey fell sharply to just 54.4 from 65.2 the prior month. The drop off in the Expectations reading aligns with the jump in inflation expectations seen in ‘soft’ surveys such as the University of Michigan’s Consumer Sentiment index, and with job openings falling more than expected in March (more on that below), consumer confidence and sentiment readings are likely to remain under pressure in the near-term. In this vein, Personal Income and Spending data from March was released Wednesday, and while stale, showed a 0.7% increase in spending during the month, above the 0.5% rise in income, again providing evidence that there is still a willingness to spend, despite the fact that the capacity or ability to spend (income) may not be keeping up.
Mixed Messages Surrounding The Health Of The U.S. Labor Market In A Big Week For Data. The Job Openings and Labor Turnover Survey (JOLTS) for March, which is admittedly stale at this point, was released Tuesday and showed that there was just shy of 7.2 million jobs open at month-end, below the 7.5 million estimate. However, more workers quit than expected and fewer than expected were laid off, providing evidence that workers remained confident they could find other employment if they quit and that companies were dragging their feet on firing workers as some resolution on the tariff front could potentially force them to rehire them in short order, and potentially at a higher wage. On the heels of the JOLTS report, we received initial jobless claims for the week ended April 26 and continuing claims for the week ended April 19 on Thursday. Both initial and continuing claims rose more than expected, with initial claims rising 19k week over week to 241k and continuing claims rising to 1.91 million from 1.84 million the prior week. The April Nonfarm Payrolls Report was released Friday and eased some of the concerns surrounding a slowing labor market that appeared evident in the JOLTS report and jobless claims data. Payrolls were expected to rise by 138k jobs during the month, but the labor market did better than that, generating 177k jobs. The unemployment rate was unchanged month over month at 4.2% as expected, and barring material deterioration in the labor market in May, we don’t see the FOMC as having the necessary cover to cut the Fed funds rate when it meets in mid-June.
IMPORTANT DISCLOSURES: THIS PUBLICATION HAS BEEN PREPARED BY THE STAFF OF HIGHLAND ASSOCIATES, INC. FOR DISTRIBUTION TO, AMONG OTHERS, HIGHLAND ASSOCIATES, INC. CLIENTS. HIGHLAND ASSOCIATES IS REGISTERED WITH THE UNITED STATES SECURITY AND EXCHANGE COMMISSION UNDER THE INVESTMENT ADVISORS ACT OF 1940. HIGHLAND ASSOCIATES IS A WHOLLY OWNED SUBSIDIARY OF REGIONS BANK, WHICH IN TURN IS A WHOLLY OWNED SUBSIDIARY OF REGIONS FINANCIAL CORPORATION. RESEARCH SERVICES ARE PROVIDED THROUGH MULTI-ASSET SOLUTIONS, A DEPARTMENT OF THE REGIONS ASSET MANAGEMENT BUSINESS GROUP WITHIN REGIONS BANK. THE INFORMATION AND MATERIAL CONTAINED HEREIN IS PROVIDED SOLELY FOR GENERAL INFORMATION PURPOSES ONLY. TO THE EXTENT THESE MATERIALS REFERENCE REGIONS BANK DATA, SUCH MATERIALS ARE NOT INTENDED TO BE REFLECTIVE OR INDICATIVE OF, AND SHOULD NOT BE RELIED UPON AS, THE RESULTS OF OPERATIONS, FINANCIAL CONDITIONS OR PERFORMANCE OF REGIONS BANK. UNLESS OTHERWISE SPECIFICALLY STATED, ANY VIEWS, OPINIONS, ANALYSES, ESTIMATES AND STRATEGIES, AS THE CASE MAY BE (“VIEWS”), EXPRESSED IN THIS CONTENT ARE THOSE OF THE RESPECTIVE AUTHORS AND SPEAKERS NAMED IN THOSE PIECES AND MAY DIFFER FROM THOSE OF REGIONS BANK AND/OR OTHER REGIONS BANK EMPLOYEES AND AFFILIATES. VIEWS AND ESTIMATES CONSTITUTE OUR JUDGMENT AS OF THE DATE OF THESE MATERIALS, ARE OFTEN BASED ON CURRENT MARKET CONDITIONS, AND ARE SUBJECT TO CHANGE WITHOUT NOTICE. ANY EXAMPLES USED ARE GENERIC, HYPOTHETICAL AND FOR ILLUSTRATION PURPOSES ONLY. ANY PRICES/QUOTES/STATISTICS INCLUDED HAVE BEEN OBTAINED FROM SOURCES BELIEVED TO BE RELIABLE, BUT HIGHLAND ASSOCIATES, INC. DOES NOT WARRANT THEIR COMPLETENESS OR ACCURACY. THIS INFORMATION IN NO WAY CONSTITUTES RESEARCH AND SHOULD NOT BE TREATED AS SUCH. THE VIEWS EXPRESSED HEREIN SHOULD NOT BE CONSTRUED AS INDIVIDUAL INVESTMENT ADVICE FOR ANY PARTICULAR PERSON OR ENTITY AND ARE NOT INTENDED AS RECOMMENDATIONS OF PARTICULAR SECURITIES, FINANCIAL INSTRUMENTS, STRATEGIES OR BANKING SERVICES FOR A PARTICULAR PERSON OR ENTITY. THE NAMES AND MARKS OF OTHER COMPANIES OR THEIR SERVICES OR PRODUCTS MAY BE THE TRADEMARKS OF THEIR OWNERS AND ARE USED ONLY TO IDENTIFY SUCH COMPANIES OR THEIR SERVICES OR PRODUCTS AND NOT TO INDICATE ENDORSEMENT, SPONSORSHIP, OR OWNERSHIP BY REGIONS OR HIGHLAND ASSOCIATES. EMPLOYEES OF HIGHLAND ASSOCIATES, INC., MAY HAVE POSITIONS IN SECURITIES OR THEIR DERIVATIVES THAT MAY BE MENTIONED IN THIS REPORT. ADDITIONALLY, HIGHLAND’S CLIENTS AND COMPANIES AFFILIATED WITH HIGHLAND ASSOCIATES MAY HOLD POSITIONS IN THE MENTIONED COMPANIES IN THEIR PORTFOLIOS OR STRATEGIES. THIS MATERIAL DOES NOT CONSTITUTE AN OFFER OR AN INVITATION BY OR ON BEHALF OF HIGHLAND ASSOCIATES TO ANY PERSON OR ENTITY TO BUY OR SELL ANY SECURITY OR FINANCIAL INSTRUMENT OR ENGAGE IN ANY BANKING SERVICE. NOTHING IN THESE MATERIALS CONSTITUTES INVESTMENT, LEGAL, ACCOUNTING OR TAX ADVICE. NON-DEPOSIT PRODUCTS INCLUDING INVESTMENTS, SECURITIES, MUTUAL FUNDS, INSURANCE PRODUCTS, CRYPTO ASSETS AND ANNUITIES: ARE NOT FDIC-INSURED I ARE NOT A DEPOSIT I MAY GO DOWN IN VALUE I ARE NOT BANK GUARANTEED I ARE NOT INSURED BY ANY FEDERAL GOVERNMENT AGENCY I ARE NOT A CONDITION OF ANY BANKING ACTIVITY.
NEITHER REGIONS BANK NOR REGIONS ASSET MANAGEMENT (COLLECTIVELY, “REGIONS”) ARE REGISTERED MUNICIPAL ADVISORS NOR PROVIDE ADVICE TO MUNICIPAL ENTITIES OR OBLIGATED PERSONS WITH RESPECT TO MUNICIPAL FINANCIAL PRODUCTS OR THE ISSUANCE OF MUNICIPAL SECURITIES (INCLUDING REGARDING THE STRUCTURE, TIMING, TERMS AND SIMILAR MATTERS CONCERNING MUNICIPAL FINANCIAL PRODUCTS OR MUNICIPAL SECURITIES ISSUANCES) OR ENGAGE IN THE SOLICITATION OF MUNICIPAL ENTITIES OR OBLIGATED PERSONS FOR SUCH SERVICES. WITH RESPECT TO THIS PRESENTATION AND ANY OTHER INFORMATION, MATERIALS OR COMMUNICATIONS PROVIDED BY REGIONS, (A) REGIONS IS NOT RECOMMENDING AN ACTION TO ANY MUNICIPAL ENTITY OR OBLIGATED PERSON, (B) REGIONS IS NOT ACTING AS AN ADVISOR TO ANY MUNICIPAL ENTITY OR OBLIGATED PERSON AND DOES NOT OWE A FIDUCIARY DUTY PURSUANT TO SECTION 15B OF THE SECURITIES EXCHANGE ACT OF 1934 TO ANY MUNICIPAL ENTITY OR OBLIGATED PERSON WITH RESPECT TO SUCH PRESENTATION, INFORMATION, MATERIALS OR COMMUNICATIONS, (C) REGIONS IS ACTING FOR ITS OWN INTERESTS, AND (D) YOU SHOULD DISCUSS THIS PRESENTATION AND ANY SUCH OTHER INFORMATION, MATERIALS OR COMMUNICATIONS WITH ANY AND ALL INTERNAL AND EXTERNAL ADVISORS AND EXPERTS THAT YOU DEEM APPROPRIATE BEFORE ACTING ON THIS PRESENTATION OR ANY SUCH OTHER INFORMATION, MATERIALS OR COMMUNICATIONS.
SOURCE: BLOOMBERG INDEX SERVICES LIMITED. BLOOMBERG® IS A TRADEMARK AND SERVICE MARK OF BLOOMBERG FINANCE L.P. AND ITS AFFILIATES (COLLECTIVELY “BLOOMBERG”). BARCLAYS® IS A TRADEMARK AND SERVICE MARK OF BARCLAYS BANK PLC (COLLECTIVELY WITH ITS AFFILIATES, “BARCLAYS”), USED UNDER LICENSE. BLOOMBERG OR BLOOMBERG’S LICENSORS, INCLUDING BARCLAYS, OWN ALL PROPRIETARY RIGHTS IN THE BLOOMBERG BARCLAYS INDICES. NEITHER BLOOMBERG NOR BARCLAYS APPROVES OR ENDORSES THIS MATERIAL OR GUARANTEES THE ACCURACY OR COMPLETENESS OF ANY INFORMATION HEREIN, OR MAKES ANY WARRANTY, EXPRESS OR IMPLIED, AS TO THE RESULTS TO BE OBTAINED THEREFROM AND, TO THE MAXIMUM EXTENT ALLOWED BY LAW, NEITHER SHALL HAVE ANY LIABILITY OR RESPONSIBILITY FOR INJURY OR DAMAGES ARISING IN CONNECTION THEREWITH.