Stocks: Still No Resolution To The S&P 500’s 3,800/4,200 Trading Range; Higher Treasury Yields, U.S. Dollar Strength Headwinds.
Download Weekly Market Commentary | May 22 2023
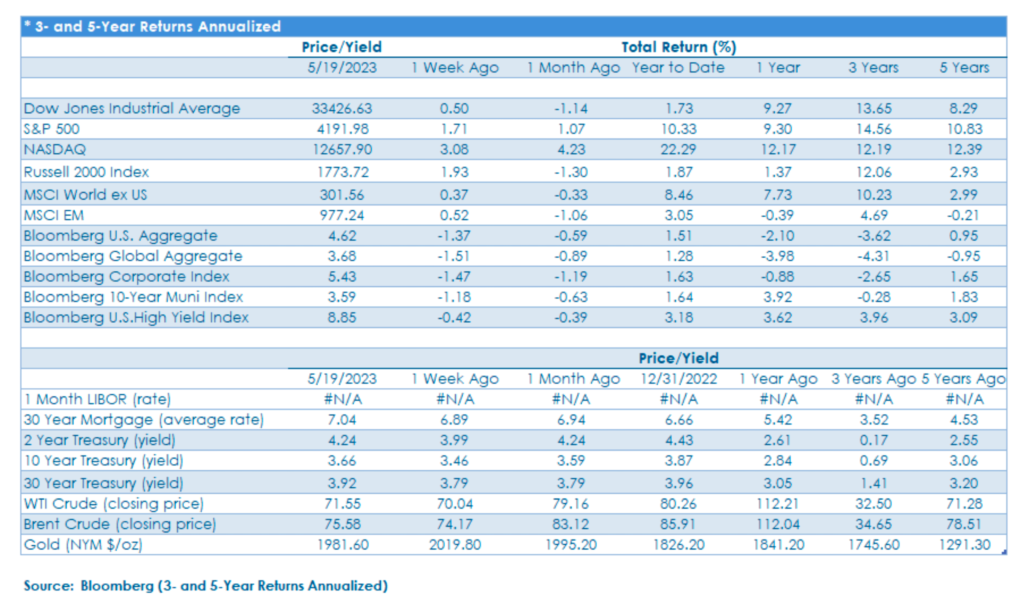
S&P 500 Still Stuck In A Trading Range – For Now: The S&P 500 rose 1.7% on the week and traded on either side of 4,200 in the back-half of last week before settling at 4,191. 4,200 has proven to be a ceiling of resistance and has capped gains on multiple occasions so far this year and remains the level worth watching. Prices of mega-cap technology names continued to levitate last week and Amazon, Apple, Microsoft, Netflix, and Nvidia again each outperformed the broader S&P 500. These 5 names, specifically, have experienced outsized returns year-to-date and have carried the S&P 500, but with valuations stretched and each on the doorstep of overbought territory, a period of consolidation or sideways price action would be viewed as constructive. Since the end of March, the S&P 500 has confounded bulls and bears alike with several false breakouts and breakdowns along the way that ultimately led the index to close week after week little changed. However, with a debt ceiling resolution likely by mid-June and with liquidity set to wane as a result, we expect this will be a catalyst for either a breakout to the upside or, more likely given continued narrow market leadership, a break lower back toward the lower end of the S&P 500’s trading range at 3,800.
Profit Taking In Euro Area Equities Possible As Economic Growth Wanes:
The MSCI EAFE developed markets index has gained 12.2% year-to-date, outperforming the S&P 500’s respectable 9.8% return. Going farther back, the EAFE has returned 32% since the end of September, with gains driven by broad-based strength in the euro area with country indices tied to France, Germany, Italy, and Spain all higher by 40%+ over that time frame, while the MSCI Japan has rallied 25%. While the rebound in developed markets abroad over the past eight months has been impressive, signs are emerging that economic momentum in the euro area and U.K. is fading, leading us to question whether earnings expectations for euro area and U.K. equities are now too lofty. Most of the recent economic data out of the euro area is stale, but Germany released its Economic Sentiment survey for May last week, and the -10.7 reading versus the -5.0 estimate and +4.1 April reading highlighted increasingly negative sentiment toward the country’s economic prospects welling up. This negative sentiment reading comes on the heels of weak manufacturing output, and retail sales data out of the country for March/April. Weakness out of Germany could be explained by the country’s reliance on China and the U.S. as primary export markets, both of which have shown signs of faltering economic growth, but with inflation running hot across the euro area, additional monetary policy tightening is likely to further slow economic growth and force unemployment higher further weighing on economic sentiment and, ultimately, equity prices.
China’s Slow Recovery Continues To Weigh On Emerging Markets:
The MSCI China index is lower by 2.6% year-to-date, but despite this substantial drag the MSCI Emerging Markets (EM) index has managed to turn out a modest 3% gain. Investors entered 2023 with optimism surrounding a reopening of China’s economy from COVID lockdowns, but so far that optimism has proven to be unfounded, and last week we received additional economic data that points toward substantial challenges still lying ahead. China’s industrial output and retail sales for April were released last week and both metrics fell short of expectations and pointed toward a choppy and uneven economic recovery. Industrial output rose 5.6% year over year in April, above the 3.9% reading from March, but well below the 10.9% jump expected. On the consumption front, retail sales rose 18.4% year over year in April, a strong reading on its surface, but still below the 21.0% growth expected. While we expect China’s central bank to ease monetary policy further in the coming months to stimulate consumption and spending, it may not be enough to improve consumer sentiment as unemployment in the 16 to 24 age cohort rose to a record high of 20.4% in April. With few signs of economic momentum to be found, it’s reasonable to believe that investors may take a wait and see approach toward Chinese equities over the coming quarters, which could weigh on emerging markets, broadly speaking.
Bonds: Investors Shift Focus To Market Impact(s) Once Debt Ceiling Is Raised; Resilient U.S. Economy Problematic For Policy Makers:
A Deeper Dive Into The Debt Ceiling Goings-On: While there was little in the way of new news on the debt ceiling front last week, both the White House and House Republicans expressed optimism that progress was being made, although talks appeared to stall on Friday, calling into question just when a deal would materialize. The market took President Biden’s decision to cut his trip to Japan for the G7 Summit short so he could return to D.C. for discussions Sunday as an encouraging sign that both sides are motivated to get a deal done. Both the White House and House Republicans stating that the U.S. failing to make good on its debt obligations is not an acceptable outcome allowed market participants to shift their focus last week away from “what happens if the debt ceiling isn’t raised” to attempting to handicap what a deal could look like and the impact it could have on risk appetite and liquidity.
Once the debt ceiling is raised, likely by mid-June, extraordinary measures implemented by the U.S. Treasury to bridge the gap and fund the government will end, and Treasury will begin to refill its coffers. The Treasury General Account (TGA) is expected to rise to $550-600B over the next few months which will require substantial issuance of U.S. Treasuries given it had been depleted to just $57B as of last week, and how that is accomplished will matter, particularly to fixed income investors. Treasury is expected to flood the market with short-term T-bills over coming months, which should keep rates on the short end of the Treasury curve elevated to spur demand from money market funds. Sustained 5%-plus T-bill yields would provide significant competition for stocks and corporate bonds and likely force yields on riskier corporate bonds modestly higher to compensate investors for taking on credit risk.
Treasury making payments out of its general account over the past couple of months injected more than enough liquidity into the system to offset the drain of liquidity from the Fed continuing to runoff its balance sheet, but that tailwind for stocks and riskier corporate bonds is set to reverse at month-end. With Treasury issuance ramping up, upward pressure on Treasury yields across the curve is likely to persist as higher yields will likely be required by investors to take down this increase in issuance. However, with fiscal support from the U.S. Treasury set to wane on the back of any debt ceiling deal, economic growth and inflation expectations may be ratcheted lower, acting as an offset to some degree.
Economic Data Points Toward A Resilient U.S. Economy, Presents A Challenge For The FOMC:
Initial and continuing jobless claims released last week were better/lower than expected, highlighting continued tightness in the labor market. The Philadelphia Fed Manufacturing Index for May showed contraction at -10.4 but was better than the -18.5 expected. While the yield on 1-month T-bills fell on the week as debt ceiling discussions appeared constructive, the yield on the 3-month bill rose to 5.38%, effectively giving the FOMC the cover to hike the Fed funds rate by another 25-basis points when it meets in June if upcoming inflation data warrants. Fed funds futures shifted to price in a 33% chance of a 25-basis point hike in June on Thursday, up from less than 5% the prior week, but that percentage fell to 15% on Friday as FOMC Chair Jerome Powell took a less decisive stance on future monetary policy moves. Further rate hikes aren’t off the table, even if the FOMC elects to take a ‘hawkish pause’ in June, and fixed income investors appeared to slowly come around to that realization last week.
What We’re Watching:
- The U.S. Purchasing Managers Index (PMI) for May is released Tuesday, with Manufacturing PMI expected to drop to 50.0 from 50.2 in April, while Services PMI is expected to decline to 52.6 from 53.6 the prior month. A reading above 50 indicates expansion, below 50 contraction.
- Eurozone Markit PMI for May is also released Tuesday, with the Composite reading expected to fall slightly to 54.0 from 54.1 in April. Services PMI is expected to fall to 55.5 from 56.2 in April while Manufacturing PMI is expected to stabilize a bit at 46.0 versus 45.8 in April. A reading above 50 signals growth over the prior month, a reading below 50 is indicative of contraction.
- Minutes from the Federal Open Market Committee’s May meeting are released Wednesday.
- Initial Jobless Claims for the week ended May 20 are released Thursday.
- April Personal Consumption Expenditure (PCE), the Fed’s preferred inflation gauge, is released Friday. Headline PCE is expected to rise 0.3% month over month, above the 0.08% reading in March, and 4.2% year over year, in-line with the March reading. Core PCE, which excludes food and energy, is also expected to rise 0.3% month over month, modestly above the 0.28% reading from March, and 4.6% year over year, again in-line with the March reading.
The content and any portion of this newsletter is for personal use only and may not be reprinted, sold or redistributed without the written consent of Regions Bank. Regions, the Regions logo and other Regions marks are trademarks of Regions Bank. The names and marks of other companies or their services or products may be the trademarks of their owners and are used only to identify such companies or their services or products and not to indicate endorsement or sponsorship of Regions or its services or products. The information and material contained herein is provided solely for general information purposes.
Regions does not make any warranty or representation relating to the accuracy, completeness or timeliness of any information contained in the newsletter and shall not be liable for any damages of any kind relating to such information nor as to the legal, regulatory, financial or tax implications of the matters referred herein. This material is not intended to be investment advice nor is this information intended as an offer or solicitation for the purchase or sale of any security or other financial instrument. Any opinions expressed herein are given in good faith, are subject to change without notice, and are only current as of the stated date of their issue. Regions Asset Management is a business group within Regions Bank that provides investment management services to customers of Regions Bank. Employees of Regions Asset Management may have positions in securities or their derivatives that may be mentioned in this report or in their personal accounts. Additionally, affiliated companies may hold positions in the mentioned companies in their portfolios or strategies. The companies mentioned specifically are sample companies, noted for illustrative purposes only.
The mention of the companies should not be construed as a recommendation to buy, hold or sell positions in your investment portfolio. Neither Regions Bank nor Regions Asset Management (collectively, “Regions”) are registered municipal advisors nor provide advice to municipal entities or obligated persons with respect to municipal financial products or the issuance of municipal securities (including regarding the structure, timing, terms and similar matters concerning municipal financial products or municipal securities issuances) or engage in the solicitation of municipal entities or obligated persons for such services.
With respect to this presentation and any other information, materials or communications provided by Regions, (a) Regions is not recommending an action to any municipal entity or obligated person, (b) Regions is not acting as an advisor to any municipal entity or obligated person and does not owe a fiduciary duty pursuant to Section 15 B of the Securities Exchange Act of 1934 to any municipal entity or obligated person with respect to such presentation, information, materials or communications, (c) Regions is acting for its own interests, and (d) you should discuss this presentation and any such other information, materials or communications with any and all internal and external advisors and experts that you deem appropriate before acting on this presentation or any such other information, materials or communications. Source: Bloomberg Index Services Limited. BLOOMBERG® is a trademark and service mark of Bloomberg Finance L.P. and its affiliates (collectively “Bloomberg”). BARCLAYS® is a trademark and service mark of Barclays Bank Plc (collectively with its affiliates, “Barclays”), used under license. Bloomberg or Bloomberg’s licensors, including Barclays, own all proprietary rights in the Bloomberg Barclays Indices. Neither Bloomberg nor Barclays approves or endorses this material or guarantees the accuracy or completeness of any information herein, or makes any warranty, express or implied, as to the results to be obtained therefrom and, to the maximum extent allowed by law, neither shall have any liability or responsibility for injury or damages arising in connection therewith.
Source: Bloomberg Index Services Limited. BLOOMBERG® is a trademark and service mark of Bloomberg Finance L.P. and its affiliates (collectively “Bloomberg”). BARCLAYS® is a trademark and service mark of Barclays Bank Plc (collectively with its affiliates, “Barclays”), used under license. Bloomberg or Bloomberg’s licensors, including Barclays, own all proprietary rights in the Bloomberg Barclays Indices. Neither Bloomberg nor Barclays approves or endorses this material or guarantees the accuracy or completeness of any information herein, or makes any warranty, express or implied, as to the results to be obtained therefrom and, to the maximum extent allowed by law, neither shall have any liability or responsibility for injury or damages arising in connection therewith.
The information provided herein is for informational purposes only and is intended to report on various investment views held by Multi-Asset Solutions (MAS) and Highland Associates. Opinions, estimates, forecasts, and statements of financial market trends are based on current market conditions that constitute the judgement of MAS and Highland Associates and are subject to change. The information is received from third parties, which is believed to be accurate, but no representation is made that the information provided is accurate and complete. The information is given as of the date indicated and believed to be reliable. While MAS and Highland have tried to provide accurate and timely information, there may be inadvertent technical or factual inaccuracies or typographical errors for which we apologize. The information provided herein does not constitute a solicitation or offer by Highland or its affiliates, to buy or sell any securities or other financial instrument, or to provide investment advice or service. Nothing contained herein should be construed as investment advice or a recommendation to purchase or sell a particular security. Investing involves a high degree of risk, and all investors should carefully consider their investment objective and the suitability of any investments.
Research services are provided through Multi-Asset Solutions, a department of the Regions Asset Management business group within Regions Bank. Highland is a wholly owned subsidiary of Regions Bank, which in turn is a wholly owned subsidiary of Regions Financial Corporation.
Past performance is not indicative of future results. Investments are subject to loss.