Stocks: Constructive U.S./China Trade Talks Spur Rally As U.S. Stocks Remain In Melt-Up Mode; U.S. Small Caps Trailing Large Cap Growth But Outpacing The ‘Average Stock; Active Week For IPOs Evidence Corporate Confidence Is Slowly Recovering; Breadth, Technical Setup Supportive Of Additional Upside For The S&P 500; Trade Talks Don’t Translate Into Outperformance For Chinese Stocks.
Download Weekly Market Commentary | May 19 2025
What We’re Watching:
- Initial jobless claims for the week ended May 17 and continuing jobless claims for the week ended May 10 are released Thursday. Initial jobless claims of 230k are expected.
- The S&P Global U.S. Purchasing Managers Index (PMI) for May is released The Services PMI is expected to rise to 51.1 from 50.8 the prior month and the Manufacturing PMI is expected to fall modestly to 49.8 from 50.2. A reading above 50 indicates expansion, while a reading below 50 implies contraction.
- Preliminary Eurozone Purchasing Managers Index (PMI) readings for May are released Thursday. Eurozone Composite PMI is expected to rise to 50.8 from 50.4 in April, with modest improvements in both Services (50.5 from 50.1 the prior month) and Manufacturing (49.3 from 49.0 in April) expected.
Key Observations
- U.S. stocks rallied last week after trade representatives from the U.S. and China met and struck a conciliatory tone, which market participants took as the two parties mutually attempting to de-escalate the situation. Investors appeared to modestly upgrade their assessment of the U.S. economy and, in turn, the outlook for corporate profits as a result of both countries agreeing to lower tariffs while they negotiated details of a broader trade deal.
- Sector leadership skewed decisively toward the ‘risk- on’ camp as consumer discretionary, industrials, and information technology outperformed while consumer staples, health care, and utilities lagged. The most heavily shorted stocks (high short interest), and the most heavily indebted companies (high leverage) performed well as market participants flocked to some of the cheapest, most beaten down pockets of the market expecting them to play catch-up should the bulls push the broader index back to mid-February’s all-time high.
- Constructive U.S./China trade talks and the details of a proposed spending bill in the House of Representatives spurred selling in the Treasury market early in the week, but ‘cooler’ April inflation readings – along with higher yields – brought buyers back into Treasuries into the weekend. All told, Treasury yields closed out the week higher by 2- to 10-basis points across the curve. Riskier, higher yielding corporate bonds outperformed more interest rate sensitive investment-grade corporates on the week as recession fears subsided.
What Happened Last Week:
Stocks: Constructive U.S./China Trade Talks
Spur Rally As U.S. Stocks Remain In Melt-Up
Mode; U.S. Small Caps Trailing Large Cap
Growth But Outpacing The ‘Average Stock;’
Active Week For IPOs Evidence Corporate
Confidence Is Slowly Recovering; Breadth,
Technical Setup Supportive Of Additional
Upside For The S&P 500; Trade Talks Don’t
Translate Into Outperformance For Chinese
Stocks.
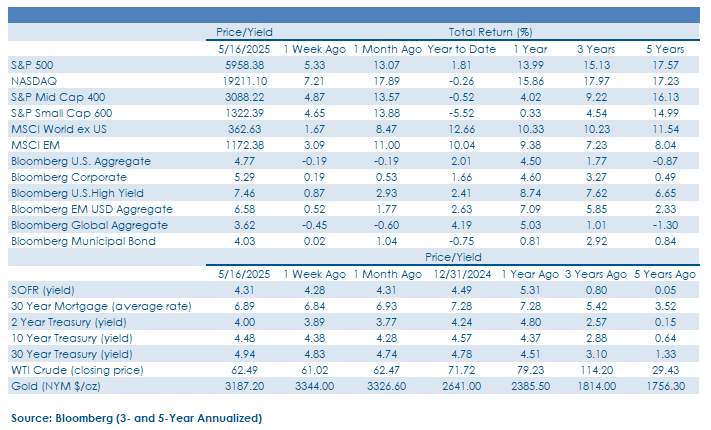
‘Magnificent 7’ Rally, Short Covering Pushes U.S. Large-Caps Back Into Positive Territory For 2025. The S&P 500 closed higher in each of the five trading days last week, generating a 5.3% gain in the process.Leadership took on a decidedly offensive or ‘risk-on’ tone with the consumer discretionary, industrials, and information technology sectors all outpacing the S&P 500’s sizable weekly gain. On the other end of the spectrum, more defensive and yield-sensitive sectors closed in positive territory but lagged with consumer staples, health care, real estate, and utilities all underperforming. In the wake of constructive comments made by the U.S. and China last Monday, investors appeared eager to increase exposure to the anointed Magnificent 7 group of stocks, evidenced by the fact that Microsoft was the only member of this cohort to close out the week with a gain of less than 5%, while Nvidia and Tesla turned out weekly gains of greater than 15%.
U.S./China Talks A Positive Development, Brings Down The Trade Temperature. U.S./China agree to cut tariffs with the U.S. levying 35% tariffs on Chinese imports and China applying 10% tariffs to imported goods from the U.S. De-escalation is an undeniable positive as it decreases the likelihood of a worst-case scenario, i.e. recession for the U.S. economy, and it brings down the geopolitical temperature a bit, but some skepticism remains warranted as U.S. economic growth and the outlook for corporate profits remains in flux and policy uncertainty, while reduced, is still elevated.
Small Caps Trail Large-Cap Growth, But Fare Better Than The ‘Average Stock.’ Market participants were willing to bid-up prices of riskier assets last week with the S&P Small Cap 600 index rising by 4.6% after easing trade tensions appeared to take the worst-case scenario for the U.S. economy off the table. Notably, while small-caps couldn’t keep up with the tech-heavy Nasdaq Composite which returned 7.2% on the week, the S&P 600 managed to outperform the S&P 500 Equal Weight index on the week, its fifth consecutive week of outperformance versus the ‘average stock’ index. At the end of last week, over 90% of the S&P Small Cap 600 had reported earnings, with an average upside earnings surprise of 8.7%, suggesting expectations for the asset class may have been lowered too much, setting a more achievable earnings bar for future quarters. The fundamental backdrop for small cap stocks is a challenging one at present, but a mixture of low expectations along with cheap valuations approaching lows over the past decade, sets up an ideal catch-up scenario.
Some Signs Of Thawing In The IPO Market An Early Indicator Of Corporate Confidence Improving. Last Wednesday, online trading and investment platform eToro Group went public, and after pricing the issue at $52, the stock opened well above the high-end of the expected range, indicating strong demand. The success of the eToro offering, along with strong performance out of CoreWeave, another recent high-profile initial public offering (IPO), could lead to a pick-up in activity in the coming months as companies looking to go public are emboldened by recent success in the space.
S&P 500 In Search Of Back-To-Back Weekly Closes Above Its 200-Day Moving Average. The de-escalation of trade tensions between the world’s two largest economies prompted the S&P 500 to open sharply higher last Monday, a surge that took the index above its 200-day moving average. Last week was the S&P 500’s first weekly close above that technical landmark since the end of February. Some signs of exhaustion started to creep in later in the week, but the S&P 500 still closed at/near its weekly high, and if the S&P 500 can close above the 5,760 level in back-to-back weeks, the 200-day moving average could be viewed as an area of support going forward. Other measures of market internals showed technical strength as well, specifically, breadth statistics were encouraging last week, with 80% of index constituents trading above their 20-day moving average last Friday.
Trade Talks Don’t Translate To Outperformance For Chinese Stocks As India, Taiwan Lead. The U.S. dollar’s modest advance last week kept emerging currencies rangebound, and the MSCI Emerging Market (EM) index gained a respectable 3% over course of the week driven, perhaps surprisingly, by Asian equities outside of China. Constructive tariff/trade talks between the United States and China buoyed Chinese stocks which rose 2.2% on the week, but the MSCI EM’s advance was largely due to rallies in India and Taiwan with both country indices rising by 4.3%. The bulk of the rally in India took place on Monday after a ceasefire deal with Pakistan materialized alongside the positive trade developments between the U.S. and China. India and Taiwan were also recipients of their own positive trade headlines as President Trump suggested India may remove tariffs on U.S. goods and rumors of a Taiwan trade deal made the rounds.
Bonds: Treasury Yields Surge As Constructive U.S./China Talks, Proposed Tax Package Spurs Selling But Higher Yields Attracted Buyers Mid-Week; Riskier Corporate Bonds Remain Well-Bid, But Sector Dispersion Is Noteworthy; April Inflation ‘Cooler’ Than Expected But Unlikely To Spur The FOMC To Move In June.
Treasury Yields Close The Week Higher As Recession Odds Fall On The Heels Of Constructive U.S./China Trade Talks. U.S. Treasuries sold off over the balance of last week due to a combination of factors that spurred selling across the yield curve. On the heels of constructive trade talks between the U.S. and China the weekend before, investors ratcheted lower the odds of a U.S. recession in the coming months/quarters, pushed out potential FOMC rate cuts, and sold higher quality bonds to raise cash and deploy proceeds into riskier stocks and higher yielding corporate bonds. Secondarily, details of the proposed tax provisions included in the budget reconciliation package being batted around in the House of Representatives leaked early in the week and contributed to the push higher in yields as fixed income investors viewed the package as outlined to materially widen the budget deficit with some estimates calling for the deficit to expand by $4T to $5T. A ‘cooler’ than expected April Producer Price Index (PPI) put downward pressure on yields into the weekend, but fixed income investors will likely remain skeptical that inflationary pressures in the coming months stay subdued as the impact of universal 10% tariffs flow through into the data. Broadly speaking, Treasury yields nudging up against the top-end of trading ranges make the belly of the curve, specifically bonds maturing between 2- and 10-years, a bit more appealing, but the jury is still out as to whether those ranges hold, particularly after Moody’s, one of the big three ratings agencies, downgraded the U.S.’ credit rating Friday after the close. Moody’s downgrade could put upward pressure on yields this week, but S&P made this move back in 2011 and Fitch did so in 2023, so one could argue this was a long time coming and should have little impact on yields once the shock value subsides. 4.60% is a level worth watching for the 10-year yield as a move above that level could bring a retest of the mid-January high yield of 4.80% into play and put downward pressure on bond prices.
Credit Spreads Continue To Compress, Signaling Calmer Waters For High Yield Corporate Bonds. Bond market participants put capital to work last week after positive trade news were priced in on Monday, pushing prices of below investment grade corporate bonds higher as the credit spread over Treasuries on the Bloomberg Corporate High Yield index compressed by 32-basis points on the week. The option-adjusted spread (OAS) on the Bloomberg High Yield index fell to a low of 299-basis points above the Treasury curve last week, a substantial dip from 384-bps at the start the month, highlighting conviction on the part of investors that corporations may not be as hard pressed to meet debt obligations as many feared based on the latest developments around tariffs. The move higher in prices of high yield corporates in recent weeks hasn’t impacted all credit sectors equally as energy sector spreads are still, on average, 50-bps wider than the broader index, which is notable given below investment grade energy names have historically traded tighter than the index in recent years. This is evidence that investors are discerning and haven’t just been chasing higher yields across the board without doing the work on underlying issues.
Small Business Confidence, April Inflation Readings Better Than Expected. Last Tuesday was a big day on the economic data front with the release of the April Consumer Price Index (CPI) and the latest reading on small business sentiment from the National Federation of Independent Business (NFIB). April Headline CPI rose 0.2% month over month and 2.3% year over year vs. 0.3% and 2.4%, estimates; Core CPI, which excludes volatile food and energy prices, also rose 0.2% month over month and 2.8% year over year vs. 0.3% and 2.8% estimates. The year over year core CPI reading rising 2.8% is problematic for policymakers at the Fed, but, as evidenced by the April Producer Price Index (PPI) released Thursday which fell 0.5% month over month versus the consensus estimate which called for a 0.3% rise, there were few signs inflationary pressures were reaccelerating in April. On the small business confidence front, the April NFIB Small Business Optimism survey came in above expectations at 95.8, a touch better than the 95.0 estimate. While this may seem to be a small ‘win,’ the index reading has fallen for four consecutive months after peaking in December, so some signs of stabilization are most welcome. Some clarity on the tariff front could go a long way toward improving small business sentiment and we will be watching for signs optimism picking up in the coming months.
IMPORTANT DISCLOSURES: THIS PUBLICATION HAS BEEN PREPARED BY THE STAFF OF HIGHLAND ASSOCIATES, INC. FOR DISTRIBUTION TO, AMONG OTHERS, HIGHLAND ASSOCIATES, INC. CLIENTS. HIGHLAND ASSOCIATES IS REGISTERED WITH THE UNITED STATES SECURITY AND EXCHANGE COMMISSION UNDER THE INVESTMENT ADVISORS ACT OF 1940. HIGHLAND ASSOCIATES IS A WHOLLY OWNED SUBSIDIARY OF REGIONS BANK, WHICH IN TURN IS A WHOLLY OWNED SUBSIDIARY OF REGIONS FINANCIAL CORPORATION. RESEARCH SERVICES ARE PROVIDED THROUGH MULTI-ASSET SOLUTIONS, A DEPARTMENT OF THE REGIONS ASSET MANAGEMENT BUSINESS GROUP WITHIN REGIONS BANK. THE INFORMATION AND MATERIAL CONTAINED HEREIN IS PROVIDED SOLELY FOR GENERAL INFORMATION PURPOSES ONLY. TO THE EXTENT THESE MATERIALS REFERENCE REGIONS BANK DATA, SUCH MATERIALS ARE NOT INTENDED TO BE REFLECTIVE OR INDICATIVE OF, AND SHOULD NOT BE RELIED UPON AS, THE RESULTS OF OPERATIONS, FINANCIAL CONDITIONS OR PERFORMANCE OF REGIONS BANK. UNLESS OTHERWISE SPECIFICALLY STATED, ANY VIEWS, OPINIONS, ANALYSES, ESTIMATES AND STRATEGIES, AS THE CASE MAY BE (“VIEWS”), EXPRESSED IN THIS CONTENT ARE THOSE OF THE RESPECTIVE AUTHORS AND SPEAKERS NAMED IN THOSE PIECES AND MAY DIFFER FROM THOSE OF REGIONS BANK AND/OR OTHER REGIONS BANK EMPLOYEES AND AFFILIATES. VIEWS AND ESTIMATES CONSTITUTE OUR JUDGMENT AS OF THE DATE OF THESE MATERIALS, ARE OFTEN BASED ON CURRENT MARKET CONDITIONS, AND ARE SUBJECT TO CHANGE WITHOUT NOTICE. ANY EXAMPLES USED ARE GENERIC, HYPOTHETICAL AND FOR ILLUSTRATION PURPOSES ONLY. ANY PRICES/QUOTES/STATISTICS INCLUDED HAVE BEEN OBTAINED FROM SOURCES BELIEVED TO BE RELIABLE, BUT HIGHLAND ASSOCIATES, INC. DOES NOT WARRANT THEIR COMPLETENESS OR ACCURACY. THIS INFORMATION IN NO WAY CONSTITUTES RESEARCH AND SHOULD NOT BE TREATED AS SUCH. THE VIEWS EXPRESSED HEREIN SHOULD NOT BE CONSTRUED AS INDIVIDUAL INVESTMENT ADVICE FOR ANY PARTICULAR PERSON OR ENTITY AND ARE NOT INTENDED AS RECOMMENDATIONS OF PARTICULAR SECURITIES, FINANCIAL INSTRUMENTS, STRATEGIES OR BANKING SERVICES FOR A PARTICULAR PERSON OR ENTITY. THE NAMES AND MARKS OF OTHER COMPANIES OR THEIR SERVICES OR PRODUCTS MAY BE THE TRADEMARKS OF THEIR OWNERS AND ARE USED ONLY TO IDENTIFY SUCH COMPANIES OR THEIR SERVICES OR PRODUCTS AND NOT TO INDICATE ENDORSEMENT, SPONSORSHIP, OR OWNERSHIP BY REGIONS OR HIGHLAND ASSOCIATES. EMPLOYEES OF HIGHLAND ASSOCIATES, INC., MAY HAVE POSITIONS IN SECURITIES OR THEIR DERIVATIVES THAT MAY BE MENTIONED IN THIS REPORT. ADDITIONALLY, HIGHLAND’S CLIENTS AND COMPANIES AFFILIATED WITH HIGHLAND ASSOCIATES MAY HOLD POSITIONS IN THE MENTIONED COMPANIES IN THEIR PORTFOLIOS OR STRATEGIES. THIS MATERIAL DOES NOT CONSTITUTE AN OFFER OR AN INVITATION BY OR ON BEHALF OF HIGHLAND ASSOCIATES TO ANY PERSON OR ENTITY TO BUY OR SELL ANY SECURITY OR FINANCIAL INSTRUMENT OR ENGAGE IN ANY BANKING SERVICE. NOTHING IN THESE MATERIALS CONSTITUTES INVESTMENT, LEGAL, ACCOUNTING OR TAX ADVICE. NON-DEPOSIT PRODUCTS INCLUDING INVESTMENTS, SECURITIES, MUTUAL FUNDS, INSURANCE PRODUCTS, CRYPTO ASSETS AND ANNUITIES: ARE NOT FDIC-INSURED I ARE NOT A DEPOSIT I MAY GO DOWN IN VALUE I ARE NOT BANK GUARANTEED I ARE NOT INSURED BY ANY FEDERAL GOVERNMENT AGENCY I ARE NOT A CONDITION OF ANY BANKING ACTIVITY.
NEITHER REGIONS BANK NOR REGIONS ASSET MANAGEMENT (COLLECTIVELY, “REGIONS”) ARE REGISTERED MUNICIPAL ADVISORS NOR PROVIDE ADVICE TO MUNICIPAL ENTITIES OR OBLIGATED PERSONS WITH RESPECT TO MUNICIPAL FINANCIAL PRODUCTS OR THE ISSUANCE OF MUNICIPAL SECURITIES (INCLUDING REGARDING THE STRUCTURE, TIMING, TERMS AND SIMILAR MATTERS CONCERNING MUNICIPAL FINANCIAL PRODUCTS OR MUNICIPAL SECURITIES ISSUANCES) OR ENGAGE IN THE SOLICITATION OF MUNICIPAL ENTITIES OR OBLIGATED PERSONS FOR SUCH SERVICES. WITH RESPECT TO THIS PRESENTATION AND ANY OTHER INFORMATION, MATERIALS OR COMMUNICATIONS PROVIDED BY REGIONS, (A) REGIONS IS NOT RECOMMENDING AN ACTION TO ANY MUNICIPAL ENTITY OR OBLIGATED PERSON, (B) REGIONS IS NOT ACTING AS AN ADVISOR TO ANY MUNICIPAL ENTITY OR OBLIGATED PERSON AND DOES NOT OWE A FIDUCIARY DUTY PURSUANT TO SECTION 15B OF THE SECURITIES EXCHANGE ACT OF 1934 TO ANY MUNICIPAL ENTITY OR OBLIGATED PERSON WITH RESPECT TO SUCH PRESENTATION, INFORMATION, MATERIALS OR COMMUNICATIONS, (C) REGIONS IS ACTING FOR ITS OWN INTERESTS, AND (D) YOU SHOULD DISCUSS THIS PRESENTATION AND ANY SUCH OTHER INFORMATION, MATERIALS OR COMMUNICATIONS WITH ANY AND ALL INTERNAL AND EXTERNAL ADVISORS AND EXPERTS THAT YOU DEEM APPROPRIATE BEFORE ACTING ON THIS PRESENTATION OR ANY SUCH OTHER INFORMATION, MATERIALS OR COMMUNICATIONS.
SOURCE: BLOOMBERG INDEX SERVICES LIMITED. BLOOMBERG® IS A TRADEMARK AND SERVICE MARK OF BLOOMBERG FINANCE L.P. AND ITS AFFILIATES (COLLECTIVELY “BLOOMBERG”). BARCLAYS® IS A TRADEMARK AND SERVICE MARK OF BARCLAYS BANK PLC (COLLECTIVELY WITH ITS AFFILIATES, “BARCLAYS”), USED UNDER LICENSE. BLOOMBERG OR BLOOMBERG’S LICENSORS, INCLUDING BARCLAYS, OWN ALL PROPRIETARY RIGHTS IN THE BLOOMBERG BARCLAYS INDICES. NEITHER BLOOMBERG NOR BARCLAYS APPROVES OR ENDORSES THIS MATERIAL OR GUARANTEES THE ACCURACY OR COMPLETENESS OF ANY INFORMATION HEREIN, OR MAKES ANY WARRANTY, EXPRESS OR IMPLIED, AS TO THE RESULTS TO BE OBTAINED THEREFROM AND, TO THE MAXIMUM EXTENT ALLOWED BY LAW, NEITHER SHALL HAVE ANY LIABILITY OR RESPONSIBILITY FOR INJURY OR DAMAGES ARISING IN CONNECTION THEREWITH.