Stocks: Slow Start, Strong Finish As The S&P 500 Closes The Week Above 5,200, Setting The Stage For A Move Back To The March All-Time High; Opportunities Abound Abroad As Euro Area, U.K., And Chinese Stocks Have The Wind At Their Sails.
Download Weekly Market Commentary | May 13 2024
What We’re Watching:
- U.S. Producer Price Index (PPI) for April is released Tuesday which is expected to have risen 0.3% month over month and 2.2% year over year, which would be 0.1% above the readings from March. Wholesale price increases, as measured by the PPI, flow into consumer prices and should factor into the Consumer Price Index (CPI) and Personal Consumption Expenditure (PCE) over subsequent months, so market participants will be looking to PPI as an indicator of where consumer prices might be going in the coming months.
- U.S. Consumer Price Index (CPI) for April is released Wednesday and the headline reading is expected to rise 0.4% month over month and 3.4% year over year vs. 0.40% and 3.5% readings from March. Core CPI, which excludes volatile food and energy prices, is expected to rise 0.3% month over month and 3.6% year over year, vs. 0.4% and 3.8% readings in March.
- U.S. Retail Sales for April are released Wednesday with the headline reading expected to show 0.4% growth month over month. This release is worth watching as a read on the state of the U.S. consumer and their willingness and ability to spend, which is crucial given consumption accounts for over 60% of U.S. GDP.
- Eurozone Industrial Production (IP) for March is released Wednesday and is expected to fall 0.4% month over month, well below 0.8% month over month growth in February.
Key Observations
- Domestic stocks were slow out of the gate but finished the week with gains as participation was broad based. The ‘Magnificent 7’ lagged the S&P 500 by a meaningful margin on the week, evidence of sector rotation under the surface, an encouraging trend should it persist.
- Eurozone and U.K. stocks continue to perform well, and further upside is possible as an improving economic outlook and more accommodative monetary policies could draw investors seeking relative value into these long-forgotten pockets of the equity market.
- Treasury yields bounced around in a narrow trading range due to a push vs. pull from economic data releases, but most closed out the week little changed, presenting investors with a ‘clip your coupon’ kind of week.
- Corporate bond issuance has picked up meaningfully, but credit spreads have barely moved, evidence that even after the recent drop in Treasury yields there continues to be plenty of capital willing to accept credit risk, even if lower yields mean less compensation for doing so. This is a positive sign of investor risk appetite.
What Happened Last Week:
Stocks: Slow Start, Strong Finish As The S&P 500 Closes The Week Above 5,200, Setting The Stage For A Move Back To The March All-Time High; Opportunities Abound Abroad As Euro Area, U.K., And Chinese Stocks Have The Wind At Their Sails.
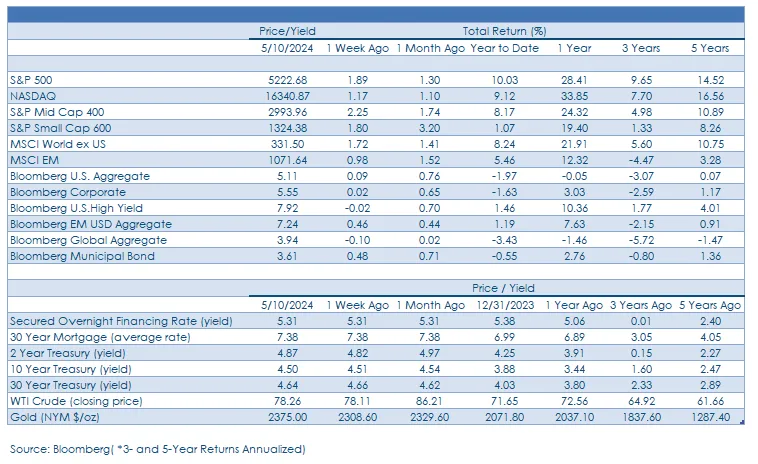
U.S. Large Cap Stocks Preparing To Make A Run Back To March’s All-Time High. There was an upward bias to equity prices in the U.S. over the back-half of last week with the S&P 500, S&P Mid Cap 400, and S&P Small Cap 600 all posting gains. The S&P 500 ended the week less than 1% below its all-time closing high set back in March, and while bulls lacked the necessary firepower to test that level last week, we expect them to mount a more concerted effort this week to breach that level, assuming inflation data falls in-line or below expectations. While the S&P 500 failed to make a new high, we were encouraged by the market’s breadth as the Bloomberg Magnificent 7 index, an equally weighted basket of Alphabet, Amazon, Apple, Meta Platforms, Microsoft, Nvidia, and Tesla, posted a 0.5% weekly gain, lagging the S&P 500, S&P 500 Equal-Weight, and even the S&P Small Cap 600. Sentiment, seasonality, and liquidity are all potential tailwinds for equity prices into the summer months, and the S&P 500 is in the process of building up the necessary energy/buying power for a run back to the March high of 5,265. Should the S&P 500 break through the March high, 5,300 becomes potential round- number resistance above.
Small Caps Catch A Bid As Falling Yields And Earnings Growth Attracts Buyers. The S&P 600 Small Cap Index generated a 1.8% weekly return, performing in-line with the S&P 500 as a higher initial jobless claims reading, and strong quarterly earnings results boosted sentiment surrounding the asset class. That advance coincided with better bond market returns yet again as the two appear intertwined at this stage due to the impact shorter-term financing and labor costs have on smaller companies. Through the end of last week, 85% of the S&P Small Cap 600 had reported earnings, with an average 10.5% upside surprise to earnings relative to the consensus estimate, an encouraging sign that profitability has returned in a sustainable manner after a two-quarter absence.
Improving Economic Data, More Accommodative Central Bank Boosts The Case For U.K. Equities. The U.K.’s FTSE 100 index rose 2.6% last week to end the week at an all-time high on the heels of improving economic data and the Bank of England (BoE) laying the groundwork to begin easing policy as soon as next month. In the first quarter, the U.K. economy grew 0.6% quarter over quarter, above the 0.3% that was expected, and in March manufacturing production rose 0.3% month over month, well above the -0.2% expectation. Economic data out of the U.K. has been encouraging in recent months with most data points trending higher and with the BoE expected to ease monetary policy next month, economic momentum could be sustained, powering additional equity gains. Notably, through last week, the FTSE 100 has turned out a 13.6% total return since bottoming in mid-January, outperforming the S&P 500 by 3% over that time frame.
Breadth, Price Momentum Point To Further Gains For European Equities. The Looking at Europe through a broader lens, 80% of the constituents in the Stoxx Europe 600 index were trading above their 200-day moving average as of last Friday, a sign of impressive breadth and momentum which should power the broader index to gains over the coming months. Relative to the S&P 500, the Stoxx 600 index has a larger exposure to financial services, health care, and industrials, while carrying much less weight in the information technology sector. An improved outlook for economic growth abroad could lead to a rotation out of some of the faster growing pockets of the market such as technology and into cyclical exposures trading at attractive relative valuations. It’s also worth mentioning that the Stoxx Europe 600 index is trading at 14.5 times projected 2024 earnings, versus the S&P 500 at 21.3 times, and carries a 3.1% dividend yield, above the S&P 500’s relatively paltry 1.3% yield.
Chinese Stocks Digesting Recent Gains. The MSCI China index drifted higher again last week, ending with a 1.9% gain on its way to an 12.7% one-month return. Chinese stocks likely need to consolidate gains as the MSCI China index teeters on the edge of overbought territory for the first time since July of last year. The optimal path would be for China’s stock market to ‘take a breather’ and correct through time, instead of reversing course and moving lower in price. Stronger revenue growth and improved guidance out of some higher profile health care, technology, and industrial names boosted the MSCI China index. Also, news that Chinese policymakers are considering a tax waiver that would incentivize investment in Chinese stocks serves as further evidence the government is more closely aligned with investors of late.
Bonds: Investors Clip Coupons Amid A Choppy, Range-Bound Yield Backdrop; Corporate Issuance On The Rise With Plenty Of Capital Chasing; ‘Good Enough’ Treasury Auctions, Higher Jobless Claims Put Downward Pressure On Treasury Yields.
Fixed Income Investors Clip Their Coupons As Treasury Yields End The Week Little Changed. Yields across the U.S. Treasury curve fell due to a higher initial jobless claims number in the middle of last week before reversing course and moving modestly higher into the weekend as the University of Michigan consumer sentiment index pointed toward a rise in consumer inflation expectations. Ultimately, the 10-year Treasury yield ended the week unchanged at 4.50%, but the path forward for yields over the coming weeks will likely be determined by this week’s release of the April Consumer Price Index (CPI). From a technical perspective. 4.35% to 4.40% should provide a strong floor of support for the 10-year yield over coming weeks, and a break below that range would likely lead to questions surrounding the U.S. economic growth outlook. On the high side, 4.70% to 4.75% remains a ceiling of resistance until further notice.
Opportunistic Corporate Borrowers Boost Issuance After The Fall In Treasury Yields. The sharp drop in Treasury yields over the past three-plus weeks has served to lower yields on corporate bonds across the credit spectrum. In an opportunistic move, corporate borrowers came to market with roughly $11B in new high yield and $52B in new investment grade debt issuance last Monday through Wednesday, the highest three-day volume for both sub- asset classes in the last two years according to data compiled by Bloomberg. Those numbers were roughly double dealer projections as recent volatility in rates and a surge in risk-on sentiment has created a sense of urgency for debt sellers. On the demand side, deals are still coming in well oversubscribed, an indication that there is plenty of capital chasing new supply despite the recent pull back in yields.
‘Good Enough’ Treasury Auctions Calm Demand Fears, Investor Attention Turns To Inflation Readings. Last Wednesday, the U.S. Treasury auctioned off $42B of 10-year notes, an event we were closely watching as a read on the demand backdrop for longer-term bonds. With the 10-year yield at auction 1 bp above where the 10-year was trading in the market at the time we would characterize the auction and demand as not great, but good enough. Treasury followed up Wednesday’s 10-year auction with $25B of 30- year notes on Thursday, and this auction was met by strong demand. Direct bidders, primarily insurance companies, were willing buyers taking down the largest percentage of a 30-year issue dating back to July of 2023, while indirect bidders, primarily foreign central banks, took down a smaller allocation than has been typical of recent 10-year auctions. Notably, the when-issued yield of 4.635% was 3⁄4 of a basis point below where the 30-year was trading, a sign of robust demand. Fixed income investors may breathe a sigh of relief now that these auctions are in the rearview mirror but won’t have long too long to celebrate with the release of the April PPI and CPI this week, data points that could contribute to volatility on the long end of the Treasury curve.
Initial Jobless Claims Another Sign The Labor Market Is Cooling. Initial jobless claims for the week ended May 4 came in above expectations at 231k vs. the consensus estimate of 212.5k and the prior reading of 209k. We wouldn’t put too much stock in any one data point, and that is particularly true of labor market data which of late seems to provide more noise than signal, but after consistently coming in around 210k in recent months, the jump is notable and initial claims will be worth watching in the coming weeks to see if a weakening trend is persistent in the data. The uptick in jobless claims week over week points toward the labor market cooling, not cracking, which lines up with the nonfarm payrolls report for April which was released the prior week and showed that fewer jobs were created during the month than was expected, the first monthly shortfall since October of 2023. A cooling of the labor market could take some of the pressure off wage/ average hourly earnings growth and alleviate some of the upward pressures on inflation that is keeping policymakers up at night. Treasury yields didn’t respond much to the higher claims data, and rightfully so given its just one data point. But if the claims data surprises to the upside in the coming weeks we would likely see some movement in Fed funds futures and Treasury yields as market participants would pull forward and price in rate cuts sooner than is currently anticipated.
IMPORTANT DISCLOSURES: THIS PUBLICATION HAS BEEN PREPARED BY THE STAFF OF HIGHLAND ASSOCIATES, INC. FOR DISTRIBUTION TO, AMONG OTHERS, HIGHLAND ASSOCIATES, INC. CLIENTS. HIGHLAND ASSOCIATES IS REGISTERED WITH THE UNITED STATES SECURITY AND EXCHANGE COMMISSION UNDER THE INVESTMENT ADVISORS ACT OF 1940. HIGHLAND ASSOCIATES IS A WHOLLY OWNED SUBSIDIARY OF REGIONS BANK, WHICH IN TURN IS A WHOLLY OWNED SUBSIDIARY OF REGIONS FINANCIAL CORPORATION. RESEARCH SERVICES ARE PROVIDED THROUGH MULTI-ASSET SOLUTIONS, A DEPARTMENT OF THE REGIONS ASSET MANAGEMENT BUSINESS GROUP WITHIN REGIONS BANK. THE INFORMATION AND MATERIAL CONTAINED HEREIN IS PROVIDED SOLELY FOR GENERAL INFORMATION PURPOSES ONLY. TO THE EXTENT THESE MATERIALS REFERENCE REGIONS BANK DATA, SUCH MATERIALS ARE NOT INTENDED TO BE REFLECTIVE OR INDICATIVE OF, AND SHOULD NOT BE RELIED UPON AS, THE RESULTS OF OPERATIONS, FINANCIAL CONDITIONS OR PERFORMANCE OF REGIONS BANK. UNLESS OTHERWISE SPECIFICALLY STATED, ANY VIEWS, OPINIONS, ANALYSES, ESTIMATES AND STRATEGIES, AS THE CASE MAY BE (“VIEWS”), EXPRESSED IN THIS CONTENT ARE THOSE OF THE RESPECTIVE AUTHORS AND SPEAKERS NAMED IN THOSE PIECES AND MAY DIFFER FROM THOSE OF REGIONS BANK AND/OR OTHER REGIONS BANK EMPLOYEES AND AFFILIATES. VIEWS AND ESTIMATES CONSTITUTE OUR JUDGMENT AS OF THE DATE OF THESE MATERIALS, ARE OFTEN BASED ON CURRENT MARKET CONDITIONS, AND ARE SUBJECT TO CHANGE WITHOUT NOTICE. ANY EXAMPLES USED ARE GENERIC, HYPOTHETICAL AND FOR ILLUSTRATION PURPOSES ONLY. ANY PRICES/QUOTES/STATISTICS INCLUDED HAVE BEEN OBTAINED FROM SOURCES BELIEVED TO BE RELIABLE, BUT HIGHLAND ASSOCIATES, INC. DOES NOT WARRANT THEIR COMPLETENESS OR ACCURACY. THIS INFORMATION IN NO WAY CONSTITUTES RESEARCH AND SHOULD NOT BE TREATED AS SUCH. THE VIEWS EXPRESSED HEREIN SHOULD NOT BE CONSTRUED AS INDIVIDUAL INVESTMENT ADVICE FOR ANY PARTICULAR PERSON OR ENTITY AND ARE NOT INTENDED AS RECOMMENDATIONS OF PARTICULAR SECURITIES, FINANCIAL INSTRUMENTS, STRATEGIES OR BANKING SERVICES FOR A PARTICULAR PERSON OR ENTITY. THE NAMES AND MARKS OF OTHER COMPANIES OR THEIR SERVICES OR PRODUCTS MAY BE THE TRADEMARKS OF THEIR OWNERS AND ARE USED ONLY TO IDENTIFY SUCH COMPANIES OR THEIR SERVICES OR PRODUCTS AND NOT TO INDICATE ENDORSEMENT, SPONSORSHIP, OR OWNERSHIP BY REGIONS OR HIGHLAND ASSOCIATES. EMPLOYEES OF HIGHLAND ASSOCIATES, INC., MAY HAVE POSITIONS IN SECURITIES OR THEIR DERIVATIVES THAT MAY BE MENTIONED IN THIS REPORT. ADDITIONALLY, HIGHLAND’S CLIENTS AND COMPANIES AFFILIATED WITH HIGHLAND ASSOCIATES MAY HOLD POSITIONS IN THE MENTIONED COMPANIES IN THEIR PORTFOLIOS OR STRATEGIES. THIS MATERIAL DOES NOT CONSTITUTE AN OFFER OR AN INVITATION BY OR ON BEHALF OF HIGHLAND ASSOCIATES TO ANY PERSON OR ENTITY TO BUY OR SELL ANY SECURITY OR FINANCIAL INSTRUMENT OR ENGAGE IN ANY BANKING SERVICE. NOTHING IN THESE MATERIALS CONSTITUTES INVESTMENT, LEGAL, ACCOUNTING OR TAX ADVICE. NON-DEPOSIT PRODUCTS INCLUDING INVESTMENTS, SECURITIES, MUTUAL FUNDS, INSURANCE PRODUCTS, CRYPTO ASSETS AND ANNUITIES: ARE NOT FDIC-INSURED I ARE NOT A DEPOSIT I MAY GO DOWN IN VALUE I ARE NOT BANK GUARANTEED I ARE NOT INSURED BY ANY FEDERAL GOVERNMENT AGENCY I ARE NOT A CONDITION OF ANY BANKING ACTIVITY.
NEITHER REGIONS BANK NOR REGIONS ASSET MANAGEMENT (COLLECTIVELY, “REGIONS”) ARE REGISTERED MUNICIPAL ADVISORS NOR PROVIDE ADVICE TO MUNICIPAL ENTITIES OR OBLIGATED PERSONS WITH RESPECT TO MUNICIPAL FINANCIAL PRODUCTS OR THE ISSUANCE OF MUNICIPAL SECURITIES (INCLUDING REGARDING THE STRUCTURE, TIMING, TERMS AND SIMILAR MATTERS CONCERNING MUNICIPAL FINANCIAL PRODUCTS OR MUNICIPAL SECURITIES ISSUANCES) OR ENGAGE IN THE SOLICITATION OF MUNICIPAL ENTITIES OR OBLIGATED PERSONS FOR SUCH SERVICES. WITH RESPECT TO THIS PRESENTATION AND ANY OTHER INFORMATION, MATERIALS OR COMMUNICATIONS PROVIDED BY REGIONS, (A) REGIONS IS NOT RECOMMENDING AN ACTION TO ANY MUNICIPAL ENTITY OR OBLIGATED PERSON, (B) REGIONS IS NOT ACTING AS AN ADVISOR TO ANY MUNICIPAL ENTITY OR OBLIGATED PERSON AND DOES NOT OWE A FIDUCIARY DUTY PURSUANT TO SECTION 15B OF THE SECURITIES EXCHANGE ACT OF 1934 TO ANY MUNICIPAL ENTITY OR OBLIGATED PERSON WITH RESPECT TO SUCH PRESENTATION, INFORMATION, MATERIALS OR COMMUNICATIONS, (C) REGIONS IS ACTING FOR ITS OWN INTERESTS, AND (D) YOU SHOULD DISCUSS THIS PRESENTATION AND ANY SUCH OTHER INFORMATION, MATERIALS OR COMMUNICATIONS WITH ANY AND ALL INTERNAL AND EXTERNAL ADVISORS AND EXPERTS THAT YOU DEEM APPROPRIATE BEFORE ACTING ON THIS PRESENTATION OR ANY SUCH OTHER INFORMATION, MATERIALS OR COMMUNICATIONS.
SOURCE: BLOOMBERG INDEX SERVICES LIMITED. BLOOMBERG® IS A TRADEMARK AND SERVICE MARK OF BLOOMBERG FINANCE L.P. AND ITS AFFILIATES (COLLECTIVELY “BLOOMBERG”). BARCLAYS® IS A TRADEMARK AND SERVICE MARK OF BARCLAYS BANK PLC (COLLECTIVELY WITH ITS AFFILIATES, “BARCLAYS”), USED UNDER LICENSE. BLOOMBERG OR BLOOMBERG’S LICENSORS, INCLUDING BARCLAYS, OWN ALL PROPRIETARY RIGHTS IN THE BLOOMBERG BARCLAYS INDICES. NEITHER BLOOMBERG NOR BARCLAYS APPROVES OR ENDORSES THIS MATERIAL OR GUARANTEES THE ACCURACY OR COMPLETENESS OF ANY INFORMATION HEREIN, OR MAKES ANY WARRANTY, EXPRESS OR IMPLIED, AS TO THE RESULTS TO BE OBTAINED THEREFROM AND, TO THE MAXIMUM EXTENT ALLOWED BY LAW, NEITHER SHALL HAVE ANY LIABILITY OR RESPONSIBILITY FOR INJURY OR DAMAGES ARISING IN CONNECTION THEREWITH.