Stocks: U.S. Large Cap Stocks End Four- Week Losing Streak With A Half-Hearted Bounce; Mid Still Favored Over Small; ‘Buy The Rumor, Sell The News’ Hits German Stocks As Fiscal Spending Plan Passes Parliament, But A Cyclical Upswing Abroad Is Still Likely.
Download Weekly Market Commentary | March 24 2025
What We’re Watching:
- The Conference Board releases its Consumer Confidence survey for March on Tuesday, with the reading expected to drop to 93.6 from 98.3 in February. This survey will be closely watched to see if it sends a similar message to the University of Michigan’s Consumer Sentiment results which have trailed off in recent months, due in large part to a sharp rise in the inflation expectations component of the survey.
- Initial claims for unemployment insurance for the week ended March 22 and continuing claims for the week ended March 15 are released Thursday and will be closely watched to gauge how rapidly conditions in the U.S. labor market are deteriorating.
- February Personal Consumption Expenditure (PCE), the FOMC’s preferred inflation gauge, is released Friday. Headline PCE is expected to rise 0.3% month over month and 2.5% year over year, in-line with the January readings. Core PCE is expected to rise 0.3% month over month, in-line with the prior months’ reading, but the year over year figure is expected to rise to 2.7% in February from 2.6% in January. If PCE readings come in as anticipated, this would provide policymakers with more evidence that progress on bringing inflation down to target has stalled, making the Committee less likely to respond to economic weakness with rate cuts in the immediate future.
Key Observations
- U.S. large-cap stocks were barely able to hold on to gains as sentiment and risk appetite ebbed amid continued trade uncertainty and concerns that the FOMC wouldn’t be quick to rush to the aid of the economy and stock market should growth continue to falter due to sticky inflation. Interestingly, U.S. small-cap stocks narrowly outpaced large-caps on the week, a potential sign that this cohort of stocks is washed out in the near-term, but credit spreads on high yield corporate bonds are worth watching as a signal that a bottom may be in.
- ‘Buy the rumor, sell the news’ hit indices tied to China and Germany as investors took profits despite encouraging news on the fiscal stimulus/spending fronts out of both countries which could set both economies up for cyclical upswings. The MSCI China and MSCI Germany are both still higher by 18% or more year-to-date, so some give back should be expected and will likely prove to be a healthy occurrence.
- The Federal Open Market Committee (FOMC) left the Fed funds rate unchanged but lowered its outlook for U.S. economic growth in 2025 while ratcheting its expectation higher for core inflation. These shifts lend credence to the narrative that stagflation is a very real concern for the U.S. economy. Notably, the FOMC announced that starting April 1st it would only allow $5B per month in Treasuries to run off its balance sheet, down from $25B. This move will likely serve to cap yields on long-term Treasuries in the coming months.
What Happened Last Week:
Stocks: U.S. Large Cap Stocks End Four- Week Losing Streak With A Half-Hearted Bounce; Mid Still Favored Over Small; ‘Buy The Rumor, Sell The News’ Hits German Stocks As Fiscal Spending Plan Passes Parliament, But A Cyclical Upswing Abroad Is Still Likely.
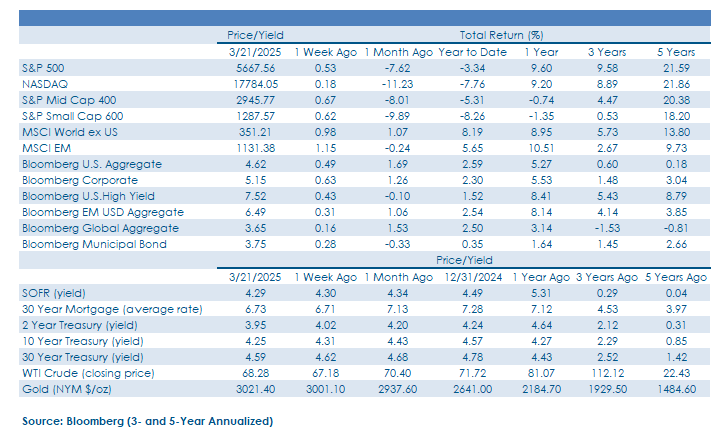
After Four Consecutive Down Weeks, U.S. Large-Caps Post A Modest Weekly Gain. After posting losses for four consecutive weeks and falling 7.7%, the S&P 500 eked out a 0.5% return last week, powered by gains out of the energy, financials, and health care sectors. Perhaps most importantly, selling pressure in the communication services, consumer discretionary, and information technology sectors appeared to subside, buoying U.S. large-cap indices. Breadth early in the week was impressive with 87% of S&P 500 constituents and every S&P 500 sector ending St. Patrick’s Day with a gain, but participation trailed off alongside trading volume over the balance of the week and only one-third of S&P 500 names traded above their 20-day moving average at the end of last week. This is evidence of a lack of short-term momentum behind last week’s move despite back-to-back days (3/14 and 3/17) in which the S&P 500 posted 8-to-1 or better advancing stocks to declining stocks. The S&P 500 was unable to even come close to challenging key moving averages above on last week’s half-hearted bounce, but quarter-end rebalancing flows in the coming week(s) could bring some buyers back into beaten down U.S. large-cap stocks in the lead-up to earnings season. The CBOE Volatility Index, or VIX, closed the week just north of 20, evidence that market participants saw little reason to hedge portfolios in preparation for additional downside in the S&P 500 over the next 30 days. This could be a sign of complacency, or that the bottom is in around 5,500. We lean toward the former as opposed to the latter at present.
The S&P 500’s 200-Day Moving Average Likely To Cap Any Near-Term Rally. Even with breadth showing signs of improving early last week, the S&P 500 was barely able to get within 1% of its 200-day moving average at 5,748. This level is worth watching over the near-term as any rally will have to clear it convincingly to give us confidence that the pullback has run its course. Earnings season starts in mid-April and with little in the way of negative earnings preannouncements or guide-downs to speak of yet, we expect a fair number of companies to use policy uncertainty to their advantage and lower/reset expectations for the coming quarters. This dynamic could further weigh on sentiment and lead to lowered earnings estimates and potentially a retest of the mid-March low around 5,500.
Energy, Financials Rebound Encouraging, But Sector- Specific Factors In Play. Last week cyclicals reasserted themselves as the energy and financials sectors caught a bid, rising by 3.2% and 1.9%, respectively. These two value- oriented areas have outperformed the S&P 500 thus far in 2025, benefitting from the rotation out of information technology names, and capitalizing on proposed and
expected policy shifts out of Washington D.C. However, strong relative performance out of these sectors doesn’t signal the all-clear based solely on their economically sensitive nature as energy equities have found favor due to oil prices rising in each of the last two weeks after West Texas Intermediate (WTI) found support near a 3-year low. The rebound in financials may be more than meets the eye as hopes of deregulation in the banking industry rose as the Trump administration nominated Michelle Bowman, widely viewed as an industry-friendly selection, as the new Fed Vice Chair of Supervision. Historical relationships between the broader S&P 500 and individual sectors may require closer scrutiny this time around considering the rapidly evolving policy backdrop as even defensive sectors such as utilities; that have been favorites in recent market downturn are showing they are far from impervious to flagging sentiment and risk appetite as the sector underperformed the S&P 500 last week after outpacing the index in the prior two weeks.
Small Caps Reverse Course, Move Higher, But Staying Power Favors Midcaps. The market’s ambivalence toward smaller capitalization companies in recent months shifted slightly last week as the S&P Small Cap 600 managed to muster a 0.6% return while the S&P 500 posted a 0.5% gain. The modest relative outperformance out of small-cap stocks ends a six-week losing streak against the blue-chip index but appears to be little more than a much-needed bounce back from oversold conditions after the small-cap index made a new 52-week low the week prior. Market internals are less reassuring as trading volume fell in the back half of the week, signifying minimal demand for exposure to smaller companies, broadly speaking, despite some stability on the week. U.S. mid-cap stocks, on the other hand, have held up better in the selloff and participated in the bounce last week. These companies sit in the middle ground between large-caps and small-caps as they offer consistent earnings along with higher quality balance sheets, and as a result haven’t endured a drawdown of similar magnitude as the S&P MidCap 400 has fallen 5.3% year-to-date, outpacing the S&P Small-Cap 600’s larger 8.3% drop. To be fair, small caps trade at a material discount, but given a more uncertain earnings outlook, valuations have room to cheapen even further from here should policy and economic uncertainty persist.
Historic German Fiscal Spending Plan Passes Parliament, Now Moves To The State Level For Approval. Last Tuesday, with a two-thirds majority, Germany’s parliament approved the creation of a €500B (~$550B) fund to be earmarked over the next 12 years for infrastructure spending. Parliament also announced that state governments will now be allowed to run a budget deficit of up to 0.35% of GDP, a notable shift given the tight fiscal reigns placed on German states for almost a century. The last hurdle facing the infrastructure fund is a vote by the Federal Council formed by a group of regional state governments that must vote on the ‘draft law’ that has been proposed. This could be a sticking point as historically all coalition parties within a state government need to agree on the draft for it to pass, and Bavaria is worth watching in this regard as one coalition party has yet to agree on the fiscal spending package. Interestingly, the German DAX, the country’s primary stock index, rallied sharply in the lead-up to Tuesday’s parliamentary vote, but sold off after it was announced, likely due to concerns surrounding whether the size of the package will pass muster and garner the necessary approval at the state level. The German DAX is still higher by over 20% year-to- date in U.S. dollar terms, outpacing the S&P 500 by almost 24% less than three months into the new year and is already pricing in quite a bit of economic improvement across the pond, so some profit taking should be expected. We continue to be impressed by the breadth/participation abroad and remain comfortable with our neutral allocation to international developed market stocks at present due to the structural shift at hand.
Bonds: Treasury Yields Entrenched In Recent Trading Range, Buoying Credit, Spread Sectors; FOMC’s Updated Dot-Plot, Balance Sheet Tweak Buoys Treasuries, Likely To Keep Downward Pressure On Yields.
Treasury Yields Continue To Slide, Boosting Investment- Grade And High Yield Corporates. Fixed income markets exhibited risk-off behavior as the 10-year Treasury yield moved lower by 6-basis points over the course of the week to close at 4.25%, remaining entrenched in its recent 4.15% to 4.30% trading range. The move lower in Treasury yields rewarded holders of high-quality corporates and longer- term government bonds above most other fixed income segments. Investment grade and high yield credit spreads tightened over the balance of the week with both credit benchmarks notching positive returns of 0.6% and 0.4%, respectively. Demand is one of the key factors causing a divergence in investment-grade corporate bonds versus their lower quality, higher yielding counterparts as market participants appear to be focusing more on return of capital than return of capital amid heightened policy uncertainty. Slower economic growth can see well capitalized companies muddle through while still meeting debt obligations, while even solid operators could face difficulties in a negative growth environment where defaults should be expected to rise. The Bloomberg U.S. High Yield Corporate index carries an appealing 7.5% yield-to-worst that is some 30-basis points above what it was yielding in mid-February, which has kept buyers interested in the lowest quality CCC-rated bonds carrying a 10.6% yield which we haven’t seen since September. New issuance in high yield corporates has been orderly up to this point in the month and supply is on track to rise month-over-month, with credit investors seemingly less wary about tariffs impacting creditworthiness beyond some individual company risks.
FOMC Leaves Funds Rate Unchanged As Expected, But Updated Dot-Plot And Balance Sheet Tweak Prove Market Moving. The Federal Open Market Committee (FOMC) concluded its two-day meeting on Wednesday and as expected, left the Fed funds rate unchanged, but adjustments to its balance sheet runoff plan and an update to the Committee’s Summary of Economic Projections, or dot-plot, garnered more attention from the investment community. The median FOMC ‘dot’ still projects two 25- bp cuts this year, and fewer Committee members now see three quarter-point cuts as likely this calendar year. On the economic growth front, the FOMC now expects the U.S. economy to grow 1.7% in 2025, down from a projection of 2.1% GDP growth back in December. Regarding inflation, the Committee ratcheted higher its core inflation (PCE) expectation to 2.8% this year from 2.5% in December. The combination of lower expected GDP growth and higher expected inflation implied by the updated dot-plot is likely to continue to further the stagflation narrative making the rounds of late and could potentially keep some upward pressure on long-term Treasury yields in the coming months. While the updated dot-plot garnered the bulk of the headlines, the FOMC also announced an adjustment to the pace of balance sheet runoff or quantitative tightening (QT) last week and starting April 1st will allow just $5B of Treasuries to run off its balance sheet per month, down from $25B per month previously. Mortgage- backed securities (MBS) holdings will still run down at a $35B per month pace, although it’s notable that rarely has there been that much volume of MBS maturing in a given month. A slower pace of QT and an additional $20B of buying power for newly issued Treasuries each month could act as an offset and help keep a lid on yields.
Further Signs Of A Cooling Labor Market In Initial, Continuing Jobless Claims Data. Initial jobless claims for the week ended March 15 rose 223k, slightly below the 224k estimate, while continuing jobless claims for the week ended March 8 came in at 1,892k, modestly above the 1,887k estimate and the 1,870k figure from the prior week. All told, initial and continuing claims show continued cooling in the labor market, but these datapoints are likely to come under greater scrutiny from economists and market participants in the coming months as both cohorts look for signs that layoffs at the federal level, and in the private sector for that matter, are increasing and showing up in the claims data in a material way.
IMPORTANT DISCLOSURES: THIS PUBLICATION HAS BEEN PREPARED BY THE STAFF OF HIGHLAND ASSOCIATES, INC. FOR DISTRIBUTION TO, AMONG OTHERS, HIGHLAND ASSOCIATES, INC. CLIENTS. HIGHLAND ASSOCIATES IS REGISTERED WITH THE UNITED STATES SECURITY AND EXCHANGE COMMISSION UNDER THE INVESTMENT ADVISORS ACT OF 1940. HIGHLAND ASSOCIATES IS A WHOLLY OWNED SUBSIDIARY OF REGIONS BANK, WHICH IN TURN IS A WHOLLY OWNED SUBSIDIARY OF REGIONS FINANCIAL CORPORATION. RESEARCH SERVICES ARE PROVIDED THROUGH MULTI-ASSET SOLUTIONS, A DEPARTMENT OF THE REGIONS ASSET MANAGEMENT BUSINESS GROUP WITHIN REGIONS BANK. THE INFORMATION AND MATERIAL CONTAINED HEREIN IS PROVIDED SOLELY FOR GENERAL INFORMATION PURPOSES ONLY. TO THE EXTENT THESE MATERIALS REFERENCE REGIONS BANK DATA, SUCH MATERIALS ARE NOT INTENDED TO BE REFLECTIVE OR INDICATIVE OF, AND SHOULD NOT BE RELIED UPON AS, THE RESULTS OF OPERATIONS, FINANCIAL CONDITIONS OR PERFORMANCE OF REGIONS BANK. UNLESS OTHERWISE SPECIFICALLY STATED, ANY VIEWS, OPINIONS, ANALYSES, ESTIMATES AND STRATEGIES, AS THE CASE MAY BE (“VIEWS”), EXPRESSED IN THIS CONTENT ARE THOSE OF THE RESPECTIVE AUTHORS AND SPEAKERS NAMED IN THOSE PIECES AND MAY DIFFER FROM THOSE OF REGIONS BANK AND/OR OTHER REGIONS BANK EMPLOYEES AND AFFILIATES. VIEWS AND ESTIMATES CONSTITUTE OUR JUDGMENT AS OF THE DATE OF THESE MATERIALS, ARE OFTEN BASED ON CURRENT MARKET CONDITIONS, AND ARE SUBJECT TO CHANGE WITHOUT NOTICE. ANY EXAMPLES USED ARE GENERIC, HYPOTHETICAL AND FOR ILLUSTRATION PURPOSES ONLY. ANY PRICES/QUOTES/STATISTICS INCLUDED HAVE BEEN OBTAINED FROM SOURCES BELIEVED TO BE RELIABLE, BUT HIGHLAND ASSOCIATES, INC. DOES NOT WARRANT THEIR COMPLETENESS OR ACCURACY. THIS INFORMATION IN NO WAY CONSTITUTES RESEARCH AND SHOULD NOT BE TREATED AS SUCH. THE VIEWS EXPRESSED HEREIN SHOULD NOT BE CONSTRUED AS INDIVIDUAL INVESTMENT ADVICE FOR ANY PARTICULAR PERSON OR ENTITY AND ARE NOT INTENDED AS RECOMMENDATIONS OF PARTICULAR SECURITIES, FINANCIAL INSTRUMENTS, STRATEGIES OR BANKING SERVICES FOR A PARTICULAR PERSON OR ENTITY. THE NAMES AND MARKS OF OTHER COMPANIES OR THEIR SERVICES OR PRODUCTS MAY BE THE TRADEMARKS OF THEIR OWNERS AND ARE USED ONLY TO IDENTIFY SUCH COMPANIES OR THEIR SERVICES OR PRODUCTS AND NOT TO INDICATE ENDORSEMENT, SPONSORSHIP, OR OWNERSHIP BY REGIONS OR HIGHLAND ASSOCIATES. EMPLOYEES OF HIGHLAND ASSOCIATES, INC., MAY HAVE POSITIONS IN SECURITIES OR THEIR DERIVATIVES THAT MAY BE MENTIONED IN THIS REPORT. ADDITIONALLY, HIGHLAND’S CLIENTS AND COMPANIES AFFILIATED WITH HIGHLAND ASSOCIATES MAY HOLD POSITIONS IN THE MENTIONED COMPANIES IN THEIR PORTFOLIOS OR STRATEGIES. THIS MATERIAL DOES NOT CONSTITUTE AN OFFER OR AN INVITATION BY OR ON BEHALF OF HIGHLAND ASSOCIATES TO ANY PERSON OR ENTITY TO BUY OR SELL ANY SECURITY OR FINANCIAL INSTRUMENT OR ENGAGE IN ANY BANKING SERVICE. NOTHING IN THESE MATERIALS CONSTITUTES INVESTMENT, LEGAL, ACCOUNTING OR TAX ADVICE. NON-DEPOSIT PRODUCTS INCLUDING INVESTMENTS, SECURITIES, MUTUAL FUNDS, INSURANCE PRODUCTS, CRYPTO ASSETS AND ANNUITIES: ARE NOT FDIC-INSURED I ARE NOT A DEPOSIT I MAY GO DOWN IN VALUE I ARE NOT BANK GUARANTEED I ARE NOT INSURED BY ANY FEDERAL GOVERNMENT AGENCY I ARE NOT A CONDITION OF ANY BANKING ACTIVITY.
NEITHER REGIONS BANK NOR REGIONS ASSET MANAGEMENT (COLLECTIVELY, “REGIONS”) ARE REGISTERED MUNICIPAL ADVISORS NOR PROVIDE ADVICE TO MUNICIPAL ENTITIES OR OBLIGATED PERSONS WITH RESPECT TO MUNICIPAL FINANCIAL PRODUCTS OR THE ISSUANCE OF MUNICIPAL SECURITIES (INCLUDING REGARDING THE STRUCTURE, TIMING, TERMS AND SIMILAR MATTERS CONCERNING MUNICIPAL FINANCIAL PRODUCTS OR MUNICIPAL SECURITIES ISSUANCES) OR ENGAGE IN THE SOLICITATION OF MUNICIPAL ENTITIES OR OBLIGATED PERSONS FOR SUCH SERVICES. WITH RESPECT TO THIS PRESENTATION AND ANY OTHER INFORMATION, MATERIALS OR COMMUNICATIONS PROVIDED BY REGIONS, (A) REGIONS IS NOT RECOMMENDING AN ACTION TO ANY MUNICIPAL ENTITY OR OBLIGATED PERSON, (B) REGIONS IS NOT ACTING AS AN ADVISOR TO ANY MUNICIPAL ENTITY OR OBLIGATED PERSON AND DOES NOT OWE A FIDUCIARY DUTY PURSUANT TO SECTION 15B OF THE SECURITIES EXCHANGE ACT OF 1934 TO ANY MUNICIPAL ENTITY OR OBLIGATED PERSON WITH RESPECT TO SUCH PRESENTATION, INFORMATION, MATERIALS OR COMMUNICATIONS, (C) REGIONS IS ACTING FOR ITS OWN INTERESTS, AND (D) YOU SHOULD DISCUSS THIS PRESENTATION AND ANY SUCH OTHER INFORMATION, MATERIALS OR COMMUNICATIONS WITH ANY AND ALL INTERNAL AND EXTERNAL ADVISORS AND EXPERTS THAT YOU DEEM APPROPRIATE BEFORE ACTING ON THIS PRESENTATION OR ANY SUCH OTHER INFORMATION, MATERIALS OR COMMUNICATIONS.
SOURCE: BLOOMBERG INDEX SERVICES LIMITED. BLOOMBERG® IS A TRADEMARK AND SERVICE MARK OF BLOOMBERG FINANCE L.P. AND ITS AFFILIATES (COLLECTIVELY “BLOOMBERG”). BARCLAYS® IS A TRADEMARK AND SERVICE MARK OF BARCLAYS BANK PLC (COLLECTIVELY WITH ITS AFFILIATES, “BARCLAYS”), USED UNDER LICENSE. BLOOMBERG OR BLOOMBERG’S LICENSORS, INCLUDING BARCLAYS, OWN ALL PROPRIETARY RIGHTS IN THE BLOOMBERG BARCLAYS INDICES. NEITHER BLOOMBERG NOR BARCLAYS APPROVES OR ENDORSES THIS MATERIAL OR GUARANTEES THE ACCURACY OR COMPLETENESS OF ANY INFORMATION HEREIN, OR MAKES ANY WARRANTY, EXPRESS OR IMPLIED, AS TO THE RESULTS TO BE OBTAINED THEREFROM AND, TO THE MAXIMUM EXTENT ALLOWED BY LAW, NEITHER SHALL HAVE ANY LIABILITY OR RESPONSIBILITY FOR INJURY OR DAMAGES ARISING IN CONNECTION THEREWITH.