Stocks: An Early Week Rally Stateside Fades, But Breadth Remains A Reason For Optimism; No Resolution To The S&P 500’s Multi-Month Trading Range; New Highs Abound Abroad As International Outperformance Persists.
Download Weekly Market Commentary | March 2 2026
What We’re Watching:
- The Institute for Supply Management (ISM) Services index for February is released Wednesday with the reading expected to fall slightly to 53.5 from 53.8 last month. A reading above 50 indicates expansion or growth, while a reading below 50 is indicative of contraction.
- The February nonfarm payrolls report is released Friday with the consensus estimate calling for 60k jobs to have been created during the month, which compares to the 130k reading from January. Average hourly earnings are expected to have risen 0.3% month over month, and the unemployment rate is expected to remain at 4.3% in February.
- January retail sales are released on Friday, with control group sales expected to have risen 0.3% during the month. This reading is worth watching as a more recent lens into the health of the U.S. consumer.
Key Observations
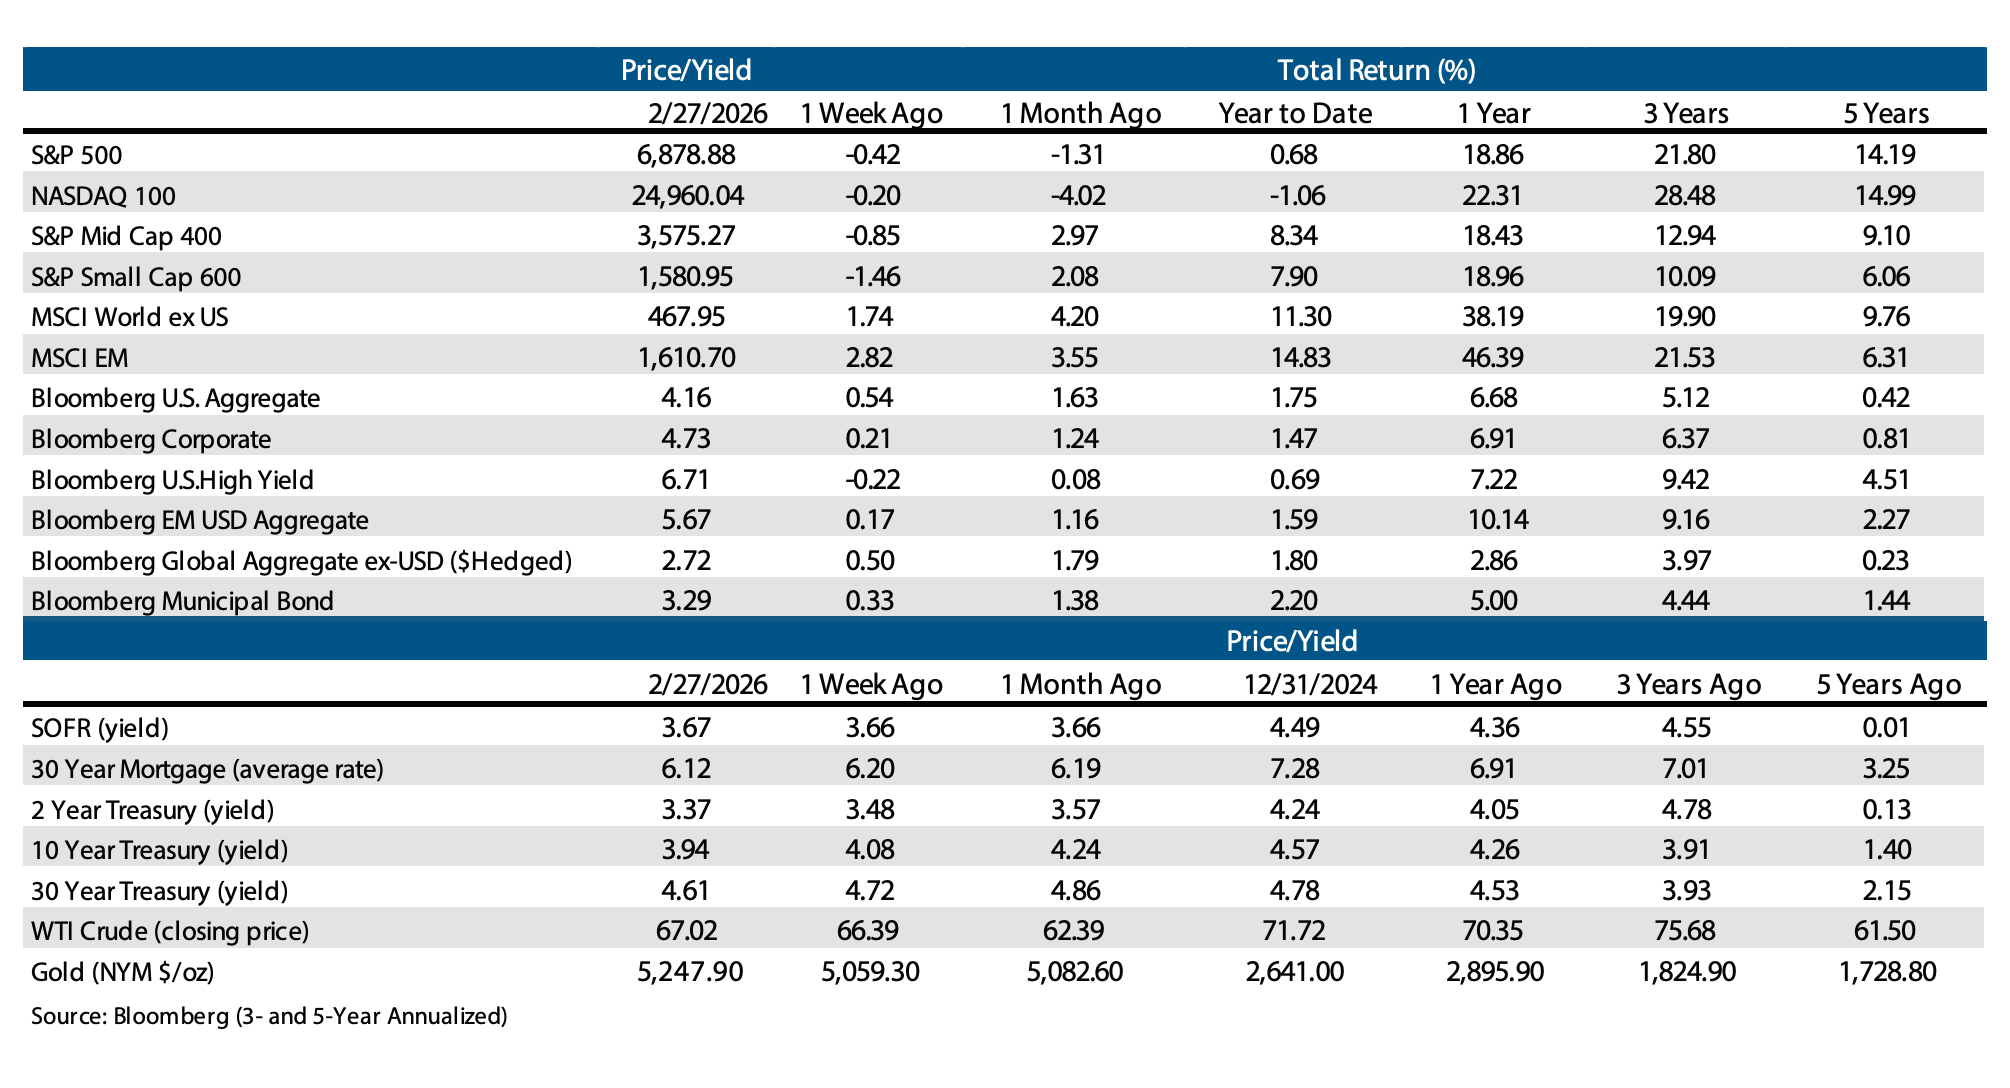
- The S&P 500 fell 0.4% on the week, but under the surface breadth remains encouraging with the equally weighted S&P 500 outperforming the market capitalization weighted index on the week. From a sector perspective, classically defensive areas such as consumer staples, health care, and utilities fared best on a relative basis, but communication services and materials also outperformed. The information technology sector sold off in the wake of Nvidia’s earnings release as capital was rotated into beleaguered software names.
- International equity markets continued to perform well on a relative basis, with emerging markets outpacing developed markets due to strength out of South Africa, South Korea, and Taiwan, among others. On the developed markets front, Japan and the U.K. were standout performers but gains were notably broad based.
- Bond bulls remained in control with yields falling across the Treasury curve on the week as investors sought safety in less volatile assets amid a backdrop of elevated uncertainty. The U.S. dollar index, or DXY, ended the week unchanged, which is notable given the sharp downdraft in Treasury yields. To us, this is evidence that the move lower in yields has largely been driven by portfolio de-risking on geopolitical angst and fears surrounding underwriting in the private credit space, not eco- nomic growth concerns. The move lower in yields could reverse once investors get clarity or comfort on either of these fronts.
What Happened Last Week:
Stocks: An Early Week Rally Stateside Fades, But Breadth Remains A Reason For Optimism; No Resolution To The S&P 500’s Multi-Month Trading Range; New Highs Abound Abroad As International Outperformance Persists.
Early-Week Rally Fades As Negative Headlines Roll In, But Breadth, Sector Leadership Profile Are Reasons To Remain Constructive. The S&P 500 was in rally mode early last week in the lead-up to Nvidia’s earnings after the market close on Wednesday, but the index gave ground with semiconductors being sold despite the company posting results and issuing guidance that surpassed the consensus estimate for sales and earnings. While the headline S&P 500 index fell 0.4% on the week, under the surface there were some positive developments that leave us cautiously constructive. The equally weighted S&P 500 posted a 0.4% weekly gain, outperforming the market cap weighted S&P 500 by 0.8% on the week, an indicator that weakness was largely in the biggest stocks by market capitalization.
Sector leadership favored classically defensive sectors such as consumer staples, health care, and utilities, which outperformed the broader index, but communication services and materials also can make the same claim. To us, this is further evidence that capital continues to rotate, not completely move out of U.S. equities, and despite a flurry of worrisome geopolitical headlines and February’s reputation as a challenging month for stocks, the S&P 500 has failed to break lower, which can be interpreted in several ways depending on one’s perspective.
Semis See Profit Taking As Capital Rotates Into Software Fol- lowing Nvidia’s Earnings. Semiconductor stocks, specifically, and technology hardware names broadly garnered sizable inflows earlier this year, propelling the S&P 500 semiconductor and semiconductor equipment industry group to an 8.7% year-to-date gain through last Wednesday. The rally in hardware names stands in stark contrast to the 20%-plus year-to-date drop in the S&P 500 software and services industry group through the middle of last week. The semiconductor surge and software’s slide had stretched the historical relationship between the two industry groups to an extreme. In hindsight, rotation and mean reversion in favor of software on a relative basis was more of a ‘when,’ not ‘if’ proposition. That’s what materialized after Nvidia’s release Wednesday as the S&P 500 software industry outpaced the S&P 500 semiconductor industry group by 6.2% on Thursday and Friday alone, with potentially more room for that relationship to normalize in the coming week(s). The push/pull between semiconductors and software has weighed on the broader S&P 500 year-to-date, with the index rising just 0.6% while the S&P Midcap 400 and S&P Small Cap 600 have gained 8.3% and 7.9%, respectively, as those indices have benefitted from far less exposure to technology stocks. While we are optimistic that the S&P 500 will find its footing and break out to the upside in the coming months, it will likely take both semis and software moving higher to do so.
Another Week With No Resolution To The S&P 500’s Multi-Month Trading Range. The S&P 500 bottomed at 6,815 on Monday before staging a mid-week rally, ultimately peaking just above 6,950 on Wednesday in advance of Nvidia’s earnings release after market close that day. The S&P 500 has been stuck in a trading range between 6,800 and 7,000 since the end of January, and last week’s price action again presented short-term traders with an appealing setup while frustrating both bulls and bears alike. Encouragingly, the S&P 500 has continued to ‘surf’ and ride along its 100-day moving average, which now sits at 6,831. A break and weekly close below the 100-day moving average would be a notable character change for the index and market participants are monitoring potential catalysts that could influence its direction. The matter of when remains up in the air as the end of earnings season puts us in a catalyst-light spot in the calendar with few obvious reasons for the index to break out or down at present.
New Highs Abound Abroad As International Outperformance Persists. Investors seeking stability came out ahead last week amid a more volatile trading backdrop as foreign developed equities represented in the MSCI EAFE index were amongst the top performing global segments, rising 1.2%. Perhaps surprisingly given the volatility stateside, the MSCI Emerging Markets (EM) index notched a 2.8% gain on the back of strength in South Africa, South Korea, and Taiwan, specifically. Within the developed market index, Japanese equities continue to play a pivotal role as the country’s Nikkei 225 index advanced 3.6% to its third new all-time high in the last four weeks. That momentum, built on fiscal hopes, has options traders taking a more bullish stance with the Nikkei put/call ratio dipping to 1.2, its lowest level since October. European equities also delivered to a lesser degree with the Euro Stoxx 600 rising 0.8%, but also closed at a new high, capturing the broad participation in developed stocks.
Emerging markets pushed higher as persistent strength in tech-centric countries like South Korea and Taiwan helped the index overcome profit taking in trade-sensitive markets. The U.S. Supreme Court decision to strike down tariffs turned out to be a sell the news event as the decision was largely expected, but the selling pressure last week was centered around China and India as equity indices tied to both countries were lower by more than 2% last week. In China, specifically, AI disruption concerns are creeping in akin to what we’ve seen stateside as communication services behemoth Tencent and online retailer Alibaba slumped. Those struggles translated to neighboring India as well with information technology stocks seeing broad weakness and communication services trending lower.
Bonds: Longer Duration Bonds Well Bid Amid Heightened Geopolitical, Trade Uncertainty; Still Only Modest Signs Of Stress In Corporate Credit Even As Worrisome Private Credit Headlines Continue To Roll In.
Bond Bulls In Control As Uncertainty Generates A Bid For Safety. U.S. Treasury yields continued to trade with a downward bias over the balance of the week with the 10-year yield falling another 14- basis points on the week to close at 3.94% – its first sub-4% close since the holiday-shortened trading day before Thanksgiving. Long bonds benefitted from trade uncertainty stemming from the Supreme Court’s verdict in the prior week to strike down the bulk of U.S. tariffs currently in place, a decision that called into question whether trade deals agreed upon in the past year but not yet ratified would ultimately be honored. President Trump’s pivot to 10% tariffs across the board in the aftermath of the decision proved short lived as he raised that figure to 15% over the weekend, leading market participants to revisit their economic growth outlook.
Beyond tariff/trade uncertainty, talks between the U.S. and Iran progressed at a painfully slow pace for market participants, and have so far resulted in no agreement, contributing to upward pressure on crude oil prices and a persistent ‘safe haven’ bid under longer-term U.S. government bonds. The rally in long-dated U.S. Treasuries has been a result of de-risking and a flight to safety, in our view, a position reinforced by stability in the U.S. dollar, which continues to carve out a base of support. If the dollar was weakening as Treasury yields fell, we would likely attribute that to concerns surrounding economic growth, but that has not yet been the case. Given our constructive outlook on the U.S. economy, and belief that inflationary pressures will only gradually ease, we would expect yields on long-term Treasuries to rise as geopolitical angst and trade uncertainty subside, and as a result we see the break below 4% on the 10-year yield as likely short lived.
High Yield Credit Spreads Leak Wider As Private Credit Concerns Build. Corporate credit diverged last week as tailwinds from falling Treasury yields lifted investment grade bonds, with the Bloomberg Corporate Bond Index rising 0.2%, while the Bloomberg Corporate High Yield index fell by 0.2% as investors required modestly higher yields to hold lower quality corporate bonds. The turmoil surrounding private credit and business development companies (BDCs) spilled over and fed into credit market volatility last week as a handful of funds/sponsors cut their dividends amid declining rates and higher anticipated loan losses. Stress in credit markets was evident in valuations as the option-adjusted spread (OAS) on the Bloomberg U.S. Corporate High Yield index widened to 282bps on Thursday, a new year-to-date high, and that sentiment echoed in the swap market as the Markit HY CDX 5Y index experienced its largest weekly spike since October. That move suggests market participants are buying more protection as software concerns plaguing private credit are beginning to weigh on publicly traded securities. From our perspective, a trend is taking shape in corporate credit as high yield valuations are making a series of higher highs and higher lows, prompting discussion about how credit spreads might behave going forward.
IMPORTANT DISCLOSURES: THIS PUBLICATION HAS BEEN PREPARED BY THE STAFF OF HIGHLAND ASSOCIATES, INC. FOR DISTRIBUTION TO, AMONG OTHERS, HIGHLAND ASSOCIATES, INC. CLIENTS. HIGHLAND ASSOCIATES IS REGISTERED WITH THE UNITED STATES SECURITY AND EXCHANGE COMMISSION UNDER THE INVESTMENT ADVISORS ACT OF 1940. HIGHLAND ASSOCIATES IS A WHOLLY OWNED SUBSIDIARY OF REGIONS BANK, WHICH IN TURN IS A WHOLLY OWNED SUBSIDIARY OF REGIONS FINANCIAL CORPORATION. RESEARCH SERVICES ARE PROVIDED THROUGH MULTI-ASSET SOLUTIONS, A DEPARTMENT OF THE REGIONS ASSET MANAGEMENT BUSINESS GROUP WITHIN REGIONS BANK. THE INFORMATION AND MATERIAL CONTAINED HEREIN IS PROVIDED SOLELY FOR GENERAL INFORMATION PURPOSES ONLY. TO THE EXTENT THESE MATERIALS REFERENCE REGIONS BANK DATA, SUCH MATERIALS ARE NOT INTENDED TO BE REFLECTIVE OR INDICATIVE OF, AND SHOULD NOT BE RELIED UPON AS, THE RESULTS OF OPERATIONS, FINANCIAL CONDITIONS OR PERFORMANCE OF REGIONS BANK. UNLESS OTHERWISE SPECIFICALLY STATED, ANY VIEWS, OPINIONS, ANALYSES, ESTIMATES AND STRATEGIES, AS THE CASE MAY BE (“VIEWS”), EXPRESSED IN THIS CONTENT ARE THOSE OF THE RESPECTIVE AUTHORS AND SPEAKERS NAMED IN THOSE PIECES AND MAY DIFFER FROM THOSE OF REGIONS BANK AND/OR OTHER REGIONS BANK EMPLOYEES AND AFFILIATES. VIEWS AND ESTIMATES CONSTITUTE OUR JUDGMENT AS OF THE DATE OF THESE MATERIALS, ARE OFTEN BASED ON CURRENT MARKET CONDITIONS, AND ARE SUBJECT TO CHANGE WITHOUT NOTICE. ANY EXAMPLES USED ARE GENERIC, HYPOTHETICAL AND FOR ILLUSTRATION PURPOSES ONLY. ANY PRICES/QUOTES/STATISTICS INCLUDED HAVE BEEN OBTAINED FROM SOURCES BELIEVED TO BE RELIABLE, BUT HIGHLAND ASSOCIATES, INC. DOES NOT WARRANT THEIR COMPLETENESS OR ACCURACY. THIS INFORMATION IN NO WAY CONSTITUTES RESEARCH AND SHOULD NOT BE TREATED AS SUCH. THE VIEWS EXPRESSED HEREIN SHOULD NOT BE CONSTRUED AS INDIVIDUAL INVESTMENT ADVICE FOR ANY PARTICULAR PERSON OR ENTITY AND ARE NOT INTENDED AS RECOMMENDATIONS OF PARTICULAR SECURITIES, FINANCIAL INSTRUMENTS, STRATEGIES OR BANKING SERVICES FOR A PARTICULAR PERSON OR ENTITY. THE NAMES AND MARKS OF OTHER COMPANIES OR THEIR SERVICES OR PRODUCTS MAY BE THE TRADEMARKS OF THEIR OWNERS AND ARE USED ONLY TO IDENTIFY SUCH COMPANIES OR THEIR SERVICES OR PRODUCTS AND NOT TO INDICATE ENDORSEMENT, SPONSORSHIP, OR OWNERSHIP BY REGIONS OR HIGHLAND ASSOCIATES. EMPLOYEES OF HIGHLAND ASSOCIATES, INC., MAY HAVE POSITIONS IN SECURITIES OR THEIR DERIVATIVES THAT MAY BE MENTIONED IN THIS REPORT. ADDITIONALLY, HIGHLAND’S CLIENTS AND COMPANIES AFFILIATED WITH HIGHLAND ASSOCIATES MAY HOLD POSITIONS IN THE MENTIONED COMPANIES IN THEIR PORTFOLIOS OR STRATEGIES. THIS MATERIAL DOES NOT CONSTITUTE AN OFFER OR AN INVITATION BY OR ON BEHALF OF HIGHLAND ASSOCIATES TO ANY PERSON OR ENTITY TO BUY OR SELL ANY SECURITY OR FINANCIAL INSTRUMENT OR ENGAGE IN ANY BANKING SERVICE. NOTHING IN THESE MATERIALS CONSTITUTES INVESTMENT, LEGAL, ACCOUNTING OR TAX ADVICE. NON-DEPOSIT PRODUCTS INCLUDING INVESTMENTS, SECURITIES, MUTUAL FUNDS, INSURANCE PRODUCTS, CRYPTO ASSETS AND ANNUITIES: ARE NOT FDIC-INSURED I ARE NOT A DEPOSIT I MAY GO DOWN IN VALUE I ARE NOT BANK GUARANTEED I ARE NOT INSURED BY ANY FEDERAL GOVERNMENT AGENCY I ARE NOT A CONDITION OF ANY BANKING ACTIVITY.
NEITHER REGIONS BANK NOR REGIONS ASSET MANAGEMENT (COLLECTIVELY, “REGIONS”) ARE REGISTERED MUNICIPAL ADVISORS NOR PROVIDE ADVICE TO MUNICIPAL ENTITIES OR OBLIGATED PERSONS WITH RESPECT TO MUNICIPAL FINANCIAL PRODUCTS OR THE ISSUANCE OF MUNICIPAL SECURITIES (INCLUDING REGARDING THE STRUCTURE, TIMING, TERMS AND SIMILAR MATTERS CONCERNING MUNICIPAL FINANCIAL PRODUCTS OR MUNICIPAL SECURITIES ISSUANCES) OR ENGAGE IN THE SOLICITATION OF MUNICIPAL ENTITIES OR OBLIGATED PERSONS FOR SUCH SERVICES. WITH RESPECT TO THIS PRESENTATION AND ANY OTHER INFORMATION, MATERIALS OR COMMUNICATIONS PROVIDED BY REGIONS, (A) REGIONS IS NOT RECOMMENDING AN ACTION TO ANY MUNICIPAL ENTITY OR OBLIGATED PERSON, (B) REGIONS IS NOT ACTING AS AN ADVISOR TO ANY MUNICIPAL ENTITY OR OBLIGATED PERSON AND DOES NOT OWE A FIDUCIARY DUTY PURSUANT TO SECTION 15B OF THE SECURITIES EXCHANGE ACT OF 1934 TO ANY MUNICIPAL ENTITY OR OBLIGATED PERSON WITH RESPECT TO SUCH PRESENTATION, INFORMATION, MATERIALS OR COMMUNICATIONS, (C) REGIONS IS ACTING FOR ITS OWN INTERESTS, AND (D) YOU SHOULD DISCUSS THIS PRESENTATION AND ANY SUCH OTHER INFORMATION, MATERIALS OR COMMUNICATIONS WITH ANY AND ALL INTERNAL AND EXTERNAL ADVISORS AND EXPERTS THAT YOU DEEM APPROPRIATE BEFORE ACTING ON THIS PRESENTATION OR ANY SUCH OTHER INFORMATION, MATERIALS OR COMMUNICATIONS.
SOURCE: BLOOMBERG INDEX SERVICES LIMITED. BLOOMBERG® IS A TRADEMARK AND SERVICE MARK OF BLOOMBERG FINANCE L.P. AND ITS AFFILIATES (COLLECTIVELY “BLOOMBERG”). BARCLAYS® IS A TRADEMARK AND SERVICE MARK OF BARCLAYS BANK PLC (COLLECTIVELY WITH ITS AFFILIATES, “BARCLAYS”), USED UNDER LICENSE. BLOOMBERG OR BLOOMBERG’S LICENSORS, INCLUDING BARCLAYS, OWN ALL PROPRIETARY RIGHTS IN THE BLOOMBERG BARCLAYS INDICES. NEITHER BLOOMBERG NOR BARCLAYS APPROVES OR ENDORSES THIS MATERIAL OR GUARANTEES THE ACCURACY OR COMPLETENESS OF ANY INFORMATION HEREIN, OR MAKES ANY WARRANTY, EXPRESS OR IMPLIED, AS TO THE RESULTS TO BE OBTAINED THEREFROM AND, TO THE MAXIMUM EXTENT ALLOWED BY LAW, NEITHER SHALL HAVE ANY LIABILITY OR RESPONSIBILITY FOR INJURY OR DAMAGES ARISING IN CONNECTION THEREWITH.