Stocks: Continued Signs of Rotation, Both Within The S&P 500 And The ‘Magnificent 7;’ Sharp Rise In Treasury Yields Leads To Profit Taking In Small Caps; More Room To Run For Energy Stocks?
Download Weekly Market Commentary | March 18 2024
What We’re Watching:
- The Federal Open Market Committee (FOMC) will conclude its two-day monetary policy meeting on Wednesday with Chair Jerome Powell’s post-meeting press conference to follow. The FOMC isn’t expected to adjust the Fed funds rate at this meeting, but will issue an updated summary of economic projections, or dot-plot, which will be monitored and dissected, with particular attention paid to Committee members’ expectations for the neutral funds rate in 2025 and beyond.
- U.S. Manufacturing and Services PMI’s (Purchasing Managers Index) for February are released Thursday. Manufacturing PMI is expected to fall to 51.8 from 52.2 in January, while Services PMI is also expected to fall to 52.0 from 52.3 the prior month. A reading above 50 indicates growth or expansion, while a reading below 50 indicates contraction.
- Japan’s Consumer Price Index (CPI) for February is released Thursday with year over year core inflation excluding fresh food and energy expected to rise 2.9%, down from the 3.5% reading in January. Headline CPI is also expected to rise 2.9% year over year, a sizable jump from the 2.2% reading from January. The Bank of Japan (BoJ) is widely expected to alter its yield curve control program and potentially scrap its negative interest rate policy (NIRP) prior to this release, but the trend in Japanese inflation is still worth watching as it will inform just how aggressive the BoJ might need to be in tightening monetary policy. A BoJ policy shift could lead to further strength in the Japanese yen, higher yields on Japanese Government Bonds, and volatility with potential downside in Japanese equities over the near- term.
Key Observations
- Small cap stocks trail as rising Treasury yields and continued strength in the labor market spur profit taking, but fundamentals are improving as U.S. economic growth drives profit growth. Small and mid-cap (SMid) stocks have been revalued lower as expectations for rate cuts have been recalibrated in recent months, with fewer cuts expected over the balance of this year. This backdrop leaves us more constructive on small and mid-cap (SMid) stocks over the balance of this year, with an improving economic growth outlook and an uptick in M&A activity tailwinds.
- Stocks shrugged off a warmer than expected February Consumer Price Index (CPI) reading but were unable to ignore a hotter reading on wholesale prices (PPI) later in the week. Wholesale prices (PPI) flow through to finished goods prices with a lag, and as a result market participants ratcheted expectations for rate cuts over coming months lower. On the heels of the CPI and PPI releases, Fed funds futures shifted and view the likelihood of a 25-basis point rate cut in June as a coin- flip down from just shy of 70% the prior week.
- February Consumer Price Index (CPI) and Producer Price Index (PPI) came in above expectations, pointing toward upward pressure on prices of both goods and services persisting. A backdrop of above trent economic growth and stickier inflation is likely to favor stocks relative to bonds over the near- term, but both asset classes could see heightened volatility in the coming weeks.
What Happened Last Week:
Stocks: Continued Signs of Rotation, Both Within The S&P 500 And The ‘Magnificent 7;’ Sharp Rise In Treasury Yields Leads To Profit Taking In Small Caps; More Room To Run For Energy Stocks?
Capital Rotating Both Within The ‘Magnificent 7’ And Between Tech And Economically Sensitive Sectors: Signs of sector rotation have become evident over the past month and were again present over the balance of last week. Capital has made its way out of some of the ‘Magnificent 7’ and has found a home in cheaper, economically sensitive sectors such as energy, financial services, and materials, among others. Notably, while both the communication services and information technology sectors have lagged the S&P 500 over the past month, it’s not lost on us that both sectors have still outperformed the index year-to-date after posting double-digit returns up to this point in the year. Judging by last week’s price action, investors continue to view even the smallest of pullbacks in some select names within the ‘Magnificent 7’ as a buying opportunity and it doesn’t appear as though this cohort of stocks is going to cede its leadership position without putting up a fight.
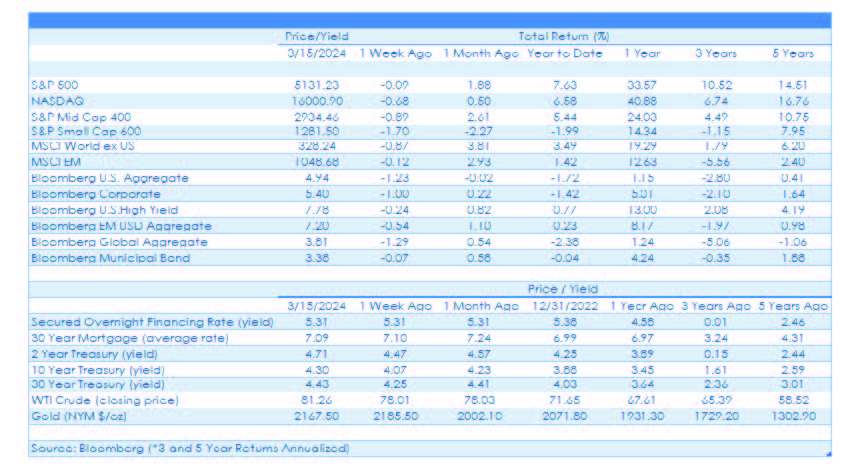
Small Cap Momentum Stalls As Treasury Yields Rise Sharply On The Week: The sharp rise in Treasury yields in the back- half of last week led to profit taking in smaller capitalization stocks and pulled the S&P 600 lower by 1.7% on the week. Small caps rallied in February as falling Treasury yields and labor market data pointing toward a modest cooling/ loosening of the jobs market provided a tailwind. But some of that momentum appeared to have been lost last week as hotter February inflation data put upward pressure on yields and a sharp drop in initial and continuing jobless claims called into question whether the labor market was indeed cooling.
Energy Stocks Jump As Crude Oil, Gasoline Inventories Fall More Than Expected: The S&P 500 energy sector posted a 3.8% weekly gain as West Texas Intermediate (WTI) crude oil closed above $81 per barrel for the first time since November as crude oil and gasoline inventories came in well below estimates. A seasonally strong period for crude and gasoline prices into the spring/summer travel season is just starting, and with inventories already tight, upward pressure on prices of both could persist, providing a further boost to energy-related equities. The energy sector has quietly moved its way into the 3rd spot year-to-date among S&P 500 sectors, trailing only communication services and information technology, and the necessary ingredients may be in place for the sector to continue its climb up the leaderboard into the summer months
Improved Technical Setup for Chinese Stocks, But Reasons for Skepticism Remain: The MSCI China index has stabilized in recent weeks and turned out a 2.7% weekly gain last week, a move likely to get the attention of investors. The index reached a high-water mark for 2024 last week with leadership centered around embattled communication services and consumer discretionary names, which are the two largest sectors in the MSCI China Index. While last week’s strength resulted in a break above the index’s 100-day moving average for the first time since November, it remains to be seen if this will end up being a floor of support and launchpad for additional gains or a barrier capping upside. Gains since the year began have been primarily a result of fiscal intervention, but market participants do appear more willing to view the combination of stimulus, restrictions on short positions, and the latest rollback of renewable energy limits as incremental positives. Notably, last week, one of China’s leading economic officials visited the headquarters of Baidu and Naura Technology, a move that has historically preceded support for the country’s national champions. Targeted fiscal support for key industries appears more likely than sweeping stimulus in China given Xi Jinping’s focus on equality within the country, but there are no quick fixes, and we see reasons to maintain a cautious outlook on Chinese stocks.
Bonds: February Inflation Data Puts Upward Pressure On Treasury Yields; Inflation Readings Unlikely To Alter The Path Forward For The Fed; Treasury Auctions Paint A Decidedly Mixed Demand Picture.
Bond Rally Reserves Course As Hot February Inflation Readings Roll In: Yields were higher across the Treasury curve last week as the February Consumer Price Index (CPI) came in warmer than the consensus expected, registering 3.2% on headline and 3.8% on core year-over-year, both 0.1% ahead of the consensus estimate. Duration sensitive sectors were hardest hit with the Bloomberg Corporate Bond index falling 1% after gaining ground in each of the prior three weeks. Equity markets initially shrugged off the CPI report, but the rates market appeared far more jittery leading up to the release of the February Producer Price Inflation (PPI) on Thursday, a release that also surprised to the upside and led to a more pronounced selloff in Treasuries which was accompanied by a pullback in stocks as well.
February Inflation Data Unlikely To Alter The Path Forward For The Fed: On the heels of the hotter than expected February CPI and PPI readings, Fed funds futures shifted meaningfully over the balance of last week. Entering the week, the futures market placed the odds of a 25-basis point rate cut in June at around 70%, but after the inflation readings adjusted and ended the week viewing the prospect of a June cut as little more than a coin-flip. What’s most interesting to us is that with the likelihood of a June cut falling, Fed funds futures didn’t shift the first quarter-point cut to July, the market pushed it all the way to September, implying it expects hotter readings in the coming months as well. Notably, while the futures market has greatly lowered the odds of a rate cut in June, it still expects either two or three 25-basis point cuts through year-end. Two or three cuts remains our base case as well, but we would still put the likelihood of a June cut at greater than 50% and above where the market is currently priced as the pendulum may have swung too far to the hawkish camp on the heels of the February CPI and PPI.
Our Takeaways From Last Week’s Treasury Auctions: The U.S. Treasury auctioned $39B of 10-year notes last Tuesday and followed that up by issuing $22B of 30-year paper the following day. The 10-year issue wasn’t well received as the dealer community took down a larger percentage of the offering relative to recent auctions, while indirect bidders, primarily foreign central banks, took down less, and the yield ‘slipped’ to 4.166% from a few basis points below that in the primary market. Conversely, the 30-year auction on Wednesday was very well received with dealers forced to inventory a much smaller percentage of the issue relative to recent auctions and indirect bidders aggressively bidding for the issue, i.e. requiring a lower yield. On balance, the 10-year auction is evidence that market participants are finding no shortage of available options in which to deploy capital and thus require a higher yield before allocating to a specific issue. On the other hand, the robust demand from foreign central banks for the 30-year issue points to a lack of suitable investable options out there to allocate a sizable sum of capital 20+ years out on the Treasury curve. How this dynamic might impact the U.S. Treasury’s quarterly refunding announcements remains to be seen, but based upon recent auctions, a barbell approach might be more apparent with sizable issuance on both the short end and very long end of the Treasury curve, with perhaps less issuance in the belly, which could help cap how high the 10-year yield, specifically, might rise over coming quarters.
The content and any portion of this newsletter is for personal use only and may not be reprinted, sold or redistributed without the written consent of Regions Bank. Regions, the Regions logo and other Regions marks are trademarks of Regions Bank. The names and marks of other companies or their services or products may be the trademarks of their owners and are used only to identify such companies or their services or products and not to indicate endorsement or sponsorship of Regions or its services or products. The information and material contained herein is provided solely for general information purposes.
Regions does not make any warranty or representation relating to the accuracy, completeness or timeliness of any information contained in the newsletter and shall not be liable for any damages of any kind relating to such information nor as to the legal, regulatory, financial or tax implications of the matters referred herein. This material is not intended to be investment advice nor is this information intended as an offer or solicitation for the purchase or sale of any security or other financial instrument. Any opinions expressed herein are given in good faith, are subject to change without notice, and are only current as of the stated date of their issue. Regions Asset Management is a business group within Regions Bank that provides investment management services to customers of Regions Bank. Employees of Regions Asset Management may have positions in securities or their derivatives that may be mentioned in this report or in their personal accounts. Additionally, affiliated companies may hold positions in the mentioned companies in their portfolios or strategies. The companies mentioned specifically are sample companies, noted for illustrative purposes only.
The mention of the companies should not be construed as a recommendation to buy, hold or sell positions in your investment portfolio. Neither Regions Bank nor Regions Asset Management (collectively, “Regions”) are registered municipal advisors nor provide advice to municipal entities or obligated persons with respect to municipal financial products or the issuance of municipal securities (including regarding the structure, timing, terms and similar matters concerning municipal financial products or municipal securities issuances) or engage in the solicitation of municipal entities or obligated persons for such services.
With respect to this presentation and any other information, materials or communications provided by Regions, (a) Regions is not recommending an action to any municipal entity or obligated person, (b) Regions is not acting as an advisor to any municipal entity or obligated person and does not owe a fiduciary duty pursuant to Section 15 B of the Securities Exchange Act of 1934 to any municipal entity or obligated person with respect to such presentation, information, materials or communications, (c) Regions is acting for its own interests, and (d) you should discuss this presentation and any such other information, materials or communications with any and all internal and external advisors and experts that you deem appropriate before acting on this presentation or any such other information, materials or communications. Source: Bloomberg Index Services Limited. BLOOMBERG® is a trademark and service mark of Bloomberg Finance L.P. and its affiliates (collectively “Bloomberg”). BARCLAYS® is a trademark and service mark of Barclays Bank Plc (collectively with its affiliates, “Barclays”), used under license. Bloomberg or Bloomberg’s licensors, including Barclays, own all proprietary rights in the Bloomberg Barclays Indices. Neither Bloomberg nor Barclays approves or endorses this material or guarantees the accuracy or completeness of any information herein, or makes any warranty, express or implied, as to the results to be obtained therefrom and, to the maximum extent allowed by law, neither shall have any liability or responsibility for injury or damages arising in connection therewith.
Source: Bloomberg Index Services Limited. BLOOMBERG® is a trademark and service mark of Bloomberg Finance L.P. and its affiliates (collectively “Bloomberg”). BARCLAYS® is a trademark and service mark of Barclays Bank Plc (collectively with its affiliates, “Barclays”), used under license. Bloomberg or Bloomberg’s licensors, including Barclays, own all proprietary rights in the Bloomberg Barclays Indices. Neither Bloomberg nor Barclays approves or endorses this material or guarantees the accuracy or completeness of any information herein, or makes any warranty, express or implied, as to the results to be obtained therefrom and, to the maximum extent allowed by law, neither shall have any liability or responsibility for injury or damages arising in connection therewith.
The information provided herein is for informational purposes only and is intended to report on various investment views held by Multi-Asset Solutions (MAS) and Highland Associates. Opinions, estimates, forecasts, and statements of financial market trends are based on current market conditions that constitute the judgement of MAS and Highland Associates and are subject to change. The information is received from third parties, which is believed to be accurate, but no representation is made that the information provided is accurate and complete. The information is given as of the date indicated and believed to be reliable. While MAS and Highland have tried to provide accurate and timely information, there may be inadvertent technical or factual inaccuracies or typographical errors for which we apologize. The information provided herein does not constitute a solicitation or offer by Highland or its affiliates, to buy or sell any securities or other financial instrument, or to provide investment advice or service. Nothing contained herein should be construed as investment advice or a recommendation to purchase or sell a particular security. Investing involves a high degree of risk, and all investors should carefully consider their investment objective and the suitability of any investments.
Research services are provided through Multi-Asset Solutions, a department of the Regions Asset Management business group within Regions Bank. Highland is a wholly owned subsidiary of Regions Bank, which in turn is a wholly owned subsidiary of Regions Financial Corporation.
Past performance is not indicative of future results. Investments are subject to loss.