Stocks: Trade Escalation Leaves Equities In Tumult Amid Encouraging Headline Inflation Readings, But Dip Buyers Stepped In Into The Weekend; Trade, Technicals Dragging Down U.S. Growth Names; Small Caps Continue To Lag As Business Sentiment Falls Again.
Download Weekly Market Commentary | March 17 2025
What We’re Watching:
- Building Permit data from the U.S. Census Bureau is expected to be released on Tuesday, with survey estimates predicting a drop to 1,450k from last month’s 1,473k print. The headline number captures how builders see the potential economic slowdown impacting demand for housing, but the trend in more reliable single-family permits is top of mind for us after declining last month for the first time since September.
- The Federal Open Market Committee (FOMC) concludes its two-day meeting on Wednesday. The Committee is expected to leave the Fed funds rate unchanged with the lower bound remaining at 4.25% and the upper bound at 4.50%. The FOMC releases an updated Summary of Economic Projections at this meeting, otherwise known as its dot-plot, which outlines the median Committee member’s expectations surrounding the path forward for the Funds rate in the coming quarters. The updated dot-plot could prove market moving and will likely be the focus of Chair Jerome Powell’s post-meeting press conference.
- On Thursday, the Federal Reserve Bank of Philadelphia is set to publish its Business Outlook Survey Index with consensus expecting a reading of 10.0 which would be a sharp drop from 18.1 last month for the manufacturing gauge which tumbled last month after rising substantially at the end of ‘24 .
Key Observations
- Domestic equity markets are still searching for a bottom as trade policy headlines sent the S&P 500 below its 200-day moving average early in the week, with a brief reprieve from cooler inflation on Wednesday, before a technical correction brought dip buyers in just before the weekend.
- Growth and small-cap stocks bore the brunt of negative price action, with the NASDAQ declining by 3.9% on Monday alone, the worst day for the tech-heavy index since the third quarter of 2022. Sector leadership has perpetuated the preference for defensive posture with utilities leading while discretionary and communication stocks lagged.
- Benchmark U.S. Treasuries endured volatile trading conditions, in contrast to a tighter range for the dollar, with yields across the curve ending the week little changed as Friday’s equity rally generated a selloff in less risky bonds. Investment grade and high yield corporate bond yields rose as investors sought higher premiums to take on credit risk amidst forecasts for a decelerating economy stateside.
What Happened Last Week:
Stocks: Trade Escalation Leaves Equities In Tumult Amid Encouraging Headline Inflation Readings, But Dip Buyers Stepped In Into The Weekend; Trade, Technicals Dragging Down U.S. Growth Names; Small Caps Continue To Lag As Business Sentiment Falls Again.
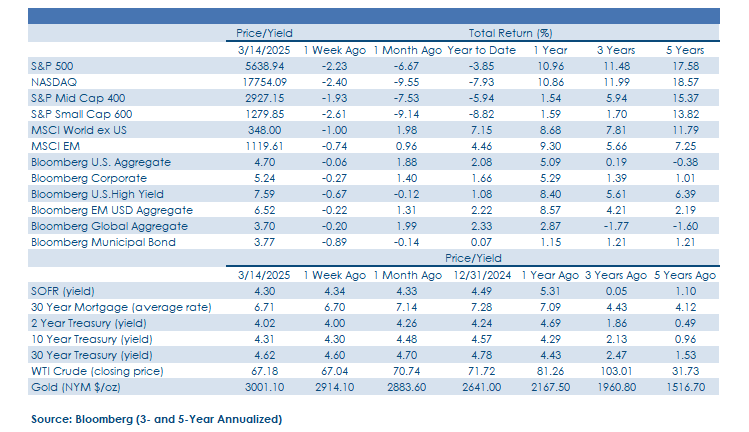
Another Down Week For U.S. Large Cap Stocks As The Bottoming Process Plays Out. The S&P 500 turned out a 2.2% weekly drop, taking its peak-to-trough drawdown since making an all-time high on February 19th to 8.5%. While the bottoming process appears to be ongoing, there were some signs last week that selling pressure may have reached an apex, at least in the near-term. The CBOE Volatility Index, or VIX, a measure of implied volatility 30- days out, peaked just below 30 on Tuesday as the S&P 500 was falling sharply, a sign that demand for hedges against a further decline in stocks is waning. With the VIX around 30, hedges become too costly to put on, thus reducing demand for downside protection which ultimately leads the VIX and implied market volatility lower, leading to rallies in the S&P 500, which is what occurred Wednesday and Friday. The VIX ‘crush’ into the weekend, with the VIX falling to 24 as hedges were taken off and stocks moved higher, is a potential sign that the S&P 500 has at least found a temporary bottom and selling pressure could be more subdued in the coming weeks, potentially inviting buyers back into the fray. It’s notable that trading volume was again elevated as the S&P 500 traded lower early last week, but volume dried up in the back-half of the week and U.S. indices were able to find their footing. We don’t want to make too much of just three days of trading, and there has certainly been significant technical damage done that will need time to repair, this could be a sign that peak pessimism is behind us and those needing to sell have done so by now. However, with trade/tariff uncertainty likely to weigh on sentiment for some time to come, we suspect any near-term bounce in U.S. stocks will be viewed by investors as a chance to sell into strength.
Large Growth Stocks Grounded Again, With Trade And Deteriorating Technicals Top Of Mind. Domestic stocks began the week on their backfoot as trade tensions between the United States and Canada weighed on the tech-heavy NASDAQ with fell 3.9% last Monday, its worst daily performance since September of 2022. Core large cap benchmarks were also subject to macro-related markdowns, even after a brief reprieve midweek on a cooler than anticipated CPI reading, as the S&P 500 declined to close at 5,611, below its 200-day moving average of 5,740. This recent bout of selling pressure capped off the fourth consecutive weekly decline, the longest stretch of negative price action dating back to the second quarter of 2022. Taking stock of the market’s recent struggles with no clear end in sight is a tough pill to swallow, but the silver lining in this scenario should be that valuations, and by extension future return expectations, are becoming more reasonable as prices fall.
Few Places To Hide As The Equal-Weighted S&P 500 Lags The Cap-Weighted Index. The equal-weighted S&P 500 fared just as poorly as the cap-weighted benchmark, dropping 2.3% on the week, while the anointed ‘Magnificent 7’ group of stocks continued to see outflows, evidenced by the Bloomberg Mag 7 Index falling 2.6% on the week. Sector leadership provided few reasons to be more constructive on U.S. indices as communication services, consumer discretionary, and information technology – which together account for 50% of the S&P 500, fell 3.5%, 3.6%, and 2.0%, respectively. On the other side of the ledger, energy and utilities – which make up a far less impactful 6% of the Index – were notable standouts in an otherwise tough tape. Interestingly, the consumer staples sector, which had outperformed the S&P 500 over the past month due to an appealing combination of defensive characteristics, and more specifically, its holdings of less economically sensitive stocks and its relatively attractive dividend yield, was a notable laggard last week as it fell 4.2% as sizable holdings such as Procter & Gamble, Walmart, and PepsiCo fell sharply on concerns surrounding margin pressures that could materialize as a result of tariffs.
Small Caps In Oversold State With Few Signs Of Optimism For Now. Stocks tied to smaller companies continued to underperform last week with the S&P Small Cap 600 declining by 2.6% as interest rates ticked higher and sentiment continued to slump after the NFIB Small Business Optimism index notched a four-month low. Within the survey, participants confirmed market fears that companies are likely to wait out tariffs, with plans for capital spending set to match a five-year low. For those keeping score, the S&P Small Cap 600 is now 17% below its all-time high from last November, but amid oversold conditions, small caps may be so beaten down that contrarians look to put some capital to work here in the coming month(s). From our perspective potential buyers should remain market- weight at present with month to date expansion in volume confirming lower prices, and little in the way momentum or positive catalysts on the horizon.
Bonds: Wider Spreads Show Investors Grappling With The Prospect Of Slowing Economic Growth; Treasury Yields Trade Wide But Settle Flat Alongside Core Bonds. February Inflation Data Encouraging On The Surface, But Likely Less Comforting For The Fed.
Treasury Yields Hold Steady As Core Bonds Made Marginal Gains. Selling pressure in equity markets translated to demand for safe-haven assets, including 10-year treasuries, as bond yields sank with risk sentiment on Monday and Thursday before closing the week near their starting yield of 4.30%. That round trip in yields left the Bloomberg Aggregate Bond index with a modest weekly loss, but investors may not be too downbeat on such a minor decline given how the equity side of portfolios performed last week. Investment grade corporates fared slightly worse, declining by 0.3% as option-adjusted spreads moved wider and demand waned as new deals last week had to pay above average concessions relative to what we’ve seen thus far in the year. Tariffs could also be playing a role here, as auto-maker Stellantis was one of the bond issuers with forced to throw debt buyers a bone in the form of higher concessions. For now, inflation break- evens on the short end look to be in a holding pattern, akin to what we’re seeing out of the growth-sensitive belly of the yield curve, waiting for further clarity on trade and its downstream impacts.
High Yield Corporate Bond Prices Under Pressure As Spreads Widen. Credit markets have largely held their own in this recent bout of volatility, until early last week when high yield spreads moved wider 19bps on Monday alone, the largest single day shift since the yen carry trade unwound late last year. Through the end of the week, option-adjusted spreads on the high yield index have moved out 57bps since the mid-February low with price declines in each of the last two weeks. Those movements depict improving valuations, but with the VIX still oscillating in the mid-to-high 20s there is room for further discounts in bond prices. Markets have grown accustomed to abrupt selloffs and near-immediate recoveries in the last two years, but recent events are more than a flash crash or one- off hedge fund unwind as the world’s largest economy is making structural shifts on trade and fiscal policy.
Details Underlying The February CPI Release Are Less Encouraging Than The Headline. The Consumer Price Index (CPI) for February was released Wednesday with headline CPI rising 0.2% month over month and 2.8% year over year, with both readings 0.1% below the consensus estimate and below the 0.5% and 3.0% readings from January. Core CPI, which is more closely watched by policymakers, rose 0.2% month over month and 3.1% year over year, with both readings also 0.1% below the consensus estimate and the 0.4% and 3.3% readings the prior month. Notably, Treasury yields rose in the wake of the release as the underlying details led market participants to ratchet higher their estimate for PCE, the Fed’s preferred inflation gauge, as declining demand forced airfares lower which was a driver of CPI falling short but won’t be a detractor from the PCE figure to be released on March 28. The February CPI release does little to alter our view that inflation remains sticky, and despite signs the U.S. economy is slowing, the FOMC is unlikely to come to the economy’s rescue any time soon as a result.
IMPORTANT DISCLOSURES: THIS PUBLICATION HAS BEEN PREPARED BY THE STAFF OF HIGHLAND ASSOCIATES, INC. FOR DISTRIBUTION TO, AMONG OTHERS, HIGHLAND ASSOCIATES, INC. CLIENTS. HIGHLAND ASSOCIATES IS REGISTERED WITH THE UNITED STATES SECURITY AND EXCHANGE COMMISSION UNDER THE INVESTMENT ADVISORS ACT OF 1940. HIGHLAND ASSOCIATES IS A WHOLLY OWNED SUBSIDIARY OF REGIONS BANK, WHICH IN TURN IS A WHOLLY OWNED SUBSIDIARY OF REGIONS FINANCIAL CORPORATION. RESEARCH SERVICES ARE PROVIDED THROUGH MULTI-ASSET SOLUTIONS, A DEPARTMENT OF THE REGIONS ASSET MANAGEMENT BUSINESS GROUP WITHIN REGIONS BANK. THE INFORMATION AND MATERIAL CONTAINED HEREIN IS PROVIDED SOLELY FOR GENERAL INFORMATION PURPOSES ONLY. TO THE EXTENT THESE MATERIALS REFERENCE REGIONS BANK DATA, SUCH MATERIALS ARE NOT INTENDED TO BE REFLECTIVE OR INDICATIVE OF, AND SHOULD NOT BE RELIED UPON AS, THE RESULTS OF OPERATIONS, FINANCIAL CONDITIONS OR PERFORMANCE OF REGIONS BANK. UNLESS OTHERWISE SPECIFICALLY STATED, ANY VIEWS, OPINIONS, ANALYSES, ESTIMATES AND STRATEGIES, AS THE CASE MAY BE (“VIEWS”), EXPRESSED IN THIS CONTENT ARE THOSE OF THE RESPECTIVE AUTHORS AND SPEAKERS NAMED IN THOSE PIECES AND MAY DIFFER FROM THOSE OF REGIONS BANK AND/OR OTHER REGIONS BANK EMPLOYEES AND AFFILIATES. VIEWS AND ESTIMATES CONSTITUTE OUR JUDGMENT AS OF THE DATE OF THESE MATERIALS, ARE OFTEN BASED ON CURRENT MARKET CONDITIONS, AND ARE SUBJECT TO CHANGE WITHOUT NOTICE. ANY EXAMPLES USED ARE GENERIC, HYPOTHETICAL AND FOR ILLUSTRATION PURPOSES ONLY. ANY PRICES/QUOTES/STATISTICS INCLUDED HAVE BEEN OBTAINED FROM SOURCES BELIEVED TO BE RELIABLE, BUT HIGHLAND ASSOCIATES, INC. DOES NOT WARRANT THEIR COMPLETENESS OR ACCURACY. THIS INFORMATION IN NO WAY CONSTITUTES RESEARCH AND SHOULD NOT BE TREATED AS SUCH. THE VIEWS EXPRESSED HEREIN SHOULD NOT BE CONSTRUED AS INDIVIDUAL INVESTMENT ADVICE FOR ANY PARTICULAR PERSON OR ENTITY AND ARE NOT INTENDED AS RECOMMENDATIONS OF PARTICULAR SECURITIES, FINANCIAL INSTRUMENTS, STRATEGIES OR BANKING SERVICES FOR A PARTICULAR PERSON OR ENTITY. THE NAMES AND MARKS OF OTHER COMPANIES OR THEIR SERVICES OR PRODUCTS MAY BE THE TRADEMARKS OF THEIR OWNERS AND ARE USED ONLY TO IDENTIFY SUCH COMPANIES OR THEIR SERVICES OR PRODUCTS AND NOT TO INDICATE ENDORSEMENT, SPONSORSHIP, OR OWNERSHIP BY REGIONS OR HIGHLAND ASSOCIATES. EMPLOYEES OF HIGHLAND ASSOCIATES, INC., MAY HAVE POSITIONS IN SECURITIES OR THEIR DERIVATIVES THAT MAY BE MENTIONED IN THIS REPORT. ADDITIONALLY, HIGHLAND’S CLIENTS AND COMPANIES AFFILIATED WITH HIGHLAND ASSOCIATES MAY HOLD POSITIONS IN THE MENTIONED COMPANIES IN THEIR PORTFOLIOS OR STRATEGIES. THIS MATERIAL DOES NOT CONSTITUTE AN OFFER OR AN INVITATION BY OR ON BEHALF OF HIGHLAND ASSOCIATES TO ANY PERSON OR ENTITY TO BUY OR SELL ANY SECURITY OR FINANCIAL INSTRUMENT OR ENGAGE IN ANY BANKING SERVICE. NOTHING IN THESE MATERIALS CONSTITUTES INVESTMENT, LEGAL, ACCOUNTING OR TAX ADVICE. NON-DEPOSIT PRODUCTS INCLUDING INVESTMENTS, SECURITIES, MUTUAL FUNDS, INSURANCE PRODUCTS, CRYPTO ASSETS AND ANNUITIES: ARE NOT FDIC-INSURED I ARE NOT A DEPOSIT I MAY GO DOWN IN VALUE I ARE NOT BANK GUARANTEED I ARE NOT INSURED BY ANY FEDERAL GOVERNMENT AGENCY I ARE NOT A CONDITION OF ANY BANKING ACTIVITY.
NEITHER REGIONS BANK NOR REGIONS ASSET MANAGEMENT (COLLECTIVELY, “REGIONS”) ARE REGISTERED MUNICIPAL ADVISORS NOR PROVIDE ADVICE TO MUNICIPAL ENTITIES OR OBLIGATED PERSONS WITH RESPECT TO MUNICIPAL FINANCIAL PRODUCTS OR THE ISSUANCE OF MUNICIPAL SECURITIES (INCLUDING REGARDING THE STRUCTURE, TIMING, TERMS AND SIMILAR MATTERS CONCERNING MUNICIPAL FINANCIAL PRODUCTS OR MUNICIPAL SECURITIES ISSUANCES) OR ENGAGE IN THE SOLICITATION OF MUNICIPAL ENTITIES OR OBLIGATED PERSONS FOR SUCH SERVICES. WITH RESPECT TO THIS PRESENTATION AND ANY OTHER INFORMATION, MATERIALS OR COMMUNICATIONS PROVIDED BY REGIONS, (A) REGIONS IS NOT RECOMMENDING AN ACTION TO ANY MUNICIPAL ENTITY OR OBLIGATED PERSON, (B) REGIONS IS NOT ACTING AS AN ADVISOR TO ANY MUNICIPAL ENTITY OR OBLIGATED PERSON AND DOES NOT OWE A FIDUCIARY DUTY PURSUANT TO SECTION 15B OF THE SECURITIES EXCHANGE ACT OF 1934 TO ANY MUNICIPAL ENTITY OR OBLIGATED PERSON WITH RESPECT TO SUCH PRESENTATION, INFORMATION, MATERIALS OR COMMUNICATIONS, (C) REGIONS IS ACTING FOR ITS OWN INTERESTS, AND (D) YOU SHOULD DISCUSS THIS PRESENTATION AND ANY SUCH OTHER INFORMATION, MATERIALS OR COMMUNICATIONS WITH ANY AND ALL INTERNAL AND EXTERNAL ADVISORS AND EXPERTS THAT YOU DEEM APPROPRIATE BEFORE ACTING ON THIS PRESENTATION OR ANY SUCH OTHER INFORMATION, MATERIALS OR COMMUNICATIONS.
SOURCE: BLOOMBERG INDEX SERVICES LIMITED. BLOOMBERG® IS A TRADEMARK AND SERVICE MARK OF BLOOMBERG FINANCE L.P. AND ITS AFFILIATES (COLLECTIVELY “BLOOMBERG”). BARCLAYS® IS A TRADEMARK AND SERVICE MARK OF BARCLAYS BANK PLC (COLLECTIVELY WITH ITS AFFILIATES, “BARCLAYS”), USED UNDER LICENSE. BLOOMBERG OR BLOOMBERG’S LICENSORS, INCLUDING BARCLAYS, OWN ALL PROPRIETARY RIGHTS IN THE BLOOMBERG BARCLAYS INDICES. NEITHER BLOOMBERG NOR BARCLAYS APPROVES OR ENDORSES THIS MATERIAL OR GUARANTEES THE ACCURACY OR COMPLETENESS OF ANY INFORMATION HEREIN, OR MAKES ANY WARRANTY, EXPRESS OR IMPLIED, AS TO THE RESULTS TO BE OBTAINED THEREFROM AND, TO THE MAXIMUM EXTENT ALLOWED BY LAW, NEITHER SHALL HAVE ANY LIABILITY OR RESPONSIBILITY FOR INJURY OR DAMAGES ARISING IN CONNECTION THEREWITH.