Stocks: A New All-Time High for the S&P 500 As Market Breadth Continues to Improve; Small Caps Benefiting From The Downtrend In Treasury Yields; Gold Glitters As U.S. Economic Data, Demand From Central Banks Abroad Boosts Prices.
Download Weekly Market Commentary | March 11 2024
What We’re Watching:
- U. S. Consumer Price Index (CPI) for February is released Tuesday with core readings of 0.3% month over month and 3.7% year over year expected, which would be a 0.1% and 0.2% decline versus January.
- The U.S. Treasury is set to auction $39B of 10-year notes on Tuesday. We will be monitoring demand for this offering from indirect bidders, i.e. foreign central banks, and how much of the issuance the dealer community is forced to take down given the sharp drop in the 10-year Treasury yield in recent weeks.
- U.S. Producer Price Index (PPI) for February is released Thursday with headline PPI expected to rise 0.3% month over month, in- line with the January reading. Core PPI, which excludes food and energy, is expected to rise 0.2% month over month, which would be a notable downshift from 0.5% in January. Wholesale prices (PPI) are expected to flow into CPI with a lag, so any notable deceleration in PPI would likely be welcomed by investors and potentially pull forward rate cuts.
- The University of Michigan Consumer Sentiment Index for March is released Friday and is expected to improve modestly to 77.5 from a 76.9 reading in February. This jump would align with the move higher witnessed in some of the other consumer sentiment readings and could boost expectations for consumer spending and GDP growth over coming quarters.
Key Observations
- Domestic equities strayed little from where they began the week despite a series of ‘goldilocks’ economic reports and continued signs of a broadening out of the now four-plus month rally.
- Small cap indices outperformed the S&P 500 on the week as falling interest rates and signs labor costs and inflationary pressures are subsiding boosted risk appetite and sentiment surrounding the asset class.
- There was a downward bias to Treasury yields over the balance of the week as market participants ratcheted higher the odds of a cut to the fed funds rate in June. The February nonfarm payrolls report showed robust job growth during the month, but average hourly earnings rose at a slower pace, highlighting a strong, but not too strong labor market.
What Happened Last Week:
Stocks: A New All-Time High for the S&P 500 As Market Breadth Continues to Improve; Small Caps Benefiting From The Downtrend In Treasury Yields; Gold Glitters As U.S. Economic Data, Demand From Central Banks Abroad Boosts Prices.
Encouragingly, Market Breadth Continues To Improve, But The Calendar Turns Unkind Soon: At the end of February, approximately two-thirds of the stocks in the S&P 500 traded above their 50- and 200-day moving average, but after the first week of March those already solid readings have improved with over 75% of the index trading above the 50/200-day as of last Friday. As evidence of this broadening out theme, the equal-weighted S&P 500 (ETF: RSP) returned 0.9% last week, while the market cap weighted S&P 500 generated a modest 0.2% weekly loss. It’s hard to get bearish on stocks with more names participating in the rally, but we are entering into what has historically been a seasonally weak spot in the calendar and lost momentum for stocks could be more painful should it materialize leading up to the start of quarterly reporting season in mid-April.
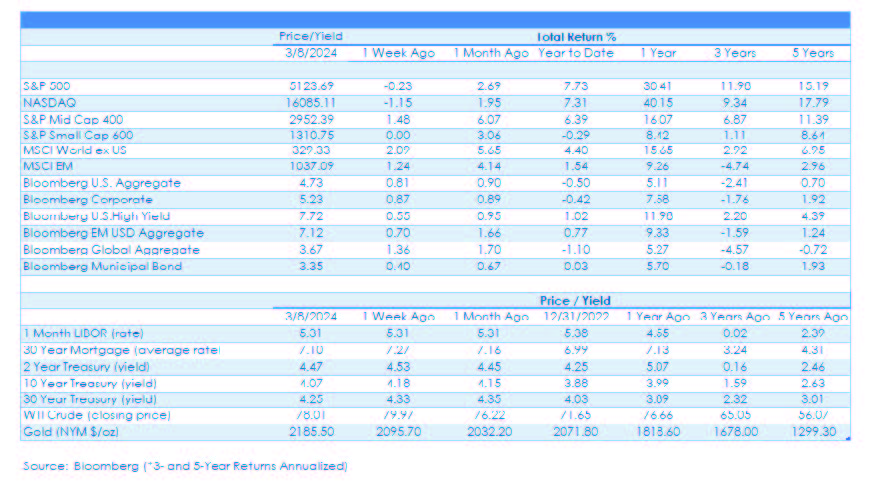
Small Cap Rebound Rolls On As Treasury Yields Continue To Fall: Optimism surrounding small and mid-cap stocks entering 2024 has up to this point appeared unfounded as 4Q earnings season for the S&P Small Cap 600 Index has been lackluster with earnings falling short of already lowered expectations. However, based upon the price reaction of the S&P 600 year-to-date, these results were largely already priced in as the S&P Small Cap 600 has fallen by 0.3%% since the start of the year – a far cry from the S&P 500’s 7.7% total return, and the 6.4% gain in the S&P Mid Cap 400. From our perspective the deck now appears to have been cleared with the worst for small caps in the rearview mirror, and with sales growth quietly turning positive for the first time since the fourth quarter of 2022, we remain constructive on the asset class.
What’s Going On With Gold? After marking time through February, gold has since made a parabolic move in March, rallying from $2,054 per ounce on February 29 to $2,186 per ounce last Friday, good for a 6.4% gain. Speculation has run rampant that the rally in gold signals confidence on the part of market participants that interest rates are unlikely to rise much from here and/or that the U.S. dollar has peaked and is poised to weaken as the FOMC cuts rates/eases monetary policy over coming months. While those variables could certainly explain some of the upward move, liquidity and increased demand have likely played a role as well, evidenced by gold rallying alongside more speculative assets such as bitcoin, while recent data points toward central banks abroad buying gold hand over fist in recent months.
Bonds: Treasury Yields Fall For The Third Straight Week As February Payrolls, Remarks From Fed Speakers Raise Likelihood Of A June Rate Cut; Bank of Japan Expected to Tweak Policy Later This Month; Labor Market Remains Strong In February, But Not Too Strong.
Core Outperforms On The Week, But Non-Core Maintains A Year-To-Date Lead: Treasury yields stair-stepped lower again last week with the 10-year dropping from 4.29% to end the week at 4.08%, a move that provided a tailwind for longer duration Treasuries and investment-grade corporate bonds. Non-core fixed income segments such as high yield and emerging market debt also turned out respectable, albeit more modest gains on the week, and both segments have been strong relative performers year-to-date and remain desirable exposures if sized appropriately.
FOMC “Not Far” From What Is Needed For Rate Cuts: FOMC Chair Jerome Powell testified before Congress last week ahead of the quiet period leading up to the Committee’s March 19-20 meeting. The media and markets appeared to key in on the Chairman’s comments that the Committee was “not far” from having the necessary confidence that inflation was moving sustainably toward 2% required for cuts to materialize. Fed funds futures opened last week pricing in a 58% chance of the first quarter-point rate cut taking place in June, but after Chair Powell’s remarks and a mixed February payrolls report, the odds of a cut in June jumped to 67%.
Early FOMC Preview: Markets have spent the better part of 2024 unwinding lofty expectations surrounding how many times the FOMC would cut rates this year. As 2024 kicked off, fed funds futures projected five or six 25-basis point rate cuts over the balance of 2024, but futures have shifted meaningfully and now project between three and four quarter-point rate cuts over the balance of this year. That shift has brought market participants into alignment with the FOMC’s most recent summary of economic projections, more commonly known as the dot-plot. The FOMC meeting scheduled for March 19-20 is expected to yield no changes to the fed funds rate, with the June meeting still the odds- on favorite for the first cut, but market participants will likely key off of any discussion surrounding adjusting the pace of balance sheet runoff, known as quantitative tightening, or notable shifts in the Committee’s latest dot-plot, both of which could increase volatility in the rates market after a period of relative calm in February. Expectations of a rate cut in March couldn’t be much lower, but there is still plenty of room for the FOMC’s latest dot-plot to generate some volatility in the rates market as the Committee must grapple with when to begin telegraphing that policy easing is in the offing without spurring a further runup in asset prices.
Likelihood Of A Bank Of Japan Policy Shift Later This Month Surges: The Bank of Japan (BoJ) has been preparing markets for policy tightening in recent month, but market participants have favored April or later for such a shift. Entering last week, the odds of a March 19 policy tweak stood at 35%, but over the balance of the week market participants recalibrated that expectation. By the end of the week, the likelihood of a rate hike on March 19 had almost doubled to 67% amid higher wage data and waves of vocal support from the highest ranks within Japan’s government. This combination led to strength in the Japanese yen to rally to 147¥ to the U.S. dollar from 150¥ earlier in the week, and the stronger yen generated some weakness in Japan’s primary equity index, the Nikkei 225, over the balance of the week.
Labor Market Cooling But Remains Far From Weak: The February nonfarm payrolls report released last Friday showed 275k jobs were created during the month, above the consensus estimate of 200k, but payrolls were revised lower by 167k for December and January. The unemployment rate rising to 3.9% from 3.7% the prior month garnered headlines, but we wouldn’t put too much stock in this one data point for various reasons. Perhaps most notably, average hourly earnings grew 0.14% month over month, below the 0.2% estimate and well below the 0.5% in January. The sharp rise in average hourly earnings in January rattled markets as market participants took it as a sign that inflationary pressures were potentially reaccelerating, but the February reading points toward January being an anomaly and not the trend. Treasury yields fell modestly and fed funds futures increased the odds of a June rate cut on the heels of the release.
IMPORTANT DISCLOSURES: THIS PUBLICATION HAS BEEN PREPARED BY THE STAFF OF HIGHLAND ASSOCIATES, INC. FOR DISTRIBUTION TO, AMONG OTHERS, HIGHLAND ASSOCIATES, INC. CLIENTS. HIGHLAND ASSOCIATES IS REGISTERED WITH THE UNITED STATES SECURITY AND EXCHANGE COMMISSION UNDER THE INVESTMENT ADVISORS ACT OF 1940. HIGHLAND ASSOCIATES IS A WHOLLY OWNED SUBSIDIARY OF REGIONS BANK, WHICH IN TURN IS A WHOLLY OWNED SUBSIDIARY OF REGIONS FINANCIAL CORPORATION. RESEARCH SERVICES ARE PROVIDED THROUGH MULTI-ASSET SOLUTIONS, A DEPARTMENT OF THE REGIONS ASSET MANAGEMENT BUSINESS GROUP WITHIN REGIONS BANK. THE INFORMATION AND MATERIAL CONTAINED HEREIN IS PROVIDED SOLELY FOR GENERAL INFORMATION PURPOSES ONLY. TO THE EXTENT THESE MATERIALS REFERENCE REGIONS BANK DATA, SUCH MATERIALS ARE NOT INTENDED TO BE REFLECTIVE OR INDICATIVE OF, AND SHOULD NOT BE RELIED UPON AS, THE RESULTS OF OPERATIONS, FINANCIAL CONDITIONS OR PERFORMANCE OF REGIONS BANK. UNLESS OTHERWISE SPECIFICALLY STATED, ANY VIEWS, OPINIONS, ANALYSES, ESTIMATES AND STRATEGIES, AS THE CASE MAY BE (“VIEWS”), EXPRESSED IN THIS CONTENT ARE THOSE OF THE RESPECTIVE AUTHORS AND SPEAKERS NAMED IN THOSE PIECES AND MAY DIFFER FROM THOSE OF REGIONS BANK AND/OR OTHER REGIONS BANK EMPLOYEES AND AFFILIATES. VIEWS AND ESTIMATES CONSTITUTE OUR JUDGMENT AS OF THE DATE OF THESE MATERIALS, ARE OFTEN BASED ON CURRENT MARKET CONDITIONS, AND ARE SUBJECT TO CHANGE WITHOUT NOTICE. ANY EXAMPLES USED ARE GENERIC, HYPOTHETICAL AND FOR ILLUSTRATION PURPOSES ONLY. ANY PRICES/QUOTES/STATISTICS INCLUDED HAVE BEEN OBTAINED FROM SOURCES BELIEVED TO BE RELIABLE, BUT HIGHLAND ASSOCIATES, INC. DOES NOT WARRANT THEIR COMPLETENESS OR ACCURACY. THIS INFORMATION IN NO WAY CONSTITUTES RESEARCH AND SHOULD NOT BE TREATED AS SUCH. THE VIEWS EXPRESSED HEREIN SHOULD NOT BE CONSTRUED AS INDIVIDUAL INVESTMENT ADVICE FOR ANY PARTICULAR PERSON OR ENTITY AND ARE NOT INTENDED AS RECOMMENDATIONS OF PARTICULAR SECURITIES, FINANCIAL INSTRUMENTS, STRATEGIES OR BANKING SERVICES FOR A PARTICULAR PERSON OR ENTITY. THE NAMES AND MARKS OF OTHER COMPANIES OR THEIR SERVICES OR PRODUCTS MAY BE THE TRADEMARKS OF THEIR OWNERS AND ARE USED ONLY TO IDENTIFY SUCH COMPANIES OR THEIR SERVICES OR PRODUCTS AND NOT TO INDICATE ENDORSEMENT, SPONSORSHIP, OR OWNERSHIP BY REGIONS OR HIGHLAND ASSOCIATES. EMPLOYEES OF HIGHLAND ASSOCIATES, INC., MAY HAVE POSITIONS IN SECURITIES OR THEIR DERIVATIVES THAT MAY BE MENTIONED IN THIS REPORT. ADDITIONALLY, HIGHLAND’S CLIENTS AND COMPANIES AFFILIATED WITH HIGHLAND ASSOCIATES MAY HOLD POSITIONS IN THE MENTIONED COMPANIES IN THEIR PORTFOLIOS OR STRATEGIES. THIS MATERIAL DOES NOT CONSTITUTE AN OFFER OR AN INVITATION BY OR ON BEHALF OF HIGHLAND ASSOCIATES TO ANY PERSON OR ENTITY TO BUY OR SELL ANY SECURITY OR FINANCIAL INSTRUMENT OR ENGAGE IN ANY BANKING SERVICE. NOTHING IN THESE MATERIALS CONSTITUTES INVESTMENT, LEGAL, ACCOUNTING OR TAX ADVICE. NON-DEPOSIT PRODUCTS INCLUDING INVESTMENTS, SECURITIES, MUTUAL FUNDS, INSURANCE PRODUCTS, CRYPTO ASSETS AND ANNUITIES: ARE NOT FDIC-INSURED I ARE NOT A DEPOSIT I MAY GO DOWN IN VALUE I ARE NOT BANK GUARANTEED I ARE NOT INSURED BY ANY FEDERAL GOVERNMENT AGENCY I ARE NOT A CONDITION OF ANY BANKING ACTIVITY.
NEITHER REGIONS BANK NOR REGIONS ASSET MANAGEMENT (COLLECTIVELY, “REGIONS”) ARE REGISTERED MUNICIPAL ADVISORS NOR PROVIDE ADVICE TO MUNICIPAL ENTITIES OR OBLIGATED PERSONS WITH RESPECT TO MUNICIPAL FINANCIAL PRODUCTS OR THE ISSUANCE OF MUNICIPAL SECURITIES (INCLUDING REGARDING THE STRUCTURE, TIMING, TERMS AND SIMILAR MATTERS CONCERNING MUNICIPAL FINANCIAL PRODUCTS OR MUNICIPAL SECURITIES ISSUANCES) OR ENGAGE IN THE SOLICITATION OF MUNICIPAL ENTITIES OR OBLIGATED PERSONS FOR SUCH SERVICES. WITH RESPECT TO THIS PRESENTATION AND ANY OTHER INFORMATION, MATERIALS OR COMMUNICATIONS PROVIDED BY REGIONS, (A) REGIONS IS NOT RECOMMENDING AN ACTION TO ANY MUNICIPAL ENTITY OR OBLIGATED PERSON, (B) REGIONS IS NOT ACTING AS AN ADVISOR TO ANY MUNICIPAL ENTITY OR OBLIGATED PERSON AND DOES NOT OWE A FIDUCIARY DUTY PURSUANT TO SECTION 15B OF THE SECURITIES EXCHANGE ACT OF 1934 TO ANY MUNICIPAL ENTITY OR OBLIGATED PERSON WITH RESPECT TO SUCH PRESENTATION, INFORMATION, MATERIALS OR COMMUNICATIONS, (C) REGIONS IS ACTING FOR ITS OWN INTERESTS, AND (D) YOU SHOULD DISCUSS THIS PRESENTATION AND ANY SUCH OTHER INFORMATION, MATERIALS OR COMMUNICATIONS WITH ANY AND ALL INTERNAL AND EXTERNAL ADVISORS AND EXPERTS THAT YOU DEEM APPROPRIATE BEFORE ACTING ON THIS PRESENTATION OR ANY SUCH OTHER INFORMATION, MATERIALS OR COMMUNICATIONS.
SOURCE: BLOOMBERG INDEX SERVICES LIMITED. BLOOMBERG® IS A TRADEMARK AND SERVICE MARK OF BLOOMBERG FINANCE L.P. AND ITS AFFILIATES (COLLECTIVELY “BLOOMBERG”). BARCLAYS® IS A TRADEMARK AND SERVICE MARK OF BARCLAYS BANK PLC (COLLECTIVELY WITH ITS AFFILIATES, “BARCLAYS”), USED UNDER LICENSE. BLOOMBERG OR BLOOMBERG’S LICENSORS, INCLUDING BARCLAYS, OWN ALL PROPRIETARY RIGHTS IN THE BLOOMBERG BARCLAYS INDICES. NEITHER BLOOMBERG NOR BARCLAYS APPROVES OR ENDORSES THIS MATERIAL OR GUARANTEES THE ACCURACY OR COMPLETENESS OF ANY INFORMATION HEREIN, OR MAKES ANY WARRANTY, EXPRESS OR IMPLIED, AS TO THE RESULTS TO BE OBTAINED THEREFROM AND, TO THE MAXIMUM EXTENT ALLOWED BY LAW, NEITHER SHALL HAVE ANY LIABILITY OR RESPONSIBILITY FOR INJURY OR DAMAGES ARISING IN CONNECTION THEREWITH.