Stocks: Tailwinds Building For Small Caps, But Skepticism Is Warranted; Japan, India, Taiwan Lead Abroad As Investors Seek Reasons To Become More Constructive On China.
Download Weekly Market Commentary | March 04 2024
What We’re Watching:
- The Non-Manufacturing or Services Purchasing Managers Index (PMI) for February is released Tuesday and is expected to fall to 52.8 from 53.4 in January. A reading above 50 indicates that the non-manufacturing economy is generally expanding; below 50, that it is generally contracting/declining. Continued strength out of the services sector has prevented inflation from subsiding as quickly as monetary policymakers might have hoped, and fed funds futures could key off this metric and recalibrate rate cut expectations on the heels of the release.
- U.S. nonfarm payrolls for February are released Friday and 200k jobs are expected to have been created during the month, which would be a sizable and noteworthy drop from the 353k created in January. The unemployment rate is expected to remain static month over month at 3.7% while average hourly earnings are expected to rise 0.25% month over month which would be a notable deceleration from 0.6% month over month growth in January. A modest cooling of the labor market, evidenced by a month over month drop in jobs created and/ or average hourly earnings would likely be welcome news for the FOMC after January’s hotter than expected inflation readings.
Key Observations
- Stocks were rudderless and range-bound into mid-week leading up to the closely watched release of the FOMC’s preferred inflation gauge from January, a report that universally met expectations. Investors took some level of comfort from the inflation report and fear surrounding the FOMC’s next move being a hike, not a cut, subsided.
- Domestic equity indices staged a late week rally with smaller capitalization stocks keeping pace with large caps. Within small cap indices, the least profitable, lowest quality names appeared to lead the charge, evidence of robust investor risk appetite, but also cause for skepticism given how far the broader market has come year-to-date and over the past four months.
- Bond investors were able to breathe a sigh of relief as a closely watched inflation report for January matched the consensus expectation. Treasury yields across the curve ended the week lower, with most maturities closing within 5-to-10 basis points of where they started the week. With January PCE now in the rearview mirror, bond investors could find themselves in a clip your coupon environment for the next few weeks leading up to the FOMC’s March 19-20 meeting.
What Happened Last Week:
Stocks: Tailwinds Building For Small Caps, But Skepticism Is Warranted; Japan, India, Taiwan Lead Abroad As Investors Seek Reasons To Become More Constructive On China.
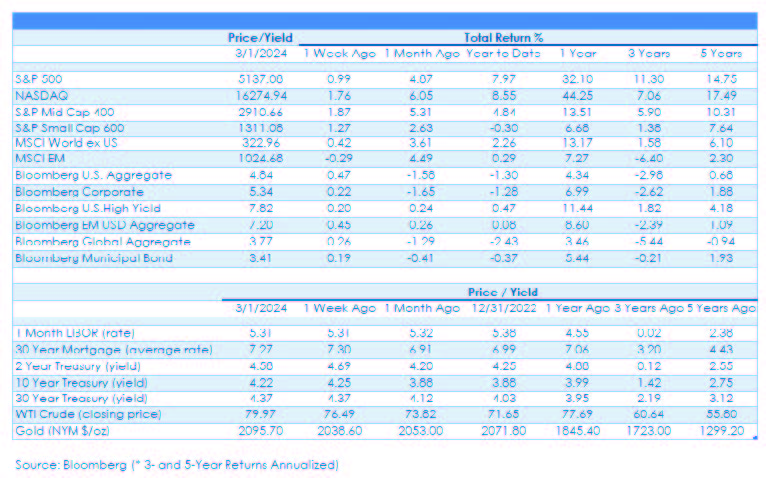
Small-Cap Tailwinds Building As The Asset Class Closes In On Its December ‘23 High. Large-cap stocks (S&P 500) have turned out an impressive 7.9% total return year- to-date, outperforming the S&P 600 small cap index by 8.2% over that short time span. However, small caps as a group could be poised to play catch-up over coming months, particularly if inflation data shows signs of cooling and Treasury yields stabilize and/or move lower. The recent rally in some of the unprofitable areas within small caps, specifically biotechnology stocks, signals robust risk appetite and could be a sign that either investors don’t expect interest rates to move markedly higher from here or that M&A activity is expected to heat up as the year rolls along. Investors appear to be focused on riskier, higher beta exposures and potential upside as opposed to fundamentals which has caused the S&P 600 to lag lower quality small cap indices due to its profitability filter. However, giving up a few basis points of return to own companies that are likely to come out ahead in the long run, with lower volatility to boot, is still preferable.
Japanese Stocks Remain A Standout Abroad, But Some Caution Is Warranted. The MSCI Japan index continued to charge higher last week with Japan’s Nikkei 225 index rising another 2.1% and after finally breaking above its all-time high reached back in 1989 in recent weeks, more gains likely lie ahead. Japan is export-reliant and continued weakness in the Japanese yen versus the U.S. dollar has been a nice tailwind for sales and profit growth, but that tailwind could moderate somewhat in coming months. In 3Q/4Q of last year, it appeared as though rising inflation in Japan would potentially force the Bank of Japan (BoJ) to tighten monetary policy early in the new year, perhaps aggressively so, likely leading to a stronger Japanese yen. Recent inflation data out of Japan has cooled modestly, but the BoJ has continued to prepare markets for a policy shift of some sort in the coming months, which could lead to a strengthening of the yen into the summer. The Nikkei 225 could experience heightened volatility after an exceptional 11.9% total return in U.S. dollar terms year-to-date should the BoJ decide to raise the allowable ceiling, both from a strengthening of the Japanese currency and a rising cost of capital.
Emerging Markets Marking Time As Investors Await A Positive Catalyst For Chinese Stocks. Year-to-date, the broader MSCI Emerging Markets (EM) index has posted a lackluster 0.3% return as China’s 25% weight within the index and -2.7% year-to-date return has acted as a drag. However, while investors don’t have much to show from their exposure to developing markets so far this year, we have been encouraged by the broader EM index’s resiliency. Country indices tied to India and Taiwan, which together account for over 34% of the EM index, have each rallied 3.5% or more year-to-date, serving to offset China’s drag and prop up the MSCI EM index. While skepticism surrounding China is warranted, we remain constructive on emerging market stocks over the balance of this year and see reasons for optimism. Even a modest improvement in sentiment and positioning surrounding Chinese stocks could lead to a sharp rebound/rally, and with rhetoric between the U.S. and China growing noticeably quiet in recent months, we believe the Chinese government is increasingly focused on improving consumer sentiment and spurring economic growth, in turn boosting equity prices. More importantly for the MSCI EM index, if inflationary pressures subside in the U.S. over coming months/quarters, rate cut expectations will again build and the U.S. dollar (USD) should weaken, a feather in the cap for developing economies required to purchase commodities in USD.
Bonds: January Inflation Data A Non-Event For Treasuries, But Falling Prices Paid Put Downward Pressure On Yields; The Riskiest, Lowest Quality High Yield Corporate Bonds Outperform On The Week.
Closely Watched January Inflation Print Proves A Non-Event For Bonds. January Personal Consumption Expenditure (PCE) was released last Thursday, and the release was universally in-line with expectations, no matter how you slice and dice it. Core PCE Deflator, the FOMC’s preferred inflation gauge, rose 0.4% month over month and 2.8% year over year. While the month over month reading was well above the 0.14% increase in January, the year over year reading continued to trend lower, albeit at a slow pace, which will likely be viewed positively by the FOMC when it meets in mid-March. Despite angst leading up to the release that PCE could come in hot, Treasury yields were little changed on the day, with the 10-year yield falling just 2 basis points last Thursday to close at 4.25% and fed funds futures barely budged on the heels of the PCE release. The futures market still expects the FOMC to deliver its first 25-basis point rate cut in June and at present we wouldn’t quibble much with that projection.
Ho-Hum Treasury Auction, Falling Prices Paid Force Yields Lower On The Week. Another low drama Treasury auction, this time $42B of 7-year paper last Tuesday, points toward a willingness on the part of institutional investors to scoop up new issuance, even with only modestly higher yields. Consistent demand makes it difficult to envision an environment where yields break higher as buyers have cash and appear eager to buy any back up in yields. On the economic data front, the Institute for Supply Management (ISM) released its prices paid index for February last Friday which showed prices cooling modestly month over month, while the January figure was revised lower. Taken together, this dynamic suggests some of the immediate concerns around inflationary pressures r ising a nd p utting upward pressure on yields have been exaggerated.
High Yield Credit Spreads Back To Levels Last Seen In April of 2022, With Lower Quality Issues Outperforming. The Bloomberg U.S. Corporate High Yield Index had a forgettable week, ending the week higher by 0.2% even as spreads widened modestly after narrowing in each of the prior three weeks. According to the textbooks, widening credit spreads should, in theory, hit the riskiest corporate bonds the hardest. But last week CCC-rated issues, bonds that carry the lowest credit rating above those in default, saw tighter spread levels which led to a 1% gain. It’s a stark reminder that bond markets don’t always trade in a linear fashion and at times relative valuations can be a more powerful driver of returns than fundamentals. Some weaker credits are far from cheap relative to historical norms but with CCC’s trading at a 7.6% spread compared to a 3.1% spread for the broader U.S. Corporate High Yield index, it’s not so difficult to see why investors are maintaining exposure when the outlook for economic growth and earnings appear supportive. While we’re always wary of corporates in the lowest credit tranche, and invoke seasoned active managers to navigate those markets, we can’t deny the 12.2% yield-to-worst for the subset provides a reasonable margin of safety within a diversified portfolio if sized appropriately.
The content and any portion of this newsletter is for personal use only and may not be reprinted, sold or redistributed without the written consent of Regions Bank. Regions, the Regions logo and other Regions marks are trademarks of Regions Bank. The names and marks of other companies or their services or products may be the trademarks of their owners and are used only to identify such companies or their services or products and not to indicate endorsement or sponsorship of Regions or its services or products. The information and material contained herein is provided solely for general information purposes.
Regions does not make any warranty or representation relating to the accuracy, completeness or timeliness of any information contained in the newsletter and shall not be liable for any damages of any kind relating to such information nor as to the legal, regulatory, financial or tax implications of the matters referred herein. This material is not intended to be investment advice nor is this information intended as an offer or solicitation for the purchase or sale of any security or other financial instrument. Any opinions expressed herein are given in good faith, are subject to change without notice, and are only current as of the stated date of their issue. Regions Asset Management is a business group within Regions Bank that provides investment management services to customers of Regions Bank. Employees of Regions Asset Management may have positions in securities or their derivatives that may be mentioned in this report or in their personal accounts. Additionally, affiliated companies may hold positions in the mentioned companies in their portfolios or strategies. The companies mentioned specifically are sample companies, noted for illustrative purposes only.
The mention of the companies should not be construed as a recommendation to buy, hold or sell positions in your investment portfolio. Neither Regions Bank nor Regions Asset Management (collectively, “Regions”) are registered municipal advisors nor provide advice to municipal entities or obligated persons with respect to municipal financial products or the issuance of municipal securities (including regarding the structure, timing, terms and similar matters concerning municipal financial products or municipal securities issuances) or engage in the solicitation of municipal entities or obligated persons for such services.
With respect to this presentation and any other information, materials or communications provided by Regions, (a) Regions is not recommending an action to any municipal entity or obligated person, (b) Regions is not acting as an advisor to any municipal entity or obligated person and does not owe a fiduciary duty pursuant to Section 15 B of the Securities Exchange Act of 1934 to any municipal entity or obligated person with respect to such presentation, information, materials or communications, (c) Regions is acting for its own interests, and (d) you should discuss this presentation and any such other information, materials or communications with any and all internal and external advisors and experts that you deem appropriate before acting on this presentation or any such other information, materials or communications. Source: Bloomberg Index Services Limited. BLOOMBERG® is a trademark and service mark of Bloomberg Finance L.P. and its affiliates (collectively “Bloomberg”). BARCLAYS® is a trademark and service mark of Barclays Bank Plc (collectively with its affiliates, “Barclays”), used under license. Bloomberg or Bloomberg’s licensors, including Barclays, own all proprietary rights in the Bloomberg Barclays Indices. Neither Bloomberg nor Barclays approves or endorses this material or guarantees the accuracy or completeness of any information herein, or makes any warranty, express or implied, as to the results to be obtained therefrom and, to the maximum extent allowed by law, neither shall have any liability or responsibility for injury or damages arising in connection therewith.
Source: Bloomberg Index Services Limited. BLOOMBERG® is a trademark and service mark of Bloomberg Finance L.P. and its affiliates (collectively “Bloomberg”). BARCLAYS® is a trademark and service mark of Barclays Bank Plc (collectively with its affiliates, “Barclays”), used under license. Bloomberg or Bloomberg’s licensors, including Barclays, own all proprietary rights in the Bloomberg Barclays Indices. Neither Bloomberg nor Barclays approves or endorses this material or guarantees the accuracy or completeness of any information herein, or makes any warranty, express or implied, as to the results to be obtained therefrom and, to the maximum extent allowed by law, neither shall have any liability or responsibility for injury or damages arising in connection therewith.
The information provided herein is for informational purposes only and is intended to report on various investment views held by Multi-Asset Solutions (MAS) and Highland Associates. Opinions, estimates, forecasts, and statements of financial market trends are based on current market conditions that constitute the judgement of MAS and Highland Associates and are subject to change. The information is received from third parties, which is believed to be accurate, but no representation is made that the information provided is accurate and complete. The information is given as of the date indicated and believed to be reliable. While MAS and Highland have tried to provide accurate and timely information, there may be inadvertent technical or factual inaccuracies or typographical errors for which we apologize. The information provided herein does not constitute a solicitation or offer by Highland or its affiliates, to buy or sell any securities or other financial instrument, or to provide investment advice or service. Nothing contained herein should be construed as investment advice or a recommendation to purchase or sell a particular security. Investing involves a high degree of risk, and all investors should carefully consider their investment objective and the suitability of any investments.
Research services are provided through Multi-Asset Solutions, a department of the Regions Asset Management business group within Regions Bank. Highland is a wholly owned subsidiary of Regions Bank, which in turn is a wholly owned subsidiary of Regions Financial Corporation.
Past performance is not indicative of future results. Investments are subject to loss.