Stocks: June Rally Takes A Well-Earned And Much Needed Breather; Small-Caps Lag On The Week, But Maintain A Modest Month-To- Date Lead.
Download Weekly Market Commentary | June 26 2023
Key Observations:
- Profit-taking hits stocks, leading to an orderly sell-off and modest weekly losses for domestic large-cap names. A period of sideways price action or consolidation would be a healthy development after strong month-to-date gains.
- Small-cap stocks lag large-caps on the week, but have kept pace month-to-date, an encouraging development and indicative of a broadening out of the rally potentially supportive of additional upside.
- China ramps up stimulus, but investors are unimpressed with what they view as steps that aren’t aggressive enough to spur growth, leading to continued weakness. When allocating to emerging markets country selection is of the utmost importance as opportunities exist outside of China.
- No new news from FOMC Chair Jerome Powell’s testimony before the House and Senate last week. A 25- basis point rate hike remains our base-case for July, but we’re less convinced the Fed will raise rates further after that.
- The Bank of England hiked key policy rates by 50-basis points last week as inflationary pressures in the U.K. remain elevated. Additional rate hikes are likely over coming months.
- Core inflation in Japan rose by 4.3% year over year in May, its highest reading since 1980. With core inflation rising to uncomfortable levels, the Bank of Japan could face increased pressure to shift away from its ultra- easy monetary policy stance over coming months.
What We’re Watching:
- The Conference Board’s Consumer Confidence Survey for June is released Tuesday and is expected to improve modestly to 103.8 from 102.3 in May.
- The Eurozone Economic Confidence Survey for June is released Thursday and is expected to deteriorate month over month to 95.8 from a 96.5 reading in May.
- Eurozone Consumer Price Index (CPI) for June is released Friday and is expected to have risen 5.5% year over year, down from 6.1% year over year in May. Core CPI is also expected to have risen 5.5% year over year in June, a modest uptick from a 5.3% reading in May.
- Personal Consumption Expenditures (PCE), the Federal Open Market Committee’s preferred inflation gauge, for May is released Friday. Headline PCE is expected to rise just 0.1% month over month after a 0.36% reading in April, while core PCE is expected to rise 0.3% month over month after a 0.38% reading in April. Year over year, headline PCE is expected to rise 3.8% while core PCE is expected to rise 4.7%. While a sub-4% year over year headline reading would be welcomed by the FOMC, a core reading of 4.7% would reinforce our view that a rate hike in July is the most likely outcome.
Stocks: June Rally Takes A Well-Earned And Much Needed Breather; Small-Caps Lag On The Week, But Maintain A Modest Month-To- Date Lead.
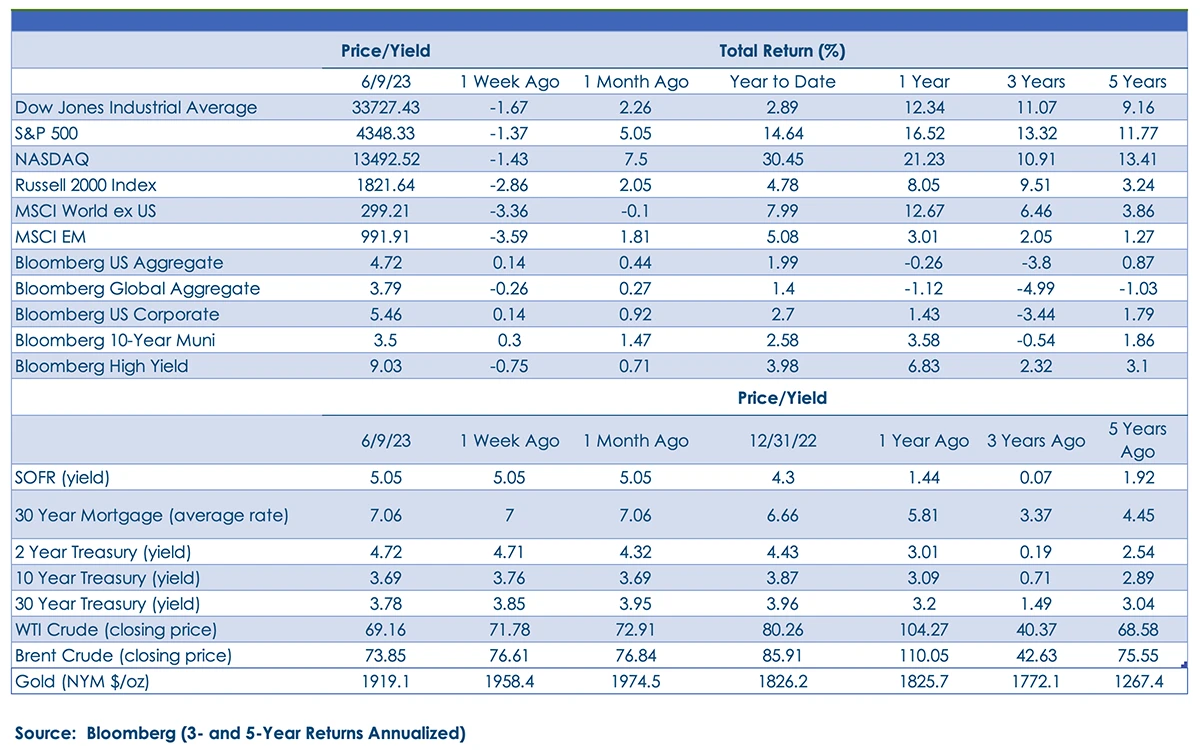
There was a downward bias to global equity prices last week, and the four broader primary indices we track declined in an orderly manner and exhibited signs of healthy profit taking after sizable month-to-date rallies. The large-cap S&P 500 fell 1.3%, the small-cap Russell 2000 lost 2.8%, the MSCI ACWI ex U.S. index of developed and developing markets abroad declined 3.3%, and the MSCI Emerging Markets index gave back 3.5%. Domestically, there were signs of rotation out of highfliers in the communication services and information technology sectors early in the week with capital finding a home in defensive sectors such as consumer staples and health care. All told, there weren’t many discernible trends worth noting last week and more than anything, price action just exhibited signs of exhaustion and equity prices appeared heavy or tired after a sizable month-to-date rally. A period of sideways price action or consolidation would be beneficial leading up to the start of earnings season in a couple of weeks, and with investor sentiment improving over the past month, we expect the ‘buy the dip’ crowd to pounce on any 3%-5% pullback in the S&P 500.
Small-Cap stocks Playing Catch-Up Month- To-Date.
Even after last week’s drop, the small-cap Russell 2000 index has rallied 4.2% month-to-date and has outpaced the large-cap S&P 500’s more than respectable 4% gain. However, three-plus weeks of improved relative performance, while encouraging, isn’t in isolation cause to shift capital into smaller companies in a major way. Higher for longer interest rates, companies hitting a refinancing wall in ’24 that will likely be costly from an interest expense perspective, and continued tightness in the labor market, lead us to question the durability of the recent out performance. Small-caps are attractively valued relative to the S&P 500 and relative to their own historical valuation metrics, but fundamentals remain in question and thus we remain neutral on domestic small and mid-cap (SMid) stocks at present. Active managers focused on identifying and investing in ‘quality’ small-cap stocks are an appealing way to play the space given our rate expectations, a choppy and challenging economic backdrop, and the wall of corporate debt set to mature in the next 12-18 months, which will weigh on heavily indebted firms needing to roll existing debt to fund operations.
Emerging Markets Lag As Chinese Equities Remain Weak.
Last week, China’s central bank cut deposit rates and hinted at additional cuts down the road to stimulate spending and economic growth, all while U.S./China tensions appeared to ebb after U.S. Secretary of State Blinken met with Chinese President Xi and both sides noted the collegial and constructive tone to discussions. However, markets viewed the central bank’s monetary policy move as not aggressive enough to move the needle on the economic growth front, and any goodwill or optimism stemming from Blinken’s visit appeared to be short lived as rhetoric and saber rattling between the U.S. and China again ramped up late last week. Even after falling 3.3% last week, the MSCI China index has gained 3.1% month-to-date, but investor sentiment surrounding Chinese stocks appears to fall somewhere between skeptical and decidedly negative, which from a contrarian perspective could be viewed as a potential tailwind for Chinese equities, specifically, and emerging markets broadly. We maintain a neutral allocation to emerging market equities as we see the potential risk/reward for the asset class as balanced at present with optimism surrounding exposures to Brazil, Mexico, India, and some other countries offset by uncertainty and weak investor sentiment surrounding China. Active management within emerging markets remains preferable and recommended as a result.
Bonds: 25-Basis Point Fed Funds Hike In July Is Our Base-Case; Elevated Inflation Testing Central Banks Abroad.
Federal Open Market Committee (FOMC) Chair Jerome Powell gave his semiannual monetary policy report in front of the House Financial Services Committee last Wednesday and again in front of the Senate Banking Committee on Thursday. In prepared remarks, Chair Powell reinforced his stance from the latest post FOMC meeting press conference that additional rate hikes are likely with inflation remaining well above where it should be. Fed funds futures responded by shifting from a 76% likelihood of a 25-basis point hike when the FOMC meets in July to 80% before ending the week back around 75%. A quarter-point hike appears baked in for July, but beyond that it’s anyone’s best guess as to how the Committee will choose to proceed. With the yield on 3- and 6-month Treasury bills in the 5.3% to 5.4% range at the end of last week, the market appears to believe the FOMC will be done for good after another quarter-point rate hike. While that’s our base-case as well given our expectation that the economy and labor market will continue to soften over coming months, easing inflationary pressures along the way, a gulf has again developed between the FOMC’s projection of what it will do and what the market believes the Fed will do. With the FOMC’s credibility still in question and an uncertain economic backdrop in place, heightened volatility in long-term Treasury yields remains likely.
Long-Term Treasury Yields Remain Range-Bound, For Now.
Last week, the 10-year Treasury yield again charted higher, closing at 3.80% on Thursday before increased demand amid a flight to safety forced yields lower into the weekend with a 10-year closing at 3.74%. The 3.75% to 3.85% zone remains well worth watching on the 10-year Treasury yield as a break above that range would be noteworthy and could usher in a re-test of the 4.10% level which proved to be a year-to-date peak in early March. A move of that magnitude would likely generate a steep sell-off in stocks and investment-grade corporate bonds, creating a buying opportunity in the latter.
Bank Of England Gets Aggressive Amid Signs Of Entrenched Inflation.
U.K. inflation in May again exceeded the consensus forecast for the 4th straight month, with headline inflation coming in at 8.7% year over year, above the 8.4% estimate. Core inflation rose to 7.1% year over year, accelerating from 6.8% year over year in the prior month, and the highest reading since 1992. The Bank of England (BoE) met last Thursday and raised its benchmark lending rate by a larger than expected 50-basis points, taking it to 5%. Market participants expect the BoE to ultimately raise to 6%, and with the central bank explicitly stating that additional policy tightening will be coming, yields on short-term U.K. gilts are likely poised to rise further. With the 10-year gilt yielding 4.38% at the end of last week, the expectation appears to be that the BoE will ultimately curb inflation, but it could take some time and the process of doing so may lead some ‘things’ to break in the U.K. economy. The BoE finds itself in a precarious position as economic growth has slowed meaningfully while core inflation remains well above target, leading to a weaker pound and growing cries of stagflation across the pond. The BoE’s hike, and any additional rate increases, will likely lead to significant stress in the U.K. housing market over coming quarters as borrowers relying heavily on adjustable-rate mortgages over the past decade see higher monthly payments as these mortgages reset at drastically higher levels.
Bank Of Japan Still In Easing Mode, But Inflation At A 40-Year High May Spur A Policy Shift.
Core inflation in Japan rose 4.3% year over year in May, up from a 4.1% year over year reading in April. The 4.3% reading is the highest dating back to 1980 and calls into question the sustainability of the Bank of Japan’s yield curve control program that caps yields on 10-year Japanese Government Bonds at 0.50%. The June inflation reading again topping the consensus estimate could spur the BoJ to act sooner rather than later, which could contribute to upward pressure on sovereign bond yields in the U.S. and euro area, specifically.
IMPORTANT DISCLOSURES: THIS PUBLICATION HAS BEEN PREPARED BY THE STAFF OF HIGHLAND ASSOCIATES, INC. FOR DISTRIBUTION TO, AMONG OTHERS, HIGHLAND ASSOCIATES, INC. CLIENTS. HIGHLAND ASSOCIATES IS REGISTERED WITH THE UNITED STATES SECURITY AND EXCHANGE COMMISSION UNDER THE INVESTMENT ADVISORS ACT OF 1940. HIGHLAND ASSOCIATES IS A WHOLLY OWNED SUBSIDIARY OF REGIONS BANK, WHICH IN TURN IS A WHOLLY OWNED SUBSIDIARY OF REGIONS FINANCIAL CORPORATION. RESEARCH SERVICES ARE PROVIDED THROUGH MULTI-ASSET SOLUTIONS, A DEPARTMENT OF THE REGIONS ASSET MANAGEMENT BUSINESS GROUP WITHIN REGIONS BANK. THE INFORMATION AND MATERIAL CONTAINED HEREIN IS PROVIDED SOLELY FOR GENERAL INFORMATION PURPOSES ONLY. TO THE EXTENT THESE MATERIALS REFERENCE REGIONS BANK DATA, SUCH MATERIALS ARE NOT INTENDED TO BE REFLECTIVE OR INDICATIVE OF, AND SHOULD NOT BE RELIED UPON AS, THE RESULTS OF OPERATIONS, FINANCIAL CONDITIONS OR PERFORMANCE OF REGIONS BANK. UNLESS OTHERWISE SPECIFICALLY STATED, ANY VIEWS, OPINIONS, ANALYSES, ESTIMATES AND STRATEGIES, AS THE CASE MAY BE (“VIEWS”), EXPRESSED IN THIS CONTENT ARE THOSE OF THE RESPECTIVE AUTHORS AND SPEAKERS NAMED IN THOSE PIECES AND MAY DIFFER FROM THOSE OF REGIONS BANK AND/OR OTHER REGIONS BANK EMPLOYEES AND AFFILIATES. VIEWS AND ESTIMATES CONSTITUTE OUR JUDGMENT AS OF THE DATE OF THESE MATERIALS, ARE OFTEN BASED ON CURRENT MARKET CONDITIONS, AND ARE SUBJECT TO CHANGE WITHOUT NOTICE. ANY EXAMPLES USED ARE GENERIC, HYPOTHETICAL AND FOR ILLUSTRATION PURPOSES ONLY. ANY PRICES/QUOTES/STATISTICS INCLUDED HAVE BEEN OBTAINED FROM SOURCES BELIEVED TO BE RELIABLE, BUT HIGHLAND ASSOCIATES, INC. DOES NOT WARRANT THEIR COMPLETENESS OR ACCURACY. THIS INFORMATION IN NO WAY CONSTITUTES RESEARCH AND SHOULD NOT BE TREATED AS SUCH. THE VIEWS EXPRESSED HEREIN SHOULD NOT BE CONSTRUED AS INDIVIDUAL INVESTMENT ADVICE FOR ANY PARTICULAR PERSON OR ENTITY AND ARE NOT INTENDED AS RECOMMENDATIONS OF PARTICULAR SECURITIES, FINANCIAL INSTRUMENTS, STRATEGIES OR BANKING SERVICES FOR A PARTICULAR PERSON OR ENTITY. THE NAMES AND MARKS OF OTHER COMPANIES OR THEIR SERVICES OR PRODUCTS MAY BE THE TRADEMARKS OF THEIR OWNERS AND ARE USED ONLY TO IDENTIFY SUCH COMPANIES OR THEIR SERVICES OR PRODUCTS AND NOT TO INDICATE ENDORSEMENT, SPONSORSHIP, OR OWNERSHIP BY REGIONS OR HIGHLAND ASSOCIATES. EMPLOYEES OF HIGHLAND ASSOCIATES, INC., MAY HAVE POSITIONS IN SECURITIES OR THEIR DERIVATIVES THAT MAY BE MENTIONED IN THIS REPORT. ADDITIONALLY, HIGHLAND’S CLIENTS AND COMPANIES AFFILIATED WITH HIGHLAND ASSOCIATES MAY HOLD POSITIONS IN THE MENTIONED COMPANIES IN THEIR PORTFOLIOS OR STRATEGIES. THIS MATERIAL DOES NOT CONSTITUTE AN OFFER OR AN INVITATION BY OR ON BEHALF OF HIGHLAND ASSOCIATES TO ANY PERSON OR ENTITY TO BUY OR SELL ANY SECURITY OR FINANCIAL INSTRUMENT OR ENGAGE IN ANY BANKING SERVICE. NOTHING IN THESE MATERIALS CONSTITUTES INVESTMENT, LEGAL, ACCOUNTING OR TAX ADVICE. NON-DEPOSIT PRODUCTS INCLUDING INVESTMENTS, SECURITIES, MUTUAL FUNDS, INSURANCE PRODUCTS, CRYPTO ASSETS AND ANNUITIES: ARE NOT FDIC-INSURED I ARE NOT A DEPOSIT I MAY GO DOWN IN VALUE I ARE NOT BANK GUARANTEED I ARE NOT INSURED BY ANY FEDERAL GOVERNMENT AGENCY I ARE NOT A CONDITION OF ANY BANKING ACTIVITY.
NEITHER REGIONS BANK NOR REGIONS ASSET MANAGEMENT (COLLECTIVELY, “REGIONS”) ARE REGISTERED MUNICIPAL ADVISORS NOR PROVIDE ADVICE TO MUNICIPAL ENTITIES OR OBLIGATED PERSONS WITH RESPECT TO MUNICIPAL FINANCIAL PRODUCTS OR THE ISSUANCE OF MUNICIPAL SECURITIES (INCLUDING REGARDING THE STRUCTURE, TIMING, TERMS AND SIMILAR MATTERS CONCERNING MUNICIPAL FINANCIAL PRODUCTS OR MUNICIPAL SECURITIES ISSUANCES) OR ENGAGE IN THE SOLICITATION OF MUNICIPAL ENTITIES OR OBLIGATED PERSONS FOR SUCH SERVICES. WITH RESPECT TO THIS PRESENTATION AND ANY OTHER INFORMATION, MATERIALS OR COMMUNICATIONS PROVIDED BY REGIONS, (A) REGIONS IS NOT RECOMMENDING AN ACTION TO ANY MUNICIPAL ENTITY OR OBLIGATED PERSON, (B) REGIONS IS NOT ACTING AS AN ADVISOR TO ANY MUNICIPAL ENTITY OR OBLIGATED PERSON AND DOES NOT OWE A FIDUCIARY DUTY PURSUANT TO SECTION 15B OF THE SECURITIES EXCHANGE ACT OF 1934 TO ANY MUNICIPAL ENTITY OR OBLIGATED PERSON WITH RESPECT TO SUCH PRESENTATION, INFORMATION, MATERIALS OR COMMUNICATIONS, (C) REGIONS IS ACTING FOR ITS OWN INTERESTS, AND (D) YOU SHOULD DISCUSS THIS PRESENTATION AND ANY SUCH OTHER INFORMATION, MATERIALS OR COMMUNICATIONS WITH ANY AND ALL INTERNAL AND EXTERNAL ADVISORS AND EXPERTS THAT YOU DEEM APPROPRIATE BEFORE ACTING ON THIS PRESENTATION OR ANY SUCH OTHER INFORMATION, MATERIALS OR COMMUNICATIONS.
SOURCE: BLOOMBERG INDEX SERVICES LIMITED. BLOOMBERG® IS A TRADEMARK AND SERVICE MARK OF BLOOMBERG FINANCE L.P. AND ITS AFFILIATES (COLLECTIVELY “BLOOMBERG”). BARCLAYS® IS A TRADEMARK AND SERVICE MARK OF BARCLAYS BANK PLC (COLLECTIVELY WITH ITS AFFILIATES, “BARCLAYS”), USED UNDER LICENSE. BLOOMBERG OR BLOOMBERG’S LICENSORS, INCLUDING BARCLAYS, OWN ALL PROPRIETARY RIGHTS IN THE BLOOMBERG BARCLAYS INDICES. NEITHER BLOOMBERG NOR BARCLAYS APPROVES OR ENDORSES THIS MATERIAL OR GUARANTEES THE ACCURACY OR COMPLETENESS OF ANY INFORMATION HEREIN, OR MAKES ANY WARRANTY, EXPRESS OR IMPLIED, AS TO THE RESULTS TO BE OBTAINED THEREFROM AND, TO THE MAXIMUM EXTENT ALLOWED BY LAW, NEITHER SHALL HAVE ANY LIABILITY OR RESPONSIBILITY FOR INJURY OR DAMAGES ARISING IN CONNECTION THEREWITH.