Stocks: U.S. Large Cap Stocks Expand Their Year-To-Date Lead Versus Small-Caps As Economic Growth Concerns Mount; Euro Area Equities A Tough Place To Put Capital To Work With Political Uncertainty On The Rise; India, Taiwan Boost Emerging Markets
Download Weekly Market Commentary | June 17 2024
What We’re Watching:
- May retail sales are released Tuesday and are expected to have risen 0.3% month over month after a flat reading in April relative to March. Markets will be watching closely for hints that consumers are wavering.
- U.S. Purchasing Managers Index (PMI) for June is released Friday. Manufacturing PMI is expected to fall to 50.7 from 51.3 in May, while Services PMI is expected to be unchanged month over month at 54.8. A reading above 50 indicates expansion or growth, below 50 contraction.
Key Observations
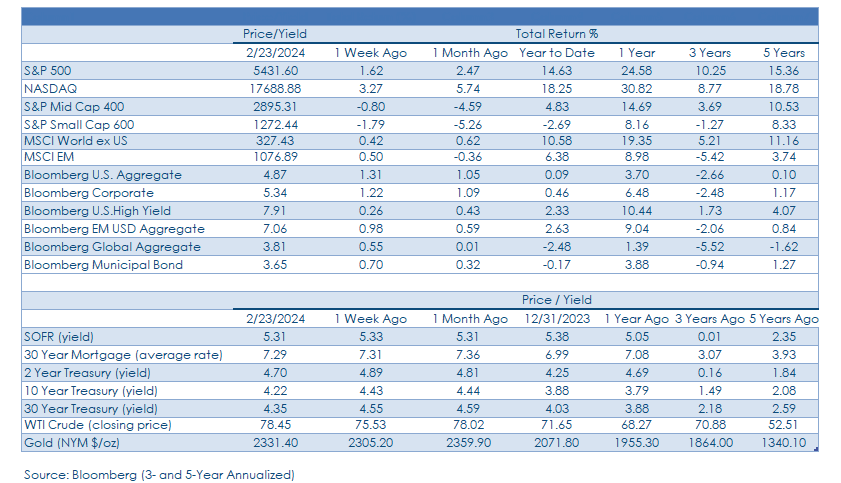
- Tame inflation data and falling Treasury yields pushed large cap U.S. stocks to a series of new closing highs over the balance of the week but falling yields could be signaling economic troubles on the horizon. Fears of an imminent economic slowdown appear overblown, but concerns surrounding a slow-growth backdrop materializing will likely continue to benefit large cap stocks (S&P 500) relative to small and mid-cap (SMid) for the foreseeable future.
- Euro area equity indices sold off as investors moved to the sidelines and sovereign bond yields rose across the pond due to heightened political risk in the lead-up to snap elections in France later this month. Less restrictive monetary policy in the euro area is a positive development, but political dysfunction/ uncertainty will likely act as a powerful near-term headwind for economic growth and corporate profits across the pond.
- Treasuries had a good week as inflation data cooled in May and Treasury auctions were very well received with buyers from abroad eager to snap up 10- and 30-year bonds, which pushed yields sharply lower. The drop in yields on long- dated Treasuries is welcome news for bond investors, but the magnitude of the move appears to be due to rising fears that policymakers (FOMC) are behind the rate-cutting curve and that an economic slowdown is on the horizon.
What Happened Last Week:
Stocks: U.S. Large Cap Stocks Expand Their Year-To-Date Lead Versus Small-Caps As Economic Growth Concerns Mount; Euro Area Equities A Tough Place To Put Capital To Work With Political Uncertainty On The Rise; India, Taiwan Boost Emerging Markets
The Large Cap Rally Rolls On, But Breadth / Participation Remains Lackluster. The S&P 500 ended the week with a 1.6% gain after closing Monday through Thursday at a new all-time high. However, under the surface there are some cracks worth watching that could signal a tired market in need of a breather. Specifically, sector leadership remains quite narrow as the information technology sector, which turned out a 6% gain last week, was the only S&P 500 sector to outperform the broader index, although consumer discretionary and real estate came close but narrowly underperformed.
Small Caps Struggle As Fears Of An Economic Slowdown Weigh. Stocks on the lower end of the market cap spectrum continued to languish last week, evidenced by the S&P Small Cap 600 index falling 1.7%, and again underperforming the S&P 500. Early in the week, concerns surrounding regional banks weighed on the index as the SPDR S&P Regional Banking ETF (KRE) fell 2.0% in the first two days. Tame May CPI and PPI readings mid-week allowed the KRE and broader small cap index to recover before selling off into the weekend as market participants interpreted the sharp drop in Treasury yields to imply that U.S. economic growth could slow meaningfully, thus having an outsized negative impact on more economically sensitive small cap indices. The prospect of fewer FOMC rate cuts this year contributed to the pullback in regional banks as net-interest revenue could remain under pressure until rate cuts finally materialize. The S&P 600’s weekly drop is largely attributable to mounting economic growth fears, which could continue to weigh on this more economically sensitive index. While pessimism surrounding the U.S. economy appears overdone, near-term catalysts capable of turning the sentiment tide in favor of small caps are few and far between and the asset class may continue to lag until the FOMC signals that rate cuts are imminent.
Political Discourse Pressures Euro Area Equities. The Stoxx Europe 600 index fell 2.3% over the balance of last week as investors moved to the sidelines in advance of a snap election set to be held later this month in France, an event that could prove destabilizing for the euro area at large. We have grown more constructive on the outlook for euro area and U.K. equities in recent months as breadth/ participation has been broad-based and encouraging, and the ECB shifting to less restrictive monetary policy should be supportive of an improved economic outlook. However, with political uncertainty on the rise across the euro area in recent weeks and unlikely to abate any time soon, a wait-and-see approach is warranted and now isn’t the time to raise exposure to euro area stocks, specifically, or international developed markets.
Emerging Asia Propels Developing Market Indices To Weekly Gains. The MSCI Emerging Markets (EM) index turned out a modest 0.5% weekly gain, driven by continued upward price momentum in significant allocations to semiconductors and other AI-related beneficiaries trading at more attractive valuations than U.S.-based companies. India and Taiwan both closed at all-time highs last week, offsetting a lackluster week out of Chinese stocks as the country faced additional 38% tariffs levied by the EU targeting imported electric vehicles (EVs). Deglobalization and increasingly protectionist policies implemented by major economies highlights the importance of country selection when allocating capital in emerging markets. Latin American economies, specifically Brazil and Mexico, experienced a more lasting impact from a perceived uptick in political and fiscal tension, evidenced by a 2.7% loss for the Latin America 40 index ETF (ILF) on the week. Select countries in Latin America are oversold, but we’d prefer to let our active managers rebalance into these areas as they see fit rather than chase potential value traps.
Bonds: Treasury Yields Fall As May Inflation Data Comes In Below Expectations; Treasury Auctions Well Received, Met By Strong Demand From Abroad; FOMC Strikes A Surprisingly Hawkish Tone, Appears Out Of Sync Given Recent Inflation, Labor Market Readings.
Tame May Inflation Data Puts Downward Pressure On Long- Term Treasury Yields.. The Consumer Price Index (CPI) for May was released last Wednesday and provided stock and bond bulls with plenty to cheer about. Headline CPI was unchanged month over month, below expectations of a 0.1% rise, while core CPI, which excludes volatile food and energy prices, rose 0.2%, also modestly below the 0.3% expected. Year over year, headline CPI came in at 3.3% vs. 3.4% expected and core CPI rose 3.4% vs. the 3.5% estimate. The release of the May Producer Price Index (PPI) the following day also fell short of expectations and pointed toward a further easing of good prices over the coming months with PPI falling 0.2% month over month, well below the 0.1% estimate, and the year over year reading of 2.2% was also below the 2.5% estimate. Fed funds futures shifted on the heels of the tame CPI and PPI releases, with the odds of a 25-basis point rate cut in September rising to 65% from around 49% leading up to the CPI release on Wednesday. We have highlighted the 4.30% to 4.35% range on the 10-year yield as an important floor of support as a break below it would likely to call into question the outlook for U.S. economic growth. With CPI and PPI from May pointing toward inflationary pressures easing, and with initial and continuing jobless claims coming in above expectations, the 10-year yield fell 20-basis points over the balance of last week to close at 4.22%. A continued drop in Treasury yields farther out on the curve may not be cheered by investors in stocks as it would call into question the outlook for economic growth and corporate profits over the coming quarters.
10-Year Treasury Auction Well Received, Met By Strong Demand From Abroad. Last Tuesday, the U.S. Treasury auctioned off $39B of 10-year Treasury notes which was met by robust demand, evidenced by the when-issued yield coming in 2 basis points below where the 10-year was trading in the market at the time. Indirect bidders, primarily foreign central banks, took down just north of 74% of the issue, well above the average for recent auctions, while the dealer community only received 11.5% of the issue, a level below the average for recent auctions. Bond investors breathed a sigh of relief as last week’s 10-year auction provided evidence that foreign buyers are still willing and able to buy our debt and haven’t completely stepped away from buying U.S. Treasuries, despite recent news flow and chatter to the contrary. Limited supply, with the U.S. Treasury issuing heavily on the short end of the curve in recent months, has likely boosted the appeal of longer maturity offerings due to increased scarcity value. Conversely, recent auctions of shorter maturity bonds have been met with far less interest, putting upward pressure on yields in the belly (2 to 5-year portion) of the yield curve, a dynamic unlikely to shift until we see where Treasury plans to focus issuance in the 4th quarter.
FOMC Sends A Hawkish Message To Markets, Lowers Expectations For Rate Cuts Through Year-End. The FOMC concluded its two-day meeting last Wednesday, and the Committee’s updated Summary of Economic Projections as well as the overall tone of Chair Jerome Powell’s press conference leaned more hawkish than many Fed watchers anticipated. The FOMC’s dot-plot shifted from the March median expectation of three 25-basis point rate cuts in 2024 to just one cut, with most prognosticators expecting a more measured move down to two quarter-point cuts. For 2025, the dot-plot now points toward four quarter-point cuts, up from three in March. With both CPI and PPI coming in cooler than expected in May, and with initial and continuing jobless claims coming in above expectations and pointing toward more slack in the labor market, the FOMC’s hawkish tone doesn’t appear to be justified. This apparent disconnect has spurred fears the Committee is relying too much on stale data, and the sharp move lower in yields on long- dated U.S. Treasuries signals that market participants fear the Committee may already be behind the curve when it comes to making monetary policy less restrictive and that economic growth is destined to slow alongside inflation over the coming months. Our base case continues to call for the FOMC to cut the funds rate by 25-basis points in September, and the Committee should lay the groundwork to do so when it meets in late-July, assuming inflation data continues to point toward inflationary pressures easing.
IMPORTANT DISCLOSURES: THIS PUBLICATION HAS BEEN PREPARED BY THE STAFF OF HIGHLAND ASSOCIATES, INC. FOR DISTRIBUTION TO, AMONG OTHERS, HIGHLAND ASSOCIATES, INC. CLIENTS. HIGHLAND ASSOCIATES IS REGISTERED WITH THE UNITED STATES SECURITY AND EXCHANGE COMMISSION UNDER THE INVESTMENT ADVISORS ACT OF 1940. HIGHLAND ASSOCIATES IS A WHOLLY OWNED SUBSIDIARY OF REGIONS BANK, WHICH IN TURN IS A WHOLLY OWNED SUBSIDIARY OF REGIONS FINANCIAL CORPORATION. RESEARCH SERVICES ARE PROVIDED THROUGH MULTI-ASSET SOLUTIONS, A DEPARTMENT OF THE REGIONS ASSET MANAGEMENT BUSINESS GROUP WITHIN REGIONS BANK. THE INFORMATION AND MATERIAL CONTAINED HEREIN IS PROVIDED SOLELY FOR GENERAL INFORMATION PURPOSES ONLY. TO THE EXTENT THESE MATERIALS REFERENCE REGIONS BANK DATA, SUCH MATERIALS ARE NOT INTENDED TO BE REFLECTIVE OR INDICATIVE OF, AND SHOULD NOT BE RELIED UPON AS, THE RESULTS OF OPERATIONS, FINANCIAL CONDITIONS OR PERFORMANCE OF REGIONS BANK. UNLESS OTHERWISE SPECIFICALLY STATED, ANY VIEWS, OPINIONS, ANALYSES, ESTIMATES AND STRATEGIES, AS THE CASE MAY BE (“VIEWS”), EXPRESSED IN THIS CONTENT ARE THOSE OF THE RESPECTIVE AUTHORS AND SPEAKERS NAMED IN THOSE PIECES AND MAY DIFFER FROM THOSE OF REGIONS BANK AND/OR OTHER REGIONS BANK EMPLOYEES AND AFFILIATES. VIEWS AND ESTIMATES CONSTITUTE OUR JUDGMENT AS OF THE DATE OF THESE MATERIALS, ARE OFTEN BASED ON CURRENT MARKET CONDITIONS, AND ARE SUBJECT TO CHANGE WITHOUT NOTICE. ANY EXAMPLES USED ARE GENERIC, HYPOTHETICAL AND FOR ILLUSTRATION PURPOSES ONLY. ANY PRICES/QUOTES/STATISTICS INCLUDED HAVE BEEN OBTAINED FROM SOURCES BELIEVED TO BE RELIABLE, BUT HIGHLAND ASSOCIATES, INC. DOES NOT WARRANT THEIR COMPLETENESS OR ACCURACY. THIS INFORMATION IN NO WAY CONSTITUTES RESEARCH AND SHOULD NOT BE TREATED AS SUCH. THE VIEWS EXPRESSED HEREIN SHOULD NOT BE CONSTRUED AS INDIVIDUAL INVESTMENT ADVICE FOR ANY PARTICULAR PERSON OR ENTITY AND ARE NOT INTENDED AS RECOMMENDATIONS OF PARTICULAR SECURITIES, FINANCIAL INSTRUMENTS, STRATEGIES OR BANKING SERVICES FOR A PARTICULAR PERSON OR ENTITY. THE NAMES AND MARKS OF OTHER COMPANIES OR THEIR SERVICES OR PRODUCTS MAY BE THE TRADEMARKS OF THEIR OWNERS AND ARE USED ONLY TO IDENTIFY SUCH COMPANIES OR THEIR SERVICES OR PRODUCTS AND NOT TO INDICATE ENDORSEMENT, SPONSORSHIP, OR OWNERSHIP BY REGIONS OR HIGHLAND ASSOCIATES. EMPLOYEES OF HIGHLAND ASSOCIATES, INC., MAY HAVE POSITIONS IN SECURITIES OR THEIR DERIVATIVES THAT MAY BE MENTIONED IN THIS REPORT. ADDITIONALLY, HIGHLAND’S CLIENTS AND COMPANIES AFFILIATED WITH HIGHLAND ASSOCIATES MAY HOLD POSITIONS IN THE MENTIONED COMPANIES IN THEIR PORTFOLIOS OR STRATEGIES. THIS MATERIAL DOES NOT CONSTITUTE AN OFFER OR AN INVITATION BY OR ON BEHALF OF HIGHLAND ASSOCIATES TO ANY PERSON OR ENTITY TO BUY OR SELL ANY SECURITY OR FINANCIAL INSTRUMENT OR ENGAGE IN ANY BANKING SERVICE. NOTHING IN THESE MATERIALS CONSTITUTES INVESTMENT, LEGAL, ACCOUNTING OR TAX ADVICE. NON-DEPOSIT PRODUCTS INCLUDING INVESTMENTS, SECURITIES, MUTUAL FUNDS, INSURANCE PRODUCTS, CRYPTO ASSETS AND ANNUITIES: ARE NOT FDIC-INSURED I ARE NOT A DEPOSIT I MAY GO DOWN IN VALUE I ARE NOT BANK GUARANTEED I ARE NOT INSURED BY ANY FEDERAL GOVERNMENT AGENCY I ARE NOT A CONDITION OF ANY BANKING ACTIVITY.
NEITHER REGIONS BANK NOR REGIONS ASSET MANAGEMENT (COLLECTIVELY, “REGIONS”) ARE REGISTERED MUNICIPAL ADVISORS NOR PROVIDE ADVICE TO MUNICIPAL ENTITIES OR OBLIGATED PERSONS WITH RESPECT TO MUNICIPAL FINANCIAL PRODUCTS OR THE ISSUANCE OF MUNICIPAL SECURITIES (INCLUDING REGARDING THE STRUCTURE, TIMING, TERMS AND SIMILAR MATTERS CONCERNING MUNICIPAL FINANCIAL PRODUCTS OR MUNICIPAL SECURITIES ISSUANCES) OR ENGAGE IN THE SOLICITATION OF MUNICIPAL ENTITIES OR OBLIGATED PERSONS FOR SUCH SERVICES. WITH RESPECT TO THIS PRESENTATION AND ANY OTHER INFORMATION, MATERIALS OR COMMUNICATIONS PROVIDED BY REGIONS, (A) REGIONS IS NOT RECOMMENDING AN ACTION TO ANY MUNICIPAL ENTITY OR OBLIGATED PERSON, (B) REGIONS IS NOT ACTING AS AN ADVISOR TO ANY MUNICIPAL ENTITY OR OBLIGATED PERSON AND DOES NOT OWE A FIDUCIARY DUTY PURSUANT TO SECTION 15B OF THE SECURITIES EXCHANGE ACT OF 1934 TO ANY MUNICIPAL ENTITY OR OBLIGATED PERSON WITH RESPECT TO SUCH PRESENTATION, INFORMATION, MATERIALS OR COMMUNICATIONS, (C) REGIONS IS ACTING FOR ITS OWN INTERESTS, AND (D) YOU SHOULD DISCUSS THIS PRESENTATION AND ANY SUCH OTHER INFORMATION, MATERIALS OR COMMUNICATIONS WITH ANY AND ALL INTERNAL AND EXTERNAL ADVISORS AND EXPERTS THAT YOU DEEM APPROPRIATE BEFORE ACTING ON THIS PRESENTATION OR ANY SUCH OTHER INFORMATION, MATERIALS OR COMMUNICATIONS.
SOURCE: BLOOMBERG INDEX SERVICES LIMITED. BLOOMBERG® IS A TRADEMARK AND SERVICE MARK OF BLOOMBERG FINANCE L.P. AND ITS AFFILIATES (COLLECTIVELY “BLOOMBERG”). BARCLAYS® IS A TRADEMARK AND SERVICE MARK OF BARCLAYS BANK PLC (COLLECTIVELY WITH ITS AFFILIATES, “BARCLAYS”), USED UNDER LICENSE. BLOOMBERG OR BLOOMBERG’S LICENSORS, INCLUDING BARCLAYS, OWN ALL PROPRIETARY RIGHTS IN THE BLOOMBERG BARCLAYS INDICES. NEITHER BLOOMBERG NOR BARCLAYS APPROVES OR ENDORSES THIS MATERIAL OR GUARANTEES THE ACCURACY OR COMPLETENESS OF ANY INFORMATION HEREIN, OR MAKES ANY WARRANTY, EXPRESS OR IMPLIED, AS TO THE RESULTS TO BE OBTAINED THEREFROM AND, TO THE MAXIMUM EXTENT ALLOWED BY LAW, NEITHER SHALL HAVE ANY LIABILITY OR RESPONSIBILITY FOR INJURY OR DAMAGES ARISING IN CONNECTION THEREWITH.