Stocks: Japanese Equities Trade To New Highs As Tariffs Improve Sentiment For Trade Negotiations Across The Globe, While Domestic Equities Broaden As Earnings Face-Off Against Valuations.
Download Weekly Market Commentary | July 28 2025
What We’re Watching:
- The Job Openings and Labor Turnover Survey (JOLTS) data for June is due out on Tuesday, with forecasted job openings at 7425k, lower than the prior month reading. The Quits rate is an area to monitor as an action-based gauge of how workers are viewing their ability to ‘trade up’ in the current job market.
- Onlookers get their first look at second quarter U.S. GDP on Wednesday with consensus estimates at 2.4% up from last quarter at -0.5%, and the FOMC concludes their meeting with markets expecting the committee to hold rates.
- U.S. Nonfarm Payrolls come out on Friday, with the July number anticipated to show 110K jobs added in July, a slowdown from the June data upside surprise of 147K jobs added. Another upside surprise here could reaffirm resilience in the labor market.
Key Observations
- News of a trade agreement between the U.S. and Japan sparked a rally in international developed equites, with Japan’s Tokyo Stock Exchange making new highs and leading the MSCI EAFE to outpace the S&P 500 even as sector rotation came to fruition and breadth improved domestically.
- Fixed income indices made marginal gains even as rates ticked higher after movement on the trade front and positive labor data in the U.S. improved the outlook for domestic growth, boosting below investment grade corporates in the process.
- Positive surprises in both initial jobless claims and S&P Composite PMIs were overshadowed by catchier macro stories around trade but both further support the narrative around resiliency in the U.S. economy that markets have been pricing in since the start of July.
What Happened Last Week:
Stocks: Japanese Equities Trade To New Highs As Tariffs Improve Sentiment For Trade Negotiations Across The Globe, While Domestic Equities Broaden As Earnings Face-Off Against Valuations.
Japanese Equities Make New Highs On Trade Agreement With The USA. On Wednesday markets got word that the U.S. and Japan came to terms on a trade agreement that leave U.S. import levies at 15% with a commitment to $550B in new investments stateside. That landmark deal outpaced market expectations based on the price reaction, leading the MSCI Japan to a 3.6% gain on Wednesday alone, the fourth most successful trading day in the last 12-months and marking a 4.6% advance on the week. Those gains amount to a fresh all-time high for Japan’s Tokyo Stock Exchange index (TOPIX), above the prior peak in June of 2024. Part of the positive surprise stems from markets anchoring to the 20% tariff placed on Vietnam, as consensus appeared to be mapping that deal to other countries with a trade surplus to the United States. Based on comments from Treasury Secretary Scott Bessent, Japan was able to get their tariff level lower by their “innovative financing mechanism” to invest new dollars in the United States.
International Stocks Strengthen As Trade Sentiment Spills Over. Signs of better sentiment abroad were present even before lower Japanese tariffs came to fruition midway through last week, as foreign developed equities started on the right foot with the dollar retracing lower. In the week prior the dollar made a run at its 50-day moving average, before being turned away at $98.76, creating fresh resistance for the greenback and breathing new life into foreign equities last week. Undoubtedly the Japan trade deal improved market expectations of a favorable deal with Europe and China as the MSCI Eurozone index and MSCI China index both ended up higher by 2.0% and 2.8% in dollar terms on the week. Developed equities outpaced emerging markets with the MSCI EAFE gaining 1.9% in part due to its largest country weight being Japan at 21.5%, while the MSCI Emerging Markets Equity index returned roughly half that at 0.7%.
Domestic Equities Broaden, As Earnings Confront Valuations. U.S. stocks made a more measured advance as the S&P 500 gained 1.5%, and underneath the hood value centric sectors like real estate and healthcare led while technology was among the worst performing sectors on the week. That preference for value has been the product of cheap valuations colliding with positive earnings surprises, while areas like technology already hold rich valuations that are already priced for above consensus earnings. In an environment where valuations already have optimism priced in, it’s unsurprising the S&P 500 equal weight with a forward price-to-earnings (PE) ratio of 16.5x had an easier time exceeding expectations relative to the NASDAQ 100 with a forward PE ratio of 26.2x. Alphabet was able to buck the trend in the NASDAQ 100, advancing by 4.4% last week after beating on sales and earnings estimates, while citing an uptick in artificial intelligence (AI) demand that requires a ramp up in CAPEX. The other Magnificent 7 company reporting last week was Tesla, and the results were less inspiring as the company’s steep valuation ran into the rocks with its third consecutive earnings miss that was delivered alongside disappointing guidance from CEO Elon Musk. Next week tech giants Apple and Microsoft report in, giving investors more insight around developments into artificial intelligence.
Bonds: Trade Deal And Economic Data Keeping A Floor Under Rates With Capped Credit Spreads; ECB Ends Easing Cycle and Outlook For Growth In Japan Jolts Yields.
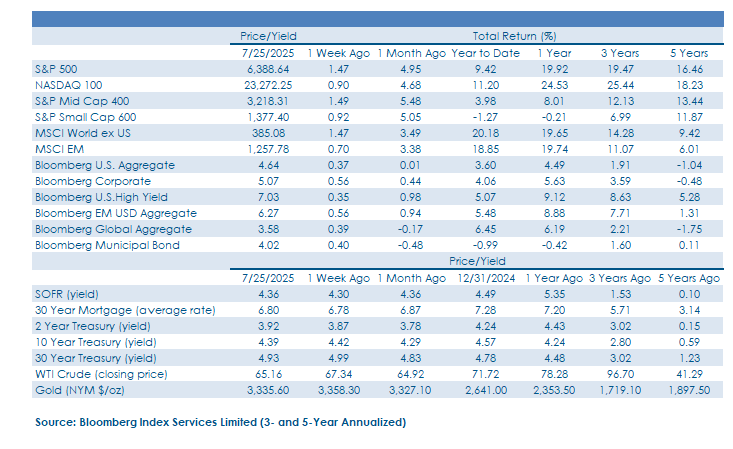
Rates And The Dollar Downshift Before Trade Deal And Claims Data Sparked Reversion. Early in the week bonds rallied and the dollar drifted lower in consolidation before the trade deal with Japan and initial jobless claims came in below consensus estimate and the prior month reading at 217k. The surprise in jobless claims is a continuation of the stable labor trends we’ve seen in recent months, prompting rates to shift marginally higher, with the 10-year ending the week at 4.42%. Next week, we get a swath of labor data including JOLTS, nonfarm payrolls, and Challenger Job Cuts. Core bonds managed to eke out a 0.4% gain on the week even with the tick up in rates, on par with lower quality credit, as the Bloomberg High Yield Corporate index returned 0.4%. Below investment grade issuance for July is on track to outpace prior July sales for each of the last three years, but rampant demand is driving spreads tighter with valuations narrowing 9bps last week as earnings and trade developments boost sentiment.
ECB Ends Easing Cycle, Holding Rates As Economic Growth Holds Up. After cutting the policy rate in each meeting since last September, the European Central Bank elected to pause their easing cycle at the prevailing 2% deposit rate, marking a 175bps decline over the last year. The lack of movement at the July meeting was broadly anticipated by market estimates as economic growth projections in the eurozone appear stable and the likelihood of a dire trade scenario has diminished. All in, consensus projections around economic growth are far from inspiring with a negative GDP print expected for the second quarter that flattens out over the balance of 2025 before re-accelerating to trend growth in the back half of 2026. Taking the flat near-term growth expectations into account, another rate cut could be in the cards in the coming quarters but based on futures market pricing odds of movement prior to December are well below 50%.
Trade Resolution Lifts Japanese Bond Yields And Emerging Bonds Capitalize On Currency Shifts. Rates on Japanese government bonds shifted higher by 8bps or 5% with 10-year yields landing at 1.60% as better-than-feared U.S. tariffs reignited growth expectations for the country’s export-focused economy. After hedging back to the dollar, that yield comes across to U.S. investors at a more enticing 5.8% on the 10-year tenor but a staggering 240% debt to GDP ratio with stickier inflation adds valuable context to the risks incorporated in that yield. Emerging market bonds were one of the top gainers last week in fixed income, outpacing US high yield and investment grade credit, with a total return of 0.6% for the Bloomberg EM USD Aggregate Bond index as emerging currencies rallied on trade optimism. The currency advance coincides with the latest trade agreement and strikes us as a belief that favorable deals could be on the way for major emerging markets like India, China, and Mexico.
IMPORTANT DISCLOSURES: THIS PUBLICATION HAS BEEN PREPARED BY THE STAFF OF HIGHLAND ASSOCIATES, INC. FOR DISTRIBUTION TO, AMONG OTHERS, HIGHLAND ASSOCIATES, INC. CLIENTS. HIGHLAND ASSOCIATES IS REGISTERED WITH THE UNITED STATES SECURITY AND EXCHANGE COMMISSION UNDER THE INVESTMENT ADVISORS ACT OF 1940. HIGHLAND ASSOCIATES IS A WHOLLY OWNED SUBSIDIARY OF REGIONS BANK, WHICH IN TURN IS A WHOLLY OWNED SUBSIDIARY OF REGIONS FINANCIAL CORPORATION. RESEARCH SERVICES ARE PROVIDED THROUGH MULTI-ASSET SOLUTIONS, A DEPARTMENT OF THE REGIONS ASSET MANAGEMENT BUSINESS GROUP WITHIN REGIONS BANK. THE INFORMATION AND MATERIAL CONTAINED HEREIN IS PROVIDED SOLELY FOR GENERAL INFORMATION PURPOSES ONLY. TO THE EXTENT THESE MATERIALS REFERENCE REGIONS BANK DATA, SUCH MATERIALS ARE NOT INTENDED TO BE REFLECTIVE OR INDICATIVE OF, AND SHOULD NOT BE RELIED UPON AS, THE RESULTS OF OPERATIONS, FINANCIAL CONDITIONS OR PERFORMANCE OF REGIONS BANK. UNLESS OTHERWISE SPECIFICALLY STATED, ANY VIEWS, OPINIONS, ANALYSES, ESTIMATES AND STRATEGIES, AS THE CASE MAY BE (“VIEWS”), EXPRESSED IN THIS CONTENT ARE THOSE OF THE RESPECTIVE AUTHORS AND SPEAKERS NAMED IN THOSE PIECES AND MAY DIFFER FROM THOSE OF REGIONS BANK AND/OR OTHER REGIONS BANK EMPLOYEES AND AFFILIATES. VIEWS AND ESTIMATES CONSTITUTE OUR JUDGMENT AS OF THE DATE OF THESE MATERIALS, ARE OFTEN BASED ON CURRENT MARKET CONDITIONS, AND ARE SUBJECT TO CHANGE WITHOUT NOTICE. ANY EXAMPLES USED ARE GENERIC, HYPOTHETICAL AND FOR ILLUSTRATION PURPOSES ONLY. ANY PRICES/QUOTES/STATISTICS INCLUDED HAVE BEEN OBTAINED FROM SOURCES BELIEVED TO BE RELIABLE, BUT HIGHLAND ASSOCIATES, INC. DOES NOT WARRANT THEIR COMPLETENESS OR ACCURACY. THIS INFORMATION IN NO WAY CONSTITUTES RESEARCH AND SHOULD NOT BE TREATED AS SUCH. THE VIEWS EXPRESSED HEREIN SHOULD NOT BE CONSTRUED AS INDIVIDUAL INVESTMENT ADVICE FOR ANY PARTICULAR PERSON OR ENTITY AND ARE NOT INTENDED AS RECOMMENDATIONS OF PARTICULAR SECURITIES, FINANCIAL INSTRUMENTS, STRATEGIES OR BANKING SERVICES FOR A PARTICULAR PERSON OR ENTITY. THE NAMES AND MARKS OF OTHER COMPANIES OR THEIR SERVICES OR PRODUCTS MAY BE THE TRADEMARKS OF THEIR OWNERS AND ARE USED ONLY TO IDENTIFY SUCH COMPANIES OR THEIR SERVICES OR PRODUCTS AND NOT TO INDICATE ENDORSEMENT, SPONSORSHIP, OR OWNERSHIP BY REGIONS OR HIGHLAND ASSOCIATES. EMPLOYEES OF HIGHLAND ASSOCIATES, INC., MAY HAVE POSITIONS IN SECURITIES OR THEIR DERIVATIVES THAT MAY BE MENTIONED IN THIS REPORT. ADDITIONALLY, HIGHLAND’S CLIENTS AND COMPANIES AFFILIATED WITH HIGHLAND ASSOCIATES MAY HOLD POSITIONS IN THE MENTIONED COMPANIES IN THEIR PORTFOLIOS OR STRATEGIES. THIS MATERIAL DOES NOT CONSTITUTE AN OFFER OR AN INVITATION BY OR ON BEHALF OF HIGHLAND ASSOCIATES TO ANY PERSON OR ENTITY TO BUY OR SELL ANY SECURITY OR FINANCIAL INSTRUMENT OR ENGAGE IN ANY BANKING SERVICE. NOTHING IN THESE MATERIALS CONSTITUTES INVESTMENT, LEGAL, ACCOUNTING OR TAX ADVICE. NON-DEPOSIT PRODUCTS INCLUDING INVESTMENTS, SECURITIES, MUTUAL FUNDS, INSURANCE PRODUCTS, CRYPTO ASSETS AND ANNUITIES: ARE NOT FDIC-INSURED I ARE NOT A DEPOSIT I MAY GO DOWN IN VALUE I ARE NOT BANK GUARANTEED I ARE NOT INSURED BY ANY FEDERAL GOVERNMENT AGENCY I ARE NOT A CONDITION OF ANY BANKING ACTIVITY.
NEITHER REGIONS BANK NOR REGIONS ASSET MANAGEMENT (COLLECTIVELY, “REGIONS”) ARE REGISTERED MUNICIPAL ADVISORS NOR PROVIDE ADVICE TO MUNICIPAL ENTITIES OR OBLIGATED PERSONS WITH RESPECT TO MUNICIPAL FINANCIAL PRODUCTS OR THE ISSUANCE OF MUNICIPAL SECURITIES (INCLUDING REGARDING THE STRUCTURE, TIMING, TERMS AND SIMILAR MATTERS CONCERNING MUNICIPAL FINANCIAL PRODUCTS OR MUNICIPAL SECURITIES ISSUANCES) OR ENGAGE IN THE SOLICITATION OF MUNICIPAL ENTITIES OR OBLIGATED PERSONS FOR SUCH SERVICES. WITH RESPECT TO THIS PRESENTATION AND ANY OTHER INFORMATION, MATERIALS OR COMMUNICATIONS PROVIDED BY REGIONS, (A) REGIONS IS NOT RECOMMENDING AN ACTION TO ANY MUNICIPAL ENTITY OR OBLIGATED PERSON, (B) REGIONS IS NOT ACTING AS AN ADVISOR TO ANY MUNICIPAL ENTITY OR OBLIGATED PERSON AND DOES NOT OWE A FIDUCIARY DUTY PURSUANT TO SECTION 15B OF THE SECURITIES EXCHANGE ACT OF 1934 TO ANY MUNICIPAL ENTITY OR OBLIGATED PERSON WITH RESPECT TO SUCH PRESENTATION, INFORMATION, MATERIALS OR COMMUNICATIONS, (C) REGIONS IS ACTING FOR ITS OWN INTERESTS, AND (D) YOU SHOULD DISCUSS THIS PRESENTATION AND ANY SUCH OTHER INFORMATION, MATERIALS OR COMMUNICATIONS WITH ANY AND ALL INTERNAL AND EXTERNAL ADVISORS AND EXPERTS THAT YOU DEEM APPROPRIATE BEFORE ACTING ON THIS PRESENTATION OR ANY SUCH OTHER INFORMATION, MATERIALS OR COMMUNICATIONS.
SOURCE: BLOOMBERG INDEX SERVICES LIMITED. BLOOMBERG® IS A TRADEMARK AND SERVICE MARK OF BLOOMBERG FINANCE L.P. AND ITS AFFILIATES (COLLECTIVELY “BLOOMBERG”). BARCLAYS® IS A TRADEMARK AND SERVICE MARK OF BARCLAYS BANK PLC (COLLECTIVELY WITH ITS AFFILIATES, “BARCLAYS”), USED UNDER LICENSE. BLOOMBERG OR BLOOMBERG’S LICENSORS, INCLUDING BARCLAYS, OWN ALL PROPRIETARY RIGHTS IN THE BLOOMBERG BARCLAYS INDICES. NEITHER BLOOMBERG NOR BARCLAYS APPROVES OR ENDORSES THIS MATERIAL OR GUARANTEES THE ACCURACY OR COMPLETENESS OF ANY INFORMATION HEREIN, OR MAKES ANY WARRANTY, EXPRESS OR IMPLIED, AS TO THE RESULTS TO BE OBTAINED THEREFROM AND, TO THE MAXIMUM EXTENT ALLOWED BY LAW, NEITHER SHALL HAVE ANY LIABILITY OR RESPONSIBILITY FOR INJURY OR DAMAGES ARISING IN CONNECTION THEREWITH.