Stocks: Downward Bias To Prices As Interest Rates Rise In Holiday- Shortened Trading Week.
Download Weekly Market Commentary | July 10 2023
Key Observations:
- Profit-taking hits stocks in holiday-shortened week as sovereign bond yields rise, but we wouldn’t read too much into last week’s price action as trading volume was exceedingly low.
- Hopes for an economic soft-landing fade somewhat as market participants price-in additional hikes to the Fed funds rate between July and year-end as the labor market remains tight.
- Treasury yields rise, remain volatile as labor market strength is expected to embolden the Fed to tighten monetary policy further over coming months.
- Investment grade and high yield corporates sell off as Treasury yields rise on the week but both segments of the fixed income market still held up relatively well versus the Aggregate Bond index as higher yields cushion the blow.
What We’re Watching:
- U.S. Consumer Price Index (CPI) for June is released Wednesday. Headline CPI is expected to rise 3.1% year over year during the month, down from 4.0% in May, and 0.3% month over month, a modest acceleration from 0.1% the prior month. Core CPI, which excludes food and energy, is expected to rise 5.0% year over year, again, a deceleration from 5.3% in May, while month over month core is expected to rise 0.3%, just shy of the 0.4% reading from the prior month.
- U.S. Producer Price Index (PPI) for June is released Thursday and is expected to have risen 0.2% month over month, above the May reading of -0.3%, and 0.4% year over year, below the 1.1% reading from May.
- The University of Michigan releases its Consumer Sentiment index for July on Friday, which is expected to improve modestly to 65.5 from a 64.4 reading in June.
What Happened Last Week:
Stocks: Downward Bias To Prices As Interest Rates Rise In Holiday- Shortened Trading Week.
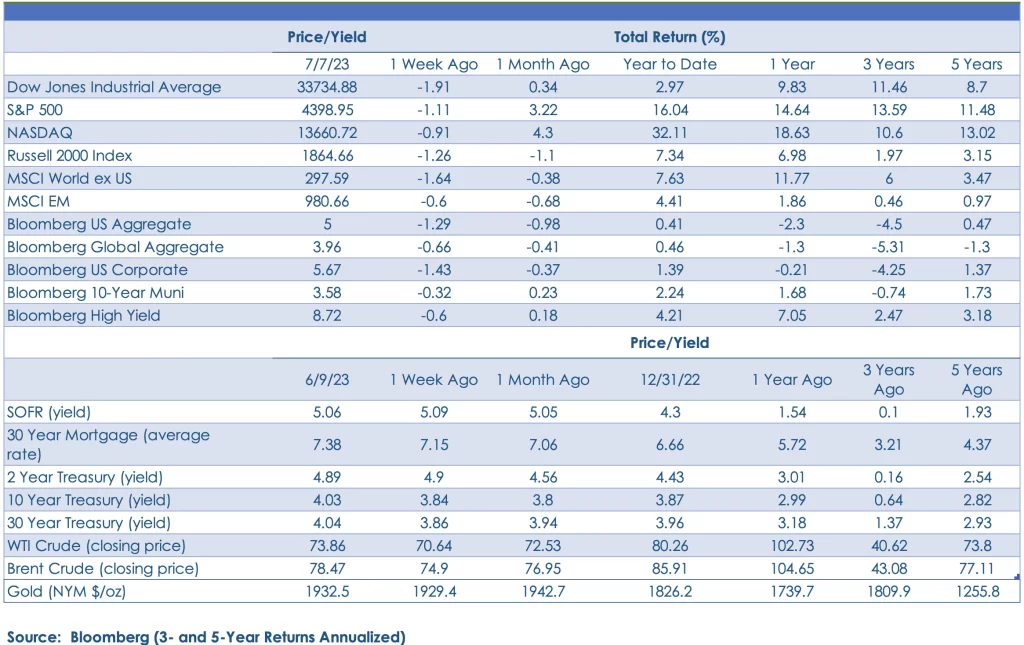
The S&P 500 ended last week lower by 1.1% and the small-cap Russell 2000 gave back 1.2% as the holiday- shortened trading week was characterized by low trading volume. Continued strength in the labor market data from June was viewed as emboldening for the Federal Open Market Committee (FOMC) to hike interest rates further over coming months and threw cold water on growing optimism surrounding an economic soft landing in the U.S. In short, good news on the economic front was viewed as bad news for stocks due to what it implies regarding the path forward for monetary policy. After outperforming large-caps during June, small-cap stocks took a breather as labor market resilience forced Treasury yields higher on the week and led to profit-taking in small- and mid-cap (SMid) stocks. Given last week’s low trading volume and conflicting, if not confounding sector leadership profile, we hesitate to take too much away from last week’s price action and will be looking to this week’s inflation data to give us clues as to where stocks may be headed over the back-half of July and into what has historically been a seasonally week stretch in the calendar.
Sector Leadership A Mixed Bag.
Communication services, real estate and utilities outperformed the S&P 500 on the week, while consumer discretionary, health care and materials were notable laggards. The utilities sector outperforming on the week is notable, particularly given that the sector often trades poorly as yields on Treasury bonds rise as they did last week. The materials sector stood out, but for less positive reasons as it fell 2.3% on the week as metals, mining and steel stocks took it on the chin as the U.S. dollar strengthened and manufacturing data out of China again fell short of expectations, stoking demand fears.
S&P 500 Levels Worth Watching.
The S&P 500 broke below 4,400 last Thursday and after trading on either side of that round number ended the week just below it at 4,398. 4,400 doesn’t mean much from a technical perspective, other than its a round number, and should bears attempt to press positions and force equity prices lower over the coming week(s), the 4,325/4,330 area could be the next level/range worth watching. Below that, the S&P 500’s 50-day moving average of 4,250 is likely a more important floor of support that needs to hold.
U.K., Eurozone Equities Struggle To Digest Higher Sovereign Bond Yields.
Yields on sovereign bonds in the U.K. and euro area continued to rise over the balance of last week, contributing to declines for developed market stocks abroad. The MSCI EAFE index fell 2.1% on the week, pulled lower by weakness out of the U.K. and broad-based declines across the euro area as well. The MSCI U.K. index, specifically, declined 2.4% on the week and is now lower by 3.4% since mid-June as yields on long-term U.K. gilts have approached levels last seen in late 2022 when U.K. pensions were on the brink of collapse due to a rapid rise in yields. While Japan has carried the leadership baton for developed markets abroad over the past three months as capital has rotated out of the U.K. and euro area, the MSCI EAFE has substantially lagged both the S&P 500 and small-cap Russell 2000 index, and an overweight to the U.S. versus the rest of the world remains out preferred positioning at present.
Money Market Fund Assets Remain Elevated And Are A Potential Catalyst For Additional Equity Upside.
Even after declining modestly over the past month, money market fund assets total around $5.4T and have been holding steady over recent weeks. While the June rally in the S&P 500 and small-cap Russell 2000 exhibited some signs of panic buying as a fear of missing out kicked in, if FOMO really ramps in the back-half of this year as underperforming managers chase returns, there undoubtedly remains ample fuel/liquidity parked in cash to drive additional, potentially sizable gains. With that said, we expect the near- term backdrop for stocks to be a rocky one as interest rates plumb year-to-date highs and seasonality becomes a headwind starting in the back-half of July through September.
Bonds: Yields Rise As Solid Payrolls Growth Implies More Monetary Policy Tightening Ahead.
The 2-year U.S. Treasury yield hit 5.10% intra-day on Thursday, its highest level since June of 2007, before closing the week at 4.95%. The 2-year yield garnered headlines and investor attention due primarily to the speed at which it has risen, as it ended May at 4.40%. Not to be overlooked, the yield on the 10-year U.S. Treasury bond ended last week at 4.07%, just 1 basis point shy of its year-to-date high made prior to the collapse of SVB. Should the 10-year yield break above it’s year- to-date high of 4.08% this week, 4.25%, the October of 2022 closing high yield, becomes the next level worth watching, and above 4.35% additional resistance levels become difficult to identify. A combination of rising sovereign bond yields across Europe, primarily in the U.K., and concerns surrounding how much appetite central banks in China and Japan might have for the forthcoming issuance of Treasuries between now and September will likely put continued upward pressure on yields over the near-term. While the absolute level of yields undoubtedly matters, the pace of the move higher in yields likely matters even more as a rapid rise is unsettling for equity and fixed income investors alike. Until the volatility in Treasury yields levels off and we settle into a new trading range, a cautious approach to stocks and bonds is likely advisable.
High Yield, Investment Grade Corporates Stressed By Rising Treasury Yields.
It was an eventful week in corporate bond land as rising Treasury yields and waning hopes of an economic soft landing led to losses across all segments of the domestic fixed income arena. The investment-grade Bloomberg Corporate index carries a 7.1-year duration profile and is roughly twice as sensitive to rising interest rates in the 5 to 10-year portion of the Treasury curve than is the Bloomberg U.S. High Yield index which carries a 3.5-year duration. As a result, the Corporate index fell 1.4% versus the High Yield index’s 0.6% weekly drop. Additional upward pressure on Treasury yields over the near- term would likely pressure investment-grade corporates in an outsized manner, but at some point, this will create an opportunity to increase exposure to higher quality corporate bonds at higher yields and with a higher expected return.
Labor Market Remains Tight, Likely Leading The Fed To Do More.
June nonfarm payrolls rose by 209K, falling short of the consensus estimate of 230k, but the unemployment rate fell to 3.6% from 3.7% the prior month. Perhaps most notably, average hourly earnings rose 0.4% month over month and 4.4% year over year in June, surpassing the 0.3% and 4.2% consensus estimates. The FOMC is likely to view the June payrolls report fondly, as June payrolls growth fell short of expectations while both April and May were revised downward as well. However, with average hourly earnings surprising to the upside both month over month and year over year, we expect the Committee to raise the Fed funds rate by another quarter-point when it meets later this month as wage growth points toward continued labor market strength.
IMPORTANT DISCLOSURES: THIS PUBLICATION HAS BEEN PREPARED BY THE STAFF OF HIGHLAND ASSOCIATES, INC. FOR DISTRIBUTION TO, AMONG OTHERS, HIGHLAND ASSOCIATES, INC. CLIENTS. HIGHLAND ASSOCIATES IS REGISTERED WITH THE UNITED STATES SECURITY AND EXCHANGE COMMISSION UNDER THE INVESTMENT ADVISORS ACT OF 1940. HIGHLAND ASSOCIATES IS A WHOLLY OWNED SUBSIDIARY OF REGIONS BANK, WHICH IN TURN IS A WHOLLY OWNED SUBSIDIARY OF REGIONS FINANCIAL CORPORATION. RESEARCH SERVICES ARE PROVIDED THROUGH MULTI-ASSET SOLUTIONS, A DEPARTMENT OF THE REGIONS ASSET MANAGEMENT BUSINESS GROUP WITHIN REGIONS BANK. THE INFORMATION AND MATERIAL CONTAINED HEREIN IS PROVIDED SOLELY FOR GENERAL INFORMATION PURPOSES ONLY. TO THE EXTENT THESE MATERIALS REFERENCE REGIONS BANK DATA, SUCH MATERIALS ARE NOT INTENDED TO BE REFLECTIVE OR INDICATIVE OF, AND SHOULD NOT BE RELIED UPON AS, THE RESULTS OF OPERATIONS, FINANCIAL CONDITIONS OR PERFORMANCE OF REGIONS BANK. UNLESS OTHERWISE SPECIFICALLY STATED, ANY VIEWS, OPINIONS, ANALYSES, ESTIMATES AND STRATEGIES, AS THE CASE MAY BE (“VIEWS”), EXPRESSED IN THIS CONTENT ARE THOSE OF THE RESPECTIVE AUTHORS AND SPEAKERS NAMED IN THOSE PIECES AND MAY DIFFER FROM THOSE OF REGIONS BANK AND/OR OTHER REGIONS BANK EMPLOYEES AND AFFILIATES. VIEWS AND ESTIMATES CONSTITUTE OUR JUDGMENT AS OF THE DATE OF THESE MATERIALS, ARE OFTEN BASED ON CURRENT MARKET CONDITIONS, AND ARE SUBJECT TO CHANGE WITHOUT NOTICE. ANY EXAMPLES USED ARE GENERIC, HYPOTHETICAL AND FOR ILLUSTRATION PURPOSES ONLY. ANY PRICES/QUOTES/STATISTICS INCLUDED HAVE BEEN OBTAINED FROM SOURCES BELIEVED TO BE RELIABLE, BUT HIGHLAND ASSOCIATES, INC. DOES NOT WARRANT THEIR COMPLETENESS OR ACCURACY. THIS INFORMATION IN NO WAY CONSTITUTES RESEARCH AND SHOULD NOT BE TREATED AS SUCH. THE VIEWS EXPRESSED HEREIN SHOULD NOT BE CONSTRUED AS INDIVIDUAL INVESTMENT ADVICE FOR ANY PARTICULAR PERSON OR ENTITY AND ARE NOT INTENDED AS RECOMMENDATIONS OF PARTICULAR SECURITIES, FINANCIAL INSTRUMENTS, STRATEGIES OR BANKING SERVICES FOR A PARTICULAR PERSON OR ENTITY. THE NAMES AND MARKS OF OTHER COMPANIES OR THEIR SERVICES OR PRODUCTS MAY BE THE TRADEMARKS OF THEIR OWNERS AND ARE USED ONLY TO IDENTIFY SUCH COMPANIES OR THEIR SERVICES OR PRODUCTS AND NOT TO INDICATE ENDORSEMENT, SPONSORSHIP, OR OWNERSHIP BY REGIONS OR HIGHLAND ASSOCIATES. EMPLOYEES OF HIGHLAND ASSOCIATES, INC., MAY HAVE POSITIONS IN SECURITIES OR THEIR DERIVATIVES THAT MAY BE MENTIONED IN THIS REPORT. ADDITIONALLY, HIGHLAND’S CLIENTS AND COMPANIES AFFILIATED WITH HIGHLAND ASSOCIATES MAY HOLD POSITIONS IN THE MENTIONED COMPANIES IN THEIR PORTFOLIOS OR STRATEGIES. THIS MATERIAL DOES NOT CONSTITUTE AN OFFER OR AN INVITATION BY OR ON BEHALF OF HIGHLAND ASSOCIATES TO ANY PERSON OR ENTITY TO BUY OR SELL ANY SECURITY OR FINANCIAL INSTRUMENT OR ENGAGE IN ANY BANKING SERVICE. NOTHING IN THESE MATERIALS CONSTITUTES INVESTMENT, LEGAL, ACCOUNTING OR TAX ADVICE. NON-DEPOSIT PRODUCTS INCLUDING INVESTMENTS, SECURITIES, MUTUAL FUNDS, INSURANCE PRODUCTS, CRYPTO ASSETS AND ANNUITIES: ARE NOT FDIC-INSURED I ARE NOT A DEPOSIT I MAY GO DOWN IN VALUE I ARE NOT BANK GUARANTEED I ARE NOT INSURED BY ANY FEDERAL GOVERNMENT AGENCY I ARE NOT A CONDITION OF ANY BANKING ACTIVITY.
NEITHER REGIONS BANK NOR REGIONS ASSET MANAGEMENT (COLLECTIVELY, “REGIONS”) ARE REGISTERED MUNICIPAL ADVISORS NOR PROVIDE ADVICE TO MUNICIPAL ENTITIES OR OBLIGATED PERSONS WITH RESPECT TO MUNICIPAL FINANCIAL PRODUCTS OR THE ISSUANCE OF MUNICIPAL SECURITIES (INCLUDING REGARDING THE STRUCTURE, TIMING, TERMS AND SIMILAR MATTERS CONCERNING MUNICIPAL FINANCIAL PRODUCTS OR MUNICIPAL SECURITIES ISSUANCES) OR ENGAGE IN THE SOLICITATION OF MUNICIPAL ENTITIES OR OBLIGATED PERSONS FOR SUCH SERVICES. WITH RESPECT TO THIS PRESENTATION AND ANY OTHER INFORMATION, MATERIALS OR COMMUNICATIONS PROVIDED BY REGIONS, (A) REGIONS IS NOT RECOMMENDING AN ACTION TO ANY MUNICIPAL ENTITY OR OBLIGATED PERSON, (B) REGIONS IS NOT ACTING AS AN ADVISOR TO ANY MUNICIPAL ENTITY OR OBLIGATED PERSON AND DOES NOT OWE A FIDUCIARY DUTY PURSUANT TO SECTION 15B OF THE SECURITIES EXCHANGE ACT OF 1934 TO ANY MUNICIPAL ENTITY OR OBLIGATED PERSON WITH RESPECT TO SUCH PRESENTATION, INFORMATION, MATERIALS OR COMMUNICATIONS, (C) REGIONS IS ACTING FOR ITS OWN INTERESTS, AND (D) YOU SHOULD DISCUSS THIS PRESENTATION AND ANY SUCH OTHER INFORMATION, MATERIALS OR COMMUNICATIONS WITH ANY AND ALL INTERNAL AND EXTERNAL ADVISORS AND EXPERTS THAT YOU DEEM APPROPRIATE BEFORE ACTING ON THIS PRESENTATION OR ANY SUCH OTHER INFORMATION, MATERIALS OR COMMUNICATIONS.
SOURCE: BLOOMBERG INDEX SERVICES LIMITED. BLOOMBERG® IS A TRADEMARK AND SERVICE MARK OF BLOOMBERG FINANCE L.P. AND ITS AFFILIATES (COLLECTIVELY “BLOOMBERG”). BARCLAYS® IS A TRADEMARK AND SERVICE MARK OF BARCLAYS BANK PLC (COLLECTIVELY WITH ITS AFFILIATES, “BARCLAYS”), USED UNDER LICENSE. BLOOMBERG OR BLOOMBERG’S LICENSORS, INCLUDING BARCLAYS, OWN ALL PROPRIETARY RIGHTS IN THE BLOOMBERG BARCLAYS INDICES. NEITHER BLOOMBERG NOR BARCLAYS APPROVES OR ENDORSES THIS MATERIAL OR GUARANTEES THE ACCURACY OR COMPLETENESS OF ANY INFORMATION HEREIN, OR MAKES ANY WARRANTY, EXPRESS OR IMPLIED, AS TO THE RESULTS TO BE OBTAINED THEREFROM AND, TO THE MAXIMUM EXTENT ALLOWED BY LAW, NEITHER SHALL HAVE ANY LIABILITY OR RESPONSIBILITY FOR INJURY OR DAMAGES ARISING IN CONNECTION THEREWITH.