Stocks: ‘Sell America’ Gives Way To ‘Buy The Dip’ As Tensions Surrounding Greenland Ease; Small-Cap Strength On Display For The 3rd Consecutive Week; Emerging Market Rally Continues, Driven By Strength Out Of Latin America.
Download Weekly Market Commentary | January 26 2026
What We’re Watching:
- The Conference Board releases its Consumer Confidence survey for January on Tuesday, with the reading expected to improve to 90.0 from 89.1 in December.
- The Federal Open Market Committee (FOMC) concludes its two-day meeting on Wednesday. The FOMC is expected to leave the Fed funds rate unchanged at its January meeting. While Chair Jerome Powell’s post-meeting remarks will be dissected and parsed for any clues as to the Committee’s plan and potential next steps, investors will likely begin to focus more on who President Trump will appoint to replace him.
- U.S. Producer Price Index (PPI) for December is released Friday. Final demand PPI is expected to have risen 0.3% month over month, which would be a modest acceleration from the 0.2% reading the prior month. PPI is worth watching as price increases at the wholesale level flow through into consumer prices in subsequent months, impacting core PCE, the FOMC’s preferred inflation gauge.
Key Observations
- Global equities sold off early in the week as tensions between the U.S. and European allies flared over Greenland. Investors quickly stepped in to buy the dip as a ‘framework for a deal’ was alluded to mid-week and President Trump cancelled 10% tariffs on goods imported from the U.K. and select EU countries that were set to go into effect on February 1. Last week was yet another case of investors being rewarded for tuning out the noise and not overreacting to headlines.
- Emerging market stocks built on what was already a strong start to the new year by tacking on another 1% gain during the week. Within emerging markets, Latin America continued to garner increased investor interest as Brazil and Mexico turned out another positive week, as did South Korea.
- U.S. Treasury yields steadied over the back-half of the week and weathered a storm of rising sovereign bond yields abroad and unsettling geopolitical headlines quite well. While Treasury yields experienced a bout of volatility, credit spreads continued to narrow over the balance of the week with the Bloomberg U.S. High Yield index ending the week trading at the ‘richest’ level relative to Treasuries we’ve seen since 2007. This is evidence that investors remain willing to reach for yield, even though, historically speaking, they aren’t being that well compensated for doing so at the present time.
What Happened Last Week:
Stocks: ‘Sell America’ Gives Way To ‘Buy The Dip’ As Tensions Surrounding Greenland Ease; Small-Cap Strength On Display For The 3rd Consecutive Week; Emerging Market Rally Continues, Driven By Strength Out Of Latin America.
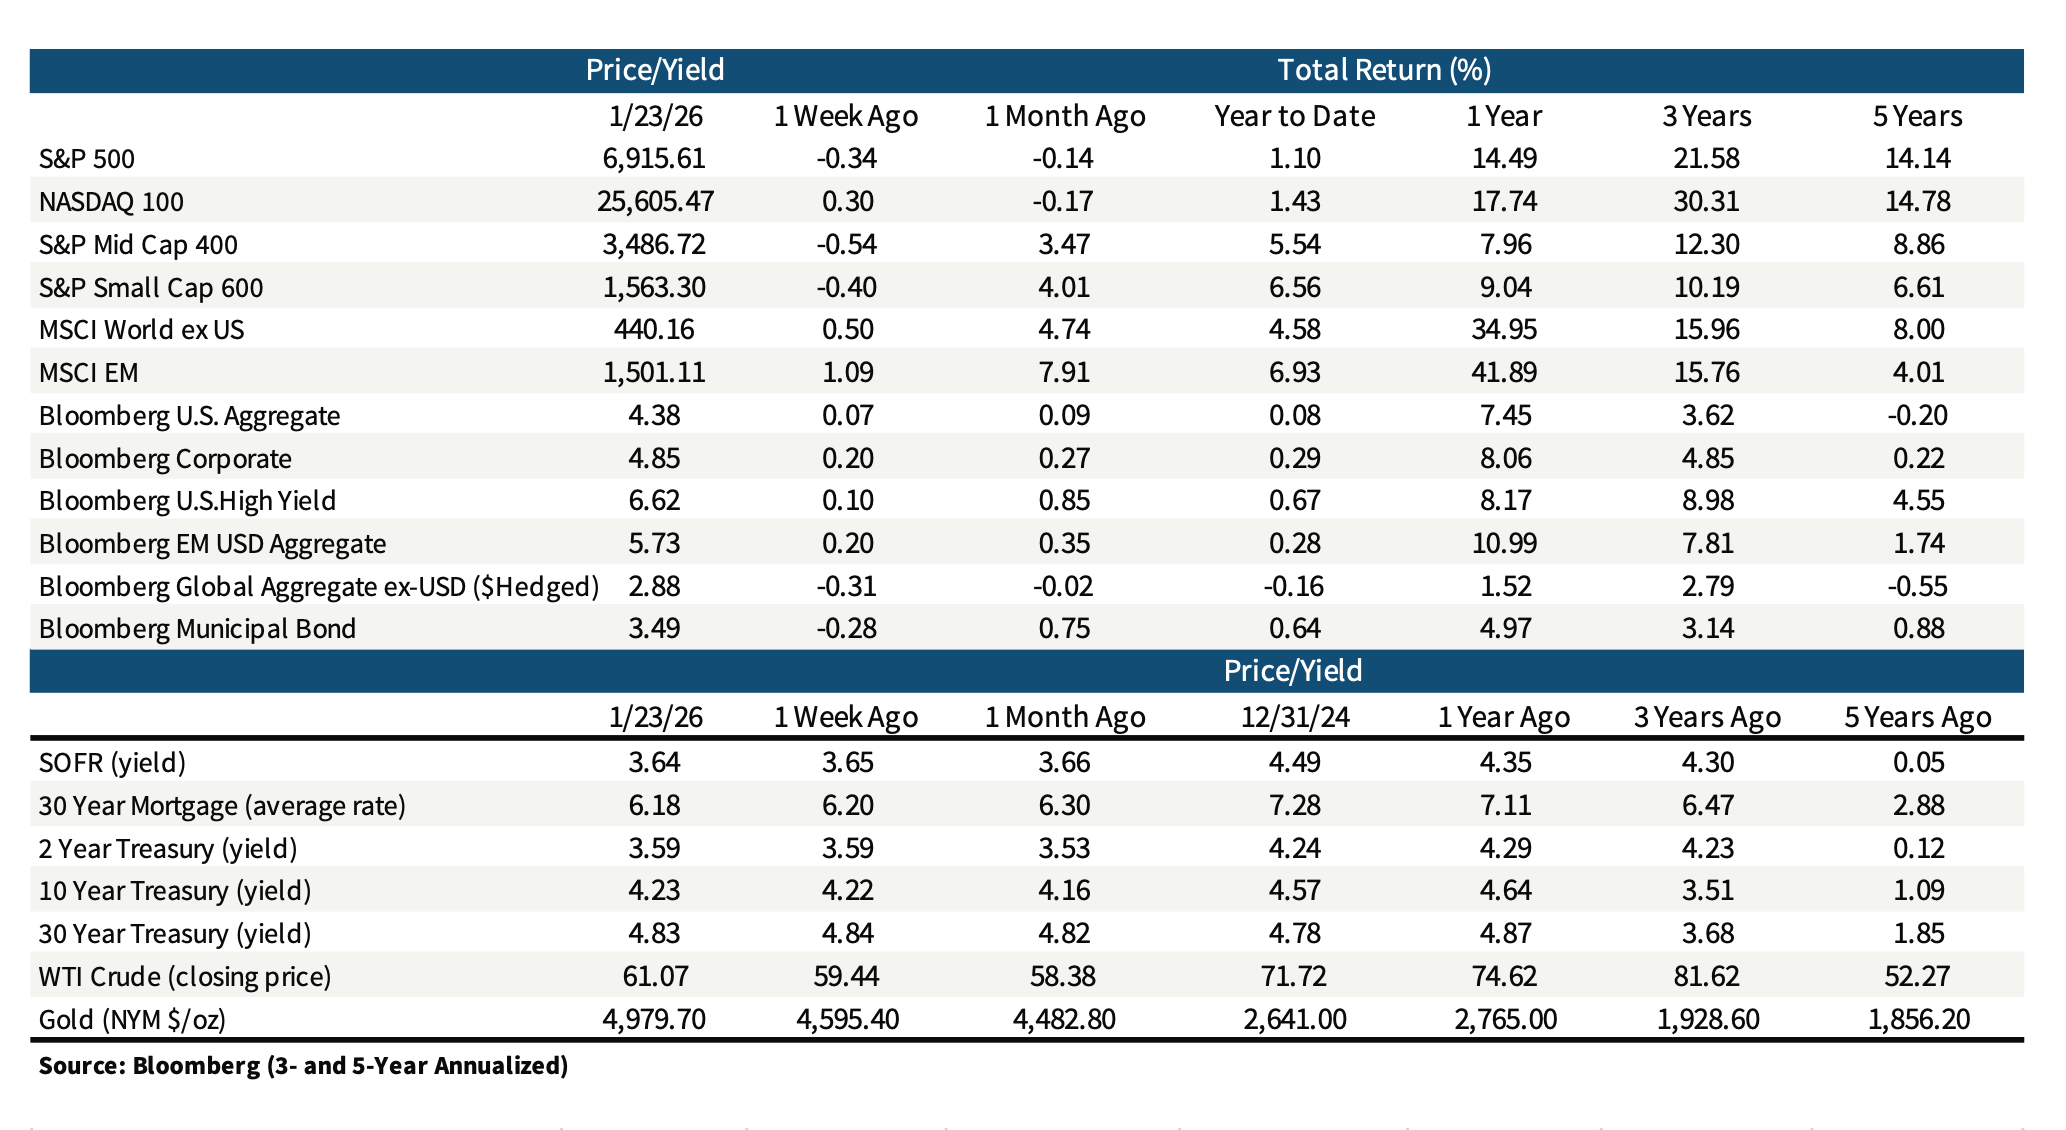
Geopolitical, Fiscal Concerns Rattle Markets But Risk Appetite Improves Into The Weekend. Elevated valuations and sizable price gains early in the new year had market participants looking for reasons to sell early in the week amid rising tensions surrounding Greenland, which combined with a sell-off in Japanese bonds generated a notable uptick in volatility and a downdraft in U.S. stocks. The S&P 500 gapped lower on Tuesday on the heels of remarks made the prior weekend surrounding U.S. interest in Greenland for national security purposes, with the blue-chip index falling 2.1% on the day. Undoubtedly, a portion of that decline was also related to global bond market volatility as Japan’s Prime Minister announced plans for a snap election and proposed cutting the country’s consumption tax, a move viewed as fiscal mismanagement that led market participants to sell longer dated Japanese Government Bonds (JGBs). The uptick in rates for the world’s third largest bond market (Japan) contributed to upward pressure on U.S. Treasury yields and pressured valuations for secular growth names in the information technology sector, specifically. As a result, the Russell 1000 Value index closed lower by 0.2% on the week while the Russell 1000 Growth index fared a bit worse, falling just shy of 0.5%. Sectors such as energy, health care, and materials lead the way – an interesting leadership mix to be sure, while the war on software names facing potential disruption from artificial intelligence (AI) continued as the industry group was one of the worst performers on the week. The narrative of AI dethroning software as a service (SAAS) has only accelerated as new AI coding tools have been released, but markets appear to be selling first and asking questions later, potentially creating an opportunity for value investors to capitalize should they be able to separate ‘true value’ from the ‘value traps.’
Friday’s Steep Drop Not Withstanding, Small Cap Strength Was On Display For The 3rd Consecutive Week. Interest from market participants in cyclical value sectors continued last week, fueling a continuation of the recent rally in the Russell 2000 small cap index early in the week, but after a 1.8% selloff on Friday the index finished the week with a 0.3% loss. Small cap stocks outperformed the S&P 500 in the first two weeks of the year and performed in-line with their large cap brethren last week, and as market participants look towards earnings season we see room for this cohort to continue to gain traction. The rotation into small caps is a sign of risk seeking behavior on the rise and with the Russell 2000 breaking out to the upside to kick off the year, we wouldn’t want to fade this move. As much as small cap indices are benefitting from lofty sector exposures to energy and materials, specifically, recent performance is also a story of what isn’t in the small cap benchmark: outsized exposure and heavy concentration in the technology sector. The Russell 2000 holds just a 14.9% weight to technology companies, which pales in comparison to the 33.6% information technology allocation in the S&P 500, so if technology companies continue to get rerated as market participants attempt to separate AI winners from the losers, small and mid-caps could be surprisingly defensive in that environment.
Emerging Market Stocks In Favor As The Lat Am Rally Rolls On. The MSCI EM index gained another 1% last week and is now higher by 6.9% year-to-date behind impressive breadth. Emerging Asia powered the bulk of the EM index’s gains last year as AI-related beneficiaries rallied sharply, and South Korea and Taiwan, specifically, have remained leadership into 2026. These pockets of consistent strength have been joined atop the country level rankings by Brazil and Mexico in ‘26 as investors have sought out more exposure to cyclical value within emerging markets to kick off the new year. The MSCI Brazil index is higher by 14.6% so far this year, with gains powered by basic materials, energy, financial services, and industrials stocks, which combined account for over 76% of the country’s index. If investors are looking for exposure to economically sensitive sectors at a more reasonable valuation, then they need look no further than Brazil. The MSCI Brazil index trades at less than 11 times forward earnings, with a free cash flow yield of 6.6% and with a trailing 12-month dividend yield of 4.5%, so there’s a lot to like here. The MSCI Mexico index has some similarities at the sector level to Brazil, but carries a much higher weight to consumer staples, which accounts for almost 25% of the index. The MSCI Mexico also has an attractive free cash flow yield of 6.1%, but trades at a loftier 15 times forward earnings. These two countries could continue to benefit from sector rotation and investors seeking out relative value and exposure to a cyclical upswing in the developing world.
Bonds: Treasury Yields Break Above Prior Resistance But Steady Despite Unsettling Headlines; Emerging Market Bonds Follow EM Stocks Higher; A Pause This Week Out Of The FOMC Is All But Assured.
Saber Rattling Over Greenland And A Parabolic Upward Move In Japanese Government Bond Yields Fails To Spur Much Movement In The Treasury Market. Tensions between the U.S. and European allies flared early last week over the U.S.’ intentions regarding Greenland, which spurred a selloff in U.S. Treasuries that pushed yields on longer-term bonds higher, with the 10-year yield closing at 4.30% last Tuesday before moving lower throughout the back-half of the week to close the week higher by 1-basis point at 4.23%. The bulk of the move higher in long-dated Treasury yields early last week was attributable to an unsettling move higher in Japanese Government Bond yields, with the 10-year JGB yield rising from 2.05% at year-end to 2.35% last Tuesday before rumors of intervention out of the Bank of Japan led to some buying and forced the yield down to 2.25% on Friday. The announcement that Denmark’s pension fund would sell its holdings in U.S. Treasuries was also a driver of the move higher in yields as concerns that other European countries would follow suit contributed to concerns that additional capital outflows from U.S. assets could be in the offing. However, while the headline was initially market moving, yields stabilized as market participants realized that the Danish pension plan held only around $100 million of U.S. Treasuries at last count, little more than a rounding error in the grand scheme of things.
Emerging Bonds Bounce As Tailwinds Build. In a volatile week for global rates due to the upheaval in the market for Japanese Government Bonds, investors leaned into emerging debt even amid rising yields. The Bloomberg USD EM Bond Index notched a 0.2% gain over the course of the week, standing out versus the Bloomberg International Aggregate index’s 0.1% drop as a focus on stepped-up fiscal spending led to continued selling in developed market sovereign bonds. This is an area where emerging countries have a significant advantage as debt to GDP ratios are far lower than they are for developed counterparts. Among other EM debt tailwinds, S&P upgraded Ukrainian debt to CCC+ on Thursday as the country completed restructuring a portion of its debt. Bond market participants also expressed increased confidence in Ukrainian corporate issuers as we saw the first corporate bond sale from a company in the country since the war with Russia began, a $450M dollar deal with a yield of roughly 10.5% at issuance. Suffice it to say that demand for EM assets has been insatiable to start the year.
FOMC To Stand Pat On Rates This Week, But Investor Focus May Already Be On Who Will Head The Fed Come May. The FOMC concludes its two-day meeting this Wednesday, and the Fed funds futures market views a pause as a slam dunk with a 97% probability. We would agree with this view as the rate cut we had originally forecasted to materialize early in 2026 was pulled forward when the FOMC cut the funds rate by 25-basis points in December. Interestingly, Fed funds futures aren’t pricing in a full 25-basis point rate cut until late July, with mid-June the most likely meeting for the Committee to deliver further policy easing in the eyes of market participants. Chair Jerome Powell’s term as head of the FOMC is set to expire in May, and speculation has run rampant that President Trump could be ready to announce his replacement soon. With a change at the top of the FOMC in the offing, for once, we are expecting a muted market response to Chair Powell’s post-meeting remarks as investors focus their attention on the three candidates rumored to be up for the post and how each could alter the path forward for monetary policy moving forward.
IMPORTANT DISCLOSURES: THIS PUBLICATION HAS BEEN PREPARED BY THE STAFF OF HIGHLAND ASSOCIATES, INC. FOR DISTRIBUTION TO, AMONG OTHERS, HIGHLAND ASSOCIATES, INC. CLIENTS. HIGHLAND ASSOCIATES IS REGISTERED WITH THE UNITED STATES SECURITY AND EXCHANGE COMMISSION UNDER THE INVESTMENT ADVISORS ACT OF 1940. HIGHLAND ASSOCIATES IS A WHOLLY OWNED SUBSIDIARY OF REGIONS BANK, WHICH IN TURN IS A WHOLLY OWNED SUBSIDIARY OF REGIONS FINANCIAL CORPORATION. RESEARCH SERVICES ARE PROVIDED THROUGH MULTI-ASSET SOLUTIONS, A DEPARTMENT OF THE REGIONS ASSET MANAGEMENT BUSINESS GROUP WITHIN REGIONS BANK. THE INFORMATION AND MATERIAL CONTAINED HEREIN IS PROVIDED SOLELY FOR GENERAL INFORMATION PURPOSES ONLY. TO THE EXTENT THESE MATERIALS REFERENCE REGIONS BANK DATA, SUCH MATERIALS ARE NOT INTENDED TO BE REFLECTIVE OR INDICATIVE OF, AND SHOULD NOT BE RELIED UPON AS, THE RESULTS OF OPERATIONS, FINANCIAL CONDITIONS OR PERFORMANCE OF REGIONS BANK. UNLESS OTHERWISE SPECIFICALLY STATED, ANY VIEWS, OPINIONS, ANALYSES, ESTIMATES AND STRATEGIES, AS THE CASE MAY BE (“VIEWS”), EXPRESSED IN THIS CONTENT ARE THOSE OF THE RESPECTIVE AUTHORS AND SPEAKERS NAMED IN THOSE PIECES AND MAY DIFFER FROM THOSE OF REGIONS BANK AND/OR OTHER REGIONS BANK EMPLOYEES AND AFFILIATES. VIEWS AND ESTIMATES CONSTITUTE OUR JUDGMENT AS OF THE DATE OF THESE MATERIALS, ARE OFTEN BASED ON CURRENT MARKET CONDITIONS, AND ARE SUBJECT TO CHANGE WITHOUT NOTICE. ANY EXAMPLES USED ARE GENERIC, HYPOTHETICAL AND FOR ILLUSTRATION PURPOSES ONLY. ANY PRICES/QUOTES/STATISTICS INCLUDED HAVE BEEN OBTAINED FROM SOURCES BELIEVED TO BE RELIABLE, BUT HIGHLAND ASSOCIATES, INC. DOES NOT WARRANT THEIR COMPLETENESS OR ACCURACY. THIS INFORMATION IN NO WAY CONSTITUTES RESEARCH AND SHOULD NOT BE TREATED AS SUCH. THE VIEWS EXPRESSED HEREIN SHOULD NOT BE CONSTRUED AS INDIVIDUAL INVESTMENT ADVICE FOR ANY PARTICULAR PERSON OR ENTITY AND ARE NOT INTENDED AS RECOMMENDATIONS OF PARTICULAR SECURITIES, FINANCIAL INSTRUMENTS, STRATEGIES OR BANKING SERVICES FOR A PARTICULAR PERSON OR ENTITY. THE NAMES AND MARKS OF OTHER COMPANIES OR THEIR SERVICES OR PRODUCTS MAY BE THE TRADEMARKS OF THEIR OWNERS AND ARE USED ONLY TO IDENTIFY SUCH COMPANIES OR THEIR SERVICES OR PRODUCTS AND NOT TO INDICATE ENDORSEMENT, SPONSORSHIP, OR OWNERSHIP BY REGIONS OR HIGHLAND ASSOCIATES. EMPLOYEES OF HIGHLAND ASSOCIATES, INC., MAY HAVE POSITIONS IN SECURITIES OR THEIR DERIVATIVES THAT MAY BE MENTIONED IN THIS REPORT. ADDITIONALLY, HIGHLAND’S CLIENTS AND COMPANIES AFFILIATED WITH HIGHLAND ASSOCIATES MAY HOLD POSITIONS IN THE MENTIONED COMPANIES IN THEIR PORTFOLIOS OR STRATEGIES. THIS MATERIAL DOES NOT CONSTITUTE AN OFFER OR AN INVITATION BY OR ON BEHALF OF HIGHLAND ASSOCIATES TO ANY PERSON OR ENTITY TO BUY OR SELL ANY SECURITY OR FINANCIAL INSTRUMENT OR ENGAGE IN ANY BANKING SERVICE. NOTHING IN THESE MATERIALS CONSTITUTES INVESTMENT, LEGAL, ACCOUNTING OR TAX ADVICE. NON-DEPOSIT PRODUCTS INCLUDING INVESTMENTS, SECURITIES, MUTUAL FUNDS, INSURANCE PRODUCTS, CRYPTO ASSETS AND ANNUITIES: ARE NOT FDIC-INSURED I ARE NOT A DEPOSIT I MAY GO DOWN IN VALUE I ARE NOT BANK GUARANTEED I ARE NOT INSURED BY ANY FEDERAL GOVERNMENT AGENCY I ARE NOT A CONDITION OF ANY BANKING ACTIVITY.
NEITHER REGIONS BANK NOR REGIONS ASSET MANAGEMENT (COLLECTIVELY, “REGIONS”) ARE REGISTERED MUNICIPAL ADVISORS NOR PROVIDE ADVICE TO MUNICIPAL ENTITIES OR OBLIGATED PERSONS WITH RESPECT TO MUNICIPAL FINANCIAL PRODUCTS OR THE ISSUANCE OF MUNICIPAL SECURITIES (INCLUDING REGARDING THE STRUCTURE, TIMING, TERMS AND SIMILAR MATTERS CONCERNING MUNICIPAL FINANCIAL PRODUCTS OR MUNICIPAL SECURITIES ISSUANCES) OR ENGAGE IN THE SOLICITATION OF MUNICIPAL ENTITIES OR OBLIGATED PERSONS FOR SUCH SERVICES. WITH RESPECT TO THIS PRESENTATION AND ANY OTHER INFORMATION, MATERIALS OR COMMUNICATIONS PROVIDED BY REGIONS, (A) REGIONS IS NOT RECOMMENDING AN ACTION TO ANY MUNICIPAL ENTITY OR OBLIGATED PERSON, (B) REGIONS IS NOT ACTING AS AN ADVISOR TO ANY MUNICIPAL ENTITY OR OBLIGATED PERSON AND DOES NOT OWE A FIDUCIARY DUTY PURSUANT TO SECTION 15B OF THE SECURITIES EXCHANGE ACT OF 1934 TO ANY MUNICIPAL ENTITY OR OBLIGATED PERSON WITH RESPECT TO SUCH PRESENTATION, INFORMATION, MATERIALS OR COMMUNICATIONS, (C) REGIONS IS ACTING FOR ITS OWN INTERESTS, AND (D) YOU SHOULD DISCUSS THIS PRESENTATION AND ANY SUCH OTHER INFORMATION, MATERIALS OR COMMUNICATIONS WITH ANY AND ALL INTERNAL AND EXTERNAL ADVISORS AND EXPERTS THAT YOU DEEM APPROPRIATE BEFORE ACTING ON THIS PRESENTATION OR ANY SUCH OTHER INFORMATION, MATERIALS OR COMMUNICATIONS.
SOURCE: BLOOMBERG INDEX SERVICES LIMITED. BLOOMBERG® IS A TRADEMARK AND SERVICE MARK OF BLOOMBERG FINANCE L.P. AND ITS AFFILIATES (COLLECTIVELY “BLOOMBERG”). BARCLAYS® IS A TRADEMARK AND SERVICE MARK OF BARCLAYS BANK PLC (COLLECTIVELY WITH ITS AFFILIATES, “BARCLAYS”), USED UNDER LICENSE. BLOOMBERG OR BLOOMBERG’S LICENSORS, INCLUDING BARCLAYS, OWN ALL PROPRIETARY RIGHTS IN THE BLOOMBERG BARCLAYS INDICES. NEITHER BLOOMBERG NOR BARCLAYS APPROVES OR ENDORSES THIS MATERIAL OR GUARANTEES THE ACCURACY OR COMPLETENESS OF ANY INFORMATION HEREIN, OR MAKES ANY WARRANTY, EXPRESS OR IMPLIED, AS TO THE RESULTS TO BE OBTAINED THEREFROM AND, TO THE MAXIMUM EXTENT ALLOWED BY LAW, NEITHER SHALL HAVE ANY LIABILITY OR RESPONSIBILITY FOR INJURY OR DAMAGES ARISING IN CONNECTION THEREWITH.