Stocks: S&P 500 Ends The Week With A Small Loss As An FOMC Tailwind Is Offset By Earnings-Related Headwinds; Small Caps Continue To Garner Interest As Investors Bet On More Rate Cuts; U.S. Dollar Weakness A Boon For Some Developed Markets Abroad.
Download Weekly Market Commentary | December 15 2025
What We’re Watching:
- The November nonfarm payrolls report will finally be released on Tuesday after a ten-day delay. The consensus estimate calls for 50k jobs to have been created during the month, with the unemployment rate rising to 4.5% from 4.4% the prior month. Average hourly earnings are expected to have risen 0.3% month over month and 3.6% year over year.
- S&P Global will release its December preliminary manufacturing and services purchasing managers indices (PMI) on Tuesday. Manufacturing PMI is expected to come in at 52.3, while Services PMI is projected to be 54.0. A reading above 50 indicates expansion or growth, below 50 contraction.
- The U.S. Consumer Price Index (CPI) from November is released Thursday. Headline CPI is expected to rise 3.1% year over year, while the core measure is expected to rise 3.0% year over year. Month over month figures will not be provided as the government shutdown prevented October inflation data from being collected.
Key Observations
- Stocks and bonds initially rallied mid-week after the FOMC delivered a quarter-point rate cut and Chair Jerome Powell’s post-meeting remarks skewed more dovish than had been expected, but both asset classes succumbed to selling pressure into the weekend. The U.S. dollar weakened over the balance of the week, despite yields on long-term U.S. Treasury bonds ending the week higher by a handful of basis points. We expect continued volatility in the U.S. dollar and Treasury yields this week as November payrolls are released as rate cut expectations could shift materially.
- U.S. small cap stocks fared better than large caps on the week as earnings releases out of two high profile information technology names weighed on sentiment surrounding the health of the AI trade yet again. Financials and industrials, both economically sensitive sectors, were the top S&P 500 performers on the week with both sectors benefiting as capital rotated out of information technology stocks.
- U.S. Treasury yields were volatile as investors digested the FOMC’s updated dot plot and Chair Jerome Powell’s post-meeting remarks. The 10-year yield, specifically, ended the week near the upper-bound of its multi-month trading range of 3.95% to 4.20%. A weekly close above 4.20% would potentially lead us to alter our outlook on the path forward for yields on long-dated Treasuries as this would be a notable breakout from the downtrend that has been in place since May.
What Happened Last Week:
Stocks: S&P 500 Ends The Week With A Small Loss As An FOMC Tailwind Is Offset By Earnings-Related Headwinds; Small Caps Continue To Garner Interest As Investors Bet On More Rate Cuts; U.S. Dollar Weakness A Boon For Some Developed Markets Abroad.
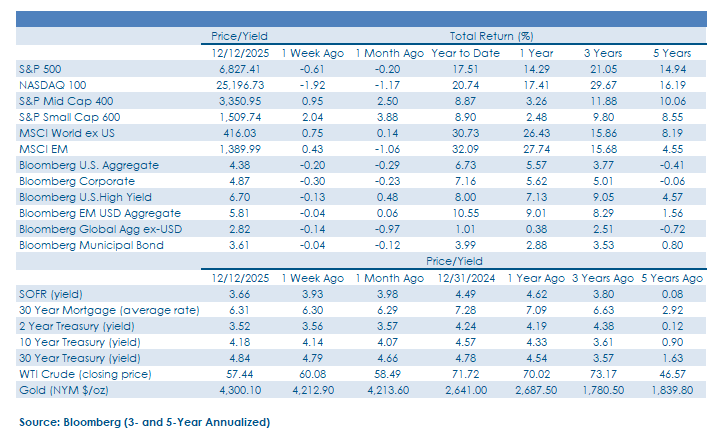
Dovish FOMC Spurs Rally Stateside, But Earnings Releases Limit Enthusiasm – For Now. All eyes were on the FOMC meeting last week and the S&P 500 marked time and moved sideways in the lead-up to the Committee’s Wednesday decision on rates.The FOMC’s decision to cut the funds rate by 25-bps was widely expected, but the dovish commentary and Goldilocks dot plot were apparently not priced in and provided a tailwind for U.S. stocks, particularly small and mid-caps (SMid), in the back-half of the week. However, good cheer out of the FOMC was tempered by earnings releases out of Oracle (ORCL) and Broadcom (AVGO), with the former falling 12.7% and the latter dropping 7.7%, respectively, on the week. Both companies are top 25 S&P 500 holdings by market cap, and both are heavily tied to the buildout of AI infrastructure, and from our perspective, it’s encouraging that the S&P 500 only fell 0.6% on the week despite such sizable pullbacks in these two names. Historically, the back-half of December has proven to be more profitable for investors than the first half, with the bulk of gains coming between Christmas and New Year’s, and last week’s FOMC meeting could prove to be a clearing event and set us up for a strong close to a good year for U.S. equity indices.
Small Cap Continue To Lead As Traders Want The Most Leverage To Rate Cuts. In contrast to the S&P 500, which marked time in the days preceding the FOMC meeting, investors appeared eager to bid up share prices of smaller capitalization stocks. From the end of November through last Friday, the S&P Small Cap 400 index climbed 2.6%, while the Russell 2000 index, which is a lower quality index as constituents are not required to be profitable, returned 2%, all while the S&P 500 is lower by 0.3% over the same timeframe. Small caps continued to garner inflows last week as investors didn’t just buy the rumor, but also the news of a December rate cut, and with the FOMC Chair and the Committee’s updated dot plot painting a fairly rosy picture of the U.S. economy in 2026, more economically sensitive small and mid-cap stocks could continue to perform well on an absolute and relative basis well into 2026.
U.S. Dollar Follows Treasury Yields Lower Post-FOMC, Providing A Tailwind For Developed Market Stocks Abroad. The U.S. Dollar Index, or DXY, fell over the back-half of last week on the heels of the FOMC’s rate cut and dovish commentary. The euro, British pound, and Japanese yen all found their footing versus the greenback mid-week, but Eurozone stocks, particularly those tied to Germany, Italy, and Spain responded the most positively to weakness in the U.S. dollar, while indices linked to the U.K., France, and Japan saw more muted moves. This Tuesday brings with it the release of November payrolls, which we project to fall well short of the consensus estimate, which could lead to more rate cuts being priced in and further near-term weakness in the U.S. dollar. However, we expect the DXY to find a floor of support around 96.50, or around 2% below its Friday closing level, and given our constructive outlook on the U.S. economy in the coming year, we expect dollar weakness to be contained from here.
Bonds: Yield Curve Steepens With The 10-Year Yield Approaching A Key Level; The FOMC Delivers A Rate Cut, And A More Dovish Message To Markets; A Wild Ride For Emerging Market Debt Highlights Some Risks To The Asset Class Worth Watching.
Treasuries Catch A Bid As FOMC Chair’s Remarks, Committee’s Dot Plot Prove More Dovish Than Expected. Yields in the belly of the Treasury curve rose to kick off last week, with the 10-year yield challenging the 4.20% level for the first time since late September last Tuesday in the lead-up to the FOMC decision on Wednesday. Treasury yields across the curve fell in the immediate aftermath of the meeting as investors latched onto the fact that the Committee would begin buying $40B per month in bills and shorter-term bonds maturing inside of 3-years to ensure reserves in the banking system were ample after some funding/liquidity concerns cropped up last month. The FOMC’s bond buying efforts has already been coined as “QE-lite,” and these bond purchases should serve to boost liquidity in the banking sector, and on balance financial conditions will likely ease as a result. Given our views on economic growth and inflation in the coming year, we expect upward pressure on Treasury yields to persist in 2026, and a weekly close above 4.20% would potentially signal a character change as it would be a breakout from a nearly six-month downtrend for the 10-year yield. A weekly breakout above 4.20% would likely target 4.30%/4.35%, or the mid-August high, but the speed at which the 10-year yield reaches that area would likely matter more than the absolute level.
FOMC In ‘Wait And See’ Mode After Another Rate Cut, But Chair Powell Left The Door Cracked For Another Cut In January. As expected, the Federal Open Market Committee (FOMC) delivered a 25-basis point rate cut at its December meeting, leading to a rally in stocks and bonds as investors in both asset classes heard or saw something they liked. The decision to cut the funds rate wasn’t a unanimous one as there were three dissents with two voters opting for no cut, while one pushed for 50-bps. We were expecting a couple more dissents in the camp of no cut, so we were a bit surprised that the consensus swung so far to the easing side of the ledger. The FOMC’s updated dot plot, or median Committee member’s forecast for various economic data points, painted something of a Goldilocks picture for the coming year. The dot plot projects the unemployment rate to remain steady at 4.4% in ’26, inflation (core PCE) to fall to 2.4%, and for U.S. economic growth to pick up to 2.3% as the Committee pushed 0.2% from 4Q25 due to the government shutdown into the new year. The FOMC also announced it would begin buying $40B per month of short-term bills, allowing for purchases of bonds maturing inside of 3-years to maintain ample reserves and bolster liquidity in the banking system. This $40B per month in purchases appears larger than most economists and central bank pundits were projecting, and the bond market initially appeared to view this move as potentially forcing fixed income investors farther out on the Treasury curve and serving to increase demand for long bonds, but that initial stance appeared to shift into the weekend as yields on long-term Treasuries moved back to multi-month highs on Friday. Chair Powell’s post-meeting remarks were decidedly more ‘dovish’ than we expected, and markets took their cue from a statement he made surrounding his belief that payrolls growth has been overstated by 60k in recent months to imply he could get on board with another rate cut early next year if the labor market data justifies such a move.
Emerging Market Bonds Salvage The Week As Rates Roundtrip. Volatility in U.S. Treasury yields had global implications last week as emerging market debt came under pressure, with the Bloomberg Emerging Market (EM) USD Aggregate Bond index declining by as much as 0.5% early last week as yields moved sharply higher. However, rates retraced their move higher midweek as the FOMC not only cut the Fed funds rate but announced it would begin buying $40B of short-term bonds per month, all while hinting strongly that the Committee remained more attentive to downside risks to the labor market as opposed to upside risks to inflation. In turn, the U.S. dollar sank, and longer duration assets caught a bid, with the Bloomberg EM Bond index finishing the week lower by less than 0.1%. Higher quality sovereign debt issued by India, South Korea, and China were among the best performers, while higher yielding names with ample liquidity were laggards as investors and traders shifted their preference toward stability as opposed to total return upside. Even though the drawdown last week was short-lived, there is still an instructional element in our view of just how much price risk is out there should inflation and/or interest rates surprise to the upside. Investors shouldn’t yet be shifting to shorter duration bonds yet as the cutting cycle could continue to benefit bond investors farther out on the curve, but surprises in economic data could be under appreciated and underpriced by markets at present.
IMPORTANT DISCLOSURES: THIS PUBLICATION HAS BEEN PREPARED BY THE STAFF OF HIGHLAND ASSOCIATES, INC. FOR DISTRIBUTION TO, AMONG OTHERS, HIGHLAND ASSOCIATES, INC. CLIENTS. HIGHLAND ASSOCIATES IS REGISTERED WITH THE UNITED STATES SECURITY AND EXCHANGE COMMISSION UNDER THE INVESTMENT ADVISORS ACT OF 1940. HIGHLAND ASSOCIATES IS A WHOLLY OWNED SUBSIDIARY OF REGIONS BANK, WHICH IN TURN IS A WHOLLY OWNED SUBSIDIARY OF REGIONS FINANCIAL CORPORATION. RESEARCH SERVICES ARE PROVIDED THROUGH MULTI-ASSET SOLUTIONS, A DEPARTMENT OF THE REGIONS ASSET MANAGEMENT BUSINESS GROUP WITHIN REGIONS BANK. THE INFORMATION AND MATERIAL CONTAINED HEREIN IS PROVIDED SOLELY FOR GENERAL INFORMATION PURPOSES ONLY. TO THE EXTENT THESE MATERIALS REFERENCE REGIONS BANK DATA, SUCH MATERIALS ARE NOT INTENDED TO BE REFLECTIVE OR INDICATIVE OF, AND SHOULD NOT BE RELIED UPON AS, THE RESULTS OF OPERATIONS, FINANCIAL CONDITIONS OR PERFORMANCE OF REGIONS BANK. UNLESS OTHERWISE SPECIFICALLY STATED, ANY VIEWS, OPINIONS, ANALYSES, ESTIMATES AND STRATEGIES, AS THE CASE MAY BE (“VIEWS”), EXPRESSED IN THIS CONTENT ARE THOSE OF THE RESPECTIVE AUTHORS AND SPEAKERS NAMED IN THOSE PIECES AND MAY DIFFER FROM THOSE OF REGIONS BANK AND/OR OTHER REGIONS BANK EMPLOYEES AND AFFILIATES. VIEWS AND ESTIMATES CONSTITUTE OUR JUDGMENT AS OF THE DATE OF THESE MATERIALS, ARE OFTEN BASED ON CURRENT MARKET CONDITIONS, AND ARE SUBJECT TO CHANGE WITHOUT NOTICE. ANY EXAMPLES USED ARE GENERIC, HYPOTHETICAL AND FOR ILLUSTRATION PURPOSES ONLY. ANY PRICES/QUOTES/STATISTICS INCLUDED HAVE BEEN OBTAINED FROM SOURCES BELIEVED TO BE RELIABLE, BUT HIGHLAND ASSOCIATES, INC. DOES NOT WARRANT THEIR COMPLETENESS OR ACCURACY. THIS INFORMATION IN NO WAY CONSTITUTES RESEARCH AND SHOULD NOT BE TREATED AS SUCH. THE VIEWS EXPRESSED HEREIN SHOULD NOT BE CONSTRUED AS INDIVIDUAL INVESTMENT ADVICE FOR ANY PARTICULAR PERSON OR ENTITY AND ARE NOT INTENDED AS RECOMMENDATIONS OF PARTICULAR SECURITIES, FINANCIAL INSTRUMENTS, STRATEGIES OR BANKING SERVICES FOR A PARTICULAR PERSON OR ENTITY. THE NAMES AND MARKS OF OTHER COMPANIES OR THEIR SERVICES OR PRODUCTS MAY BE THE TRADEMARKS OF THEIR OWNERS AND ARE USED ONLY TO IDENTIFY SUCH COMPANIES OR THEIR SERVICES OR PRODUCTS AND NOT TO INDICATE ENDORSEMENT, SPONSORSHIP, OR OWNERSHIP BY REGIONS OR HIGHLAND ASSOCIATES. EMPLOYEES OF HIGHLAND ASSOCIATES, INC., MAY HAVE POSITIONS IN SECURITIES OR THEIR DERIVATIVES THAT MAY BE MENTIONED IN THIS REPORT. ADDITIONALLY, HIGHLAND’S CLIENTS AND COMPANIES AFFILIATED WITH HIGHLAND ASSOCIATES MAY HOLD POSITIONS IN THE MENTIONED COMPANIES IN THEIR PORTFOLIOS OR STRATEGIES. THIS MATERIAL DOES NOT CONSTITUTE AN OFFER OR AN INVITATION BY OR ON BEHALF OF HIGHLAND ASSOCIATES TO ANY PERSON OR ENTITY TO BUY OR SELL ANY SECURITY OR FINANCIAL INSTRUMENT OR ENGAGE IN ANY BANKING SERVICE. NOTHING IN THESE MATERIALS CONSTITUTES INVESTMENT, LEGAL, ACCOUNTING OR TAX ADVICE. NON-DEPOSIT PRODUCTS INCLUDING INVESTMENTS, SECURITIES, MUTUAL FUNDS, INSURANCE PRODUCTS, CRYPTO ASSETS AND ANNUITIES: ARE NOT FDIC-INSURED I ARE NOT A DEPOSIT I MAY GO DOWN IN VALUE I ARE NOT BANK GUARANTEED I ARE NOT INSURED BY ANY FEDERAL GOVERNMENT AGENCY I ARE NOT A CONDITION OF ANY BANKING ACTIVITY.
NEITHER REGIONS BANK NOR REGIONS ASSET MANAGEMENT (COLLECTIVELY, “REGIONS”) ARE REGISTERED MUNICIPAL ADVISORS NOR PROVIDE ADVICE TO MUNICIPAL ENTITIES OR OBLIGATED PERSONS WITH RESPECT TO MUNICIPAL FINANCIAL PRODUCTS OR THE ISSUANCE OF MUNICIPAL SECURITIES (INCLUDING REGARDING THE STRUCTURE, TIMING, TERMS AND SIMILAR MATTERS CONCERNING MUNICIPAL FINANCIAL PRODUCTS OR MUNICIPAL SECURITIES ISSUANCES) OR ENGAGE IN THE SOLICITATION OF MUNICIPAL ENTITIES OR OBLIGATED PERSONS FOR SUCH SERVICES. WITH RESPECT TO THIS PRESENTATION AND ANY OTHER INFORMATION, MATERIALS OR COMMUNICATIONS PROVIDED BY REGIONS, (A) REGIONS IS NOT RECOMMENDING AN ACTION TO ANY MUNICIPAL ENTITY OR OBLIGATED PERSON, (B) REGIONS IS NOT ACTING AS AN ADVISOR TO ANY MUNICIPAL ENTITY OR OBLIGATED PERSON AND DOES NOT OWE A FIDUCIARY DUTY PURSUANT TO SECTION 15B OF THE SECURITIES EXCHANGE ACT OF 1934 TO ANY MUNICIPAL ENTITY OR OBLIGATED PERSON WITH RESPECT TO SUCH PRESENTATION, INFORMATION, MATERIALS OR COMMUNICATIONS, (C) REGIONS IS ACTING FOR ITS OWN INTERESTS, AND (D) YOU SHOULD DISCUSS THIS PRESENTATION AND ANY SUCH OTHER INFORMATION, MATERIALS OR COMMUNICATIONS WITH ANY AND ALL INTERNAL AND EXTERNAL ADVISORS AND EXPERTS THAT YOU DEEM APPROPRIATE BEFORE ACTING ON THIS PRESENTATION OR ANY SUCH OTHER INFORMATION, MATERIALS OR COMMUNICATIONS.
SOURCE: BLOOMBERG INDEX SERVICES LIMITED. BLOOMBERG® IS A TRADEMARK AND SERVICE MARK OF BLOOMBERG FINANCE L.P. AND ITS AFFILIATES (COLLECTIVELY “BLOOMBERG”). BARCLAYS® IS A TRADEMARK AND SERVICE MARK OF BARCLAYS BANK PLC (COLLECTIVELY WITH ITS AFFILIATES, “BARCLAYS”), USED UNDER LICENSE. BLOOMBERG OR BLOOMBERG’S LICENSORS, INCLUDING BARCLAYS, OWN ALL PROPRIETARY RIGHTS IN THE BLOOMBERG BARCLAYS INDICES. NEITHER BLOOMBERG NOR BARCLAYS APPROVES OR ENDORSES THIS MATERIAL OR GUARANTEES THE ACCURACY OR COMPLETENESS OF ANY INFORMATION HEREIN, OR MAKES ANY WARRANTY, EXPRESS OR IMPLIED, AS TO THE RESULTS TO BE OBTAINED THEREFROM AND, TO THE MAXIMUM EXTENT ALLOWED BY LAW, NEITHER SHALL HAVE ANY LIABILITY OR RESPONSIBILITY FOR INJURY OR DAMAGES ARISING IN CONNECTION THEREWITH.