Stocks: August Living Up To Its Reputation As A Challenging Month; Intra-Day Reversals A Shift In Market Psychology, Or Function Of Where We Are In The Calendar?
Download Weekly Market Commentary | August 14 2023
Key Observations
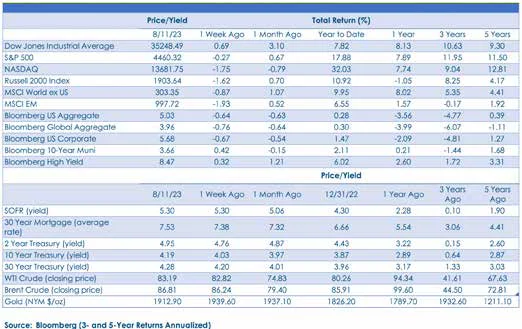
- Domestic equity indices were choppy and rudderless last week as interest rate volatility led to fits and starts. Small- cap stocks underperformed the S&P 500 by a sizable margin as investors jettisoned unprofitable companies and shifted capital into energy and more defensive sectors.
- August has so far lived up to its billing as a challenging month for stocks with the S&P 500 falling 2.6%, but the pullback has so far been orderly and healthy, in our view. U.S. Treasury yields and the U.S. dollar are worth watching over coming weeks as higher rates and a stronger dollar could spur more risk-off positioning and a deeper drawdown for stocks.
- Inflation data, Treasury auctions, and the Bank of Japan buying bonds contribute to more volatility in interest rates and long- term Treasury yields push back toward year-to- date highs.
- The Federal Open Market Committee (FOMC) will view inflation data from July favorably and is likely stand pat in September while leaving its options for November open.
What We’re Watching:
- U.S. retail sales for July are released Tuesday and are expected to have risen 0.4% month over month, above the 0.2% month over month reading from June.
- Minutes from the Federal Open Market Committee’s July 25-26 meeting will be released Wednesday.
- The Philadelphia Fed releases its monthly manufacturing index for August on Thursday. A reading of -10.0 is expected, a modest improvement versus the -13.5 reading from July.
- The Conference Board will release its index of Leading Economic Indicators (LEIs) for July on Thursday, with a reading of -0.4% month over month expected, a modest improvement from the -0.70% reading from June.
- Japan’s July Consumer Price Index (CPI) is released Thursday with a year over year reading of 3.2% expected, which would be a slight downshift from a 3.3% year over year reading in June.
What Happened Last Week:
Stocks: August Living Up To Its Reputation As A Challenging Month; Intra-Day Reversals A Shift In Market Psychology, Or Function Of Where We Are In The Calendar?
S&P 500 Stuck In A Range As Earnings Season Wraps Up. The S&P 500 traded in a range between 4,450 and 4,525 over the balance of last week, ultimately ending lower by 0.2%. As is typically the case this time of year, trading volume was exceedingly low, a dynamic that makes it difficult to glean too much from price action. One thing that did stand out to us worth monitoring was a series of relatively sharp intra-day reversals last week as both gains and losses proved fleeting. A shift in market character from ‘buying dips’ to ‘selling rips’ would be notable should it persist, but, so far anyway, the August swoon for equity prices has been orderly and appears healthy, in our view. We will be watching U.S. Treasury yields and the U.S. dollar over coming weeks as rates rising and the dollar strengthening would present a staunch headwind for near-term equity gains.
Small-Caps Encounter Resistance, Lag On The Week. The Russell 2000 produced a 1.6% loss on the week with the blame for the decline falling on small-cap growth as the Russell 2000 Growth index fell 2.4% on the week. Unprofitable companies fared the worst as information technology names oriented towards cryptocurrencies and/or blockchain-related businesses were loss leaders this week, while healthcare also underperformed. In the current environment, we gravitate toward the S&P 600 Small-Cap index as opposed to the broader Russell 2000 as S&P screens for profitability, which often results in lower drawdowns, evidenced by the S&P 600’s 1.1% weekly drop versus the Russell 2000’s 1.6% sell off.
Weak Economic Data, U.S. Investment Restrictions, And Property Sector Concerns Weigh On Chinese Stocks. Last Tuesday, China released trade data from July, which taken together paint a picture of an economy in dire straits. Exports fell 14.5% year over year, below the -12.5% that was expected, and imports fell 12.4% year over year, much worse than the -5.4% expected. Aside from more weak economic data, restrictions placed on outbound U.S. investments in China tied to advanced semiconductors, quantum computing, and artificial intelligence (AI), as well as concerns building surrounding the beleaguered Chinese property market generated a 4.4% weekly drop in the MSCI China index. There have been signs that investor sentiment surrounding China may have bottomed at the end of May as the MSCI China index has made a series of higher lows and higher highs since, but last Friday’s selloff puts the index in a precarious spot from a technical perspective and more time may be needed for a durable bottom to form. We do expect the Chinese government and central bank to focus on stimulating consumption and economic growth in the coming months, and any incremental improvement in the economic outlook could lead to sizable inflows and improved relative performance.
Energy Stocks Continue To Catch A Bid, Outperform Crude Oil On The Week. The S&P 500 energy sector shrugged off weaker than expected economic data out of China, U.S. dollar strength, and choppiness in the broader market to gain 3.4% on the week. For comparison, West Texas Intermediate (WTI) crude oil hit a 10-month high last week but closed only 1% higher on the week. The S&P 500 energy sector is higher by 2.7% in August, and with the sector outperforming WTI on the week with breadth improving as more names trade above their 10- and 20-day moving averages, this move could have legs and is worth monitoring for what it might mean for inflation expectations and potential Fed policy over coming months.
Bonds: A Busy Week For Bonds As Treasury Auctions, Inflation Data, And The Bank Of Japan Contribute To Volatility; FOMC Likely To Stand Pat In September, But Uncertainty Remains.
Treasury Auctions Indicate Solid Demand From Abroad. Last Tuesday, the U.S. Treasury auctioned off $42B Of 3-year notes which was very well received as indirect bidders, primarily central banks abroad, took down 74% of the issue. Then, on Wednesday, Treasury auctioned $38B of 10-year Treasuries, and we would characterize those results as solid. The 3.999% high yield at auction was a couple of basis points below where the 10-year was trading at the time, and the bid-to- cover of 2.56% was the best since February, two metrics that indicate decent demand. Indirect bids, primarily from foreign central banks, rose to 72.2% vs. a 64% average for the last two 10-year auctions. With the Treasury up-sizing expected issuance through September just last week, we, and others, have been concerned with where demand for this increased issuance might come from, but if last week’s auction results are any indication, that may be less of a headwind than has been speculated. While last weeks’ auction results were encouraging, the July Consumer Price Index (CPI) and Producer Price Index (PPI) readings will prevent investors in long- dated Treasuries from breathing a sigh of relief. The 10- year Treasury yield is likely range-bound over coming months, in our view, with 4.25% still the key level on the upside to monitor as rising commodity prices and increased Treasury issuance continue to put upward pressure on yields.
FOMC Likely To Stand Pat In September, But That’s Far From A Given. U.S. Consumer Price Index (CPI) for July was released last Thursday. Headline CPI rose 0.2% month over month and 3.2% year over year, with the month over month reading in-line with the consensus estimate, while the year over year reading was a notch below the 3.3% expected. Core inflation, which excludes food and energy, rose 0.2% month over month and a 4.7% year over year reading was below the 4.8% figure expected. On balance, the Federal Open Market Committee (FOMC) is likely to view July CPI favorably, and Fed funds futures quickly responded by lowering the likelihood of a rate hike when the Committee meets again in mid-September. The FOMC is increasingly likely to stand pat when it meets next month but will try to keep its options open for November should rising crude and gasoline prices force inflation expectations higher.
BoJ Intervenes – Again. The Bank of Japan (BoJ) again stepped into stem a rise in yields by offering to buy bonds on the short- and intermediate sections of the Japanese Government Bond (JGB) curve last week. Lower sovereign yields abroad and higher rates in the U.S. led the yen to weaken significantly against the U.S. dollar, continuing a trend in place throughout much of July. Rising prices of energy- related commodities are also playing into weakness in the Japanese yen as concerns around energy supplies for the import-reliant country persist. BoJ Governor Ueda’s adoption of a more flexible yield curve control stance is a necessary step toward monetary policy of old, one that doesn’t spoon feed markets and allows for market-driven price discovery, but market participants will test this policy tweak and will likely continue to put upward pressure JGB yields as the price discovery process plays out. As yields drift higher in Japan, there is room for additional upward pressure on U.S. Treasury yields, but the propensity for policymakers in Japan to intervene in markets to prevent a rapid rise in yields will likely lead to something akin to a stair-step rise in rates stateside.
The content and any portion of this newsletter is for personal use only and may not be reprinted, sold or redistributed without the written consent of Regions Bank. Regions, the Regions logo and other Regions marks are trademarks of Regions Bank. The names and marks of other companies or their services or products may be the trademarks of their owners and are used only to identify such companies or their services or products and not to indicate endorsement or sponsorship of Regions or its services or products. The information and material contained herein is provided solely for general information purposes.
Regions does not make any warranty or representation relating to the accuracy, completeness or timeliness of any information contained in the newsletter and shall not be liable for any damages of any kind relating to such information nor as to the legal, regulatory, financial or tax implications of the matters referred herein. This material is not intended to be investment advice nor is this information intended as an offer or solicitation for the purchase or sale of any security or other financial instrument. Any opinions expressed herein are given in good faith, are subject to change without notice, and are only current as of the stated date of their issue. Regions Asset Management is a business group within Regions Bank that provides investment management services to customers of Regions Bank. Employees of Regions Asset Management may have positions in securities or their derivatives that may be mentioned in this report or in their personal accounts. Additionally, affiliated companies may hold positions in the mentioned companies in their portfolios or strategies. The companies mentioned specifically are sample companies, noted for illustrative purposes only.
The mention of the companies should not be construed as a recommendation to buy, hold or sell positions in your investment portfolio. Neither Regions Bank nor Regions Asset Management (collectively, “Regions”) are registered municipal advisors nor provide advice to municipal entities or obligated persons with respect to municipal financial products or the issuance of municipal securities (including regarding the structure, timing, terms and similar matters concerning municipal financial products or municipal securities issuances) or engage in the solicitation of municipal entities or obligated persons for such services.
With respect to this presentation and any other information, materials or communications provided by Regions, (a) Regions is not recommending an action to any municipal entity or obligated person, (b) Regions is not acting as an advisor to any municipal entity or obligated person and does not owe a fiduciary duty pursuant to Section 15 B of the Securities Exchange Act of 1934 to any municipal entity or obligated person with respect to such presentation, information, materials or communications, (c) Regions is acting for its own interests, and (d) you should discuss this presentation and any such other information, materials or communications with any and all internal and external advisors and experts that you deem appropriate before acting on this presentation or any such other information, materials or communications. Source: Bloomberg Index Services Limited. BLOOMBERG® is a trademark and service mark of Bloomberg Finance L.P. and its affiliates (collectively “Bloomberg”). BARCLAYS® is a trademark and service mark of Barclays Bank Plc (collectively with its affiliates, “Barclays”), used under license. Bloomberg or Bloomberg’s licensors, including Barclays, own all proprietary rights in the Bloomberg Barclays Indices. Neither Bloomberg nor Barclays approves or endorses this material or guarantees the accuracy or completeness of any information herein, or makes any warranty, express or implied, as to the results to be obtained therefrom and, to the maximum extent allowed by law, neither shall have any liability or responsibility for injury or damages arising in connection therewith.
Source: Bloomberg Index Services Limited. BLOOMBERG® is a trademark and service mark of Bloomberg Finance L.P. and its affiliates (collectively “Bloomberg”). BARCLAYS® is a trademark and service mark of Barclays Bank Plc (collectively with its affiliates, “Barclays”), used under license. Bloomberg or Bloomberg’s licensors, including Barclays, own all proprietary rights in the Bloomberg Barclays Indices. Neither Bloomberg nor Barclays approves or endorses this material or guarantees the accuracy or completeness of any information herein, or makes any warranty, express or implied, as to the results to be obtained therefrom and, to the maximum extent allowed by law, neither shall have any liability or responsibility for injury or damages arising in connection therewith.
The information provided herein is for informational purposes only and is intended to report on various investment views held by Multi-Asset Solutions (MAS) and Highland Associates. Opinions, estimates, forecasts, and statements of financial market trends are based on current market conditions that constitute the judgement of MAS and Highland Associates and are subject to change. The information is received from third parties, which is believed to be accurate, but no representation is made that the information provided is accurate and complete. The information is given as of the date indicated and believed to be reliable. While MAS and Highland have tried to provide accurate and timely information, there may be inadvertent technical or factual inaccuracies or typographical errors for which we apologize. The information provided herein does not constitute a solicitation or offer by Highland or its affiliates, to buy or sell any securities or other financial instrument, or to provide investment advice or service. Nothing contained herein should be construed as investment advice or a recommendation to purchase or sell a particular security. Investing involves a high degree of risk, and all investors should carefully consider their investment objective and the suitability of any investments.
Research services are provided through Multi-Asset Solutions, a department of the Regions Asset Management business group within Regions Bank. Highland is a wholly owned subsidiary of Regions Bank, which in turn is a wholly owned subsidiary of Regions Financial Corporation.
Past performance is not indicative of future results. Investments are subject to loss.