Stocks: U.S. Indices Range-Bound As Weaker Economic Data Offsets Solid Earnings Results; Profit Taking Hit Some Of This Year’s Biggest Winners As Capital Flows Favor High-Profile Laggards; Small Caps Rebound As Earnings Prove Better Than Feared; Broad-Based Strength In Developed Markets Abroad With Japan Leading.
Download Weekly Market Commentary | August 11 2025
What We’re Watching:
- The National Federation of Independent Business (NFIB) Small Business Optimism survey for July is released Tuesday and is expected to be unchanged from June.
- U.S. Consumer Price Index (CPI) for July is released Tuesday with the headline reading expected to show a rise of 0.2% month over month and 2.8% year over year. Core CPI, which excludes volatile food and energy prices, is expected to rise 0.3% month over month and 3.0% year over year. This will be the economic data point worth watching this week and could spur volatility, dictating the near-term direction for stocks and interest rates.
- The University of Michigan’s Consumer Sentiment index for August is released Friday and the reading is expected to improve modestly month over month to 62.1 from 61.7 the prior month. We will be most closely watching the inflation expectations component of the survey which have trended lower in recent months.
Key Observations
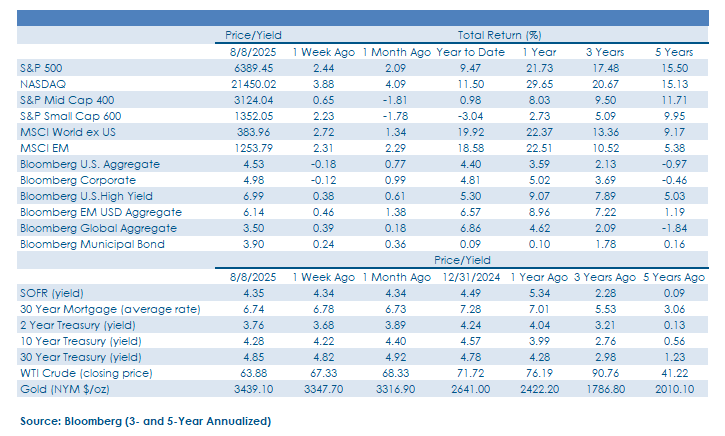
- U.S. equity indices recovered losses from the prior week while investors took profits, shifting capital out of some of this year’s biggest winners (cybersecurity, software, utilities) and putting it to work in recent laggards in the ‘Magnificent 7’ cohort, along with consumer staples and U.S. small caps, among other areas. The S&P 500 continued to move sideways, consolidating just below its all-time high, and the next potential upside catalyst we’re watching is Nvidia’s earnings release on August 27.
- Developed and developing market stocks performed well on an absolute basis and relative to U.S. indices on the week. On the developed markets front, Germany, Italy, Japan, and Spain led the charge, while France and the U.K. turned out gains but lagged the broader MSCI EAFE index. Within emerging markets, strength was even more broad-based with country indices tied to Brazil, Mexico, South Africa, and South Korea standout performers, while India remained a notable laggard.
- Yields on U.S. Treasuries maturing more than 1-year in the future rose on the week despite signs of softness in the services sector of the U.S. economy along with evidence of continued cooling in the labor market. Treasuries failing to rally even as soft economic data rolled in furthers our view that additional downside for yields on long-term U.S. Treasuries is limited in the near-term. Despite the modest back-up in Treasury yields on the week, non-core segments of the fixed income market performed well as credit spreads narrowed on the week, leading to gains for corporate bonds and emerging market debt.
What Happened Last Week:
Stocks: U.S. Indices Range-Bound As Weaker Economic Data Offsets Solid Earnings Results; Profit Taking Hit Some Of This Year’s Biggest Winners As Capital Flows Favor High-Profile Laggards; Small Caps Rebound As Earnings Prove Better Than Feared; Broad-Based Strength In Developed Markets Abroad With Japan Leading.
Signs Of Profit Taking, Rotation As U.S. Indices Recover Losses From The Prior Week. U.S. equity indices turned out gains on the week as market participants took profits in some of this year’s biggest winners and shifted capital into recent laggards at the individual stock and sector levels. What stood out most was the profit taking that took place in outperforming areas such as cybersecurity and software more broadly, along with utilities. In the case of cybersecurity and utilities stocks, solid earnings reports weren’t impressive enough to support lofty valuations as forward guidance fell short of expectations for some companies. On the other side of the ledger, pullbacks in some recent high-profile underperformers garnered heightened investor interest with ‘Mag 7’ members Amazon, Apple, and Tesla – all of which have trailed the S&P 500 year-to-date – rallying between 5.2% and 12.7% on the week. At the sector level, consumer discretionary and consumer staples stocks both caught a bid after underperforming the broader S&P 500 in July. In the case of the discretionary sector, last week’s 3.5% gain was largely attributable to the rebound out of Amazon and Tesla which sold off the prior week. For the staples sector, gains were relatively broad-based with Walmart rising 4.1%, while Costco and Procter & Gamble returned 2.6% and 1.8%, respectively.
Random Market Musings In An Otherwise Uneventful Week. The S&P 500 made a run back toward its late-July all-time high of 6,400 last Thursday and again on Friday, before ending the week just below that level at 6,389 and change. Given that the S&P 500 has historically faced tough sledding in the August/September timeframe, this is a logical spot in the calendar for investors buying dips in recent months to pivot to selling rips. There were signs that ‘sell the rips’ was dominating on Tuesday and Thursday last week as sizable opening gains faded as market participants took profits and rotated into some recent laggards. The S&P 500 succumbed to selling pressure and closed lower twice last week after opening higher, but the index didn’t challenge its’ 50-day moving average around 6,167. While remaining above this key moving average is encouraging, we would still not be surprised to see a pullback that tests that potential floor of support and the resolve of market bulls in the coming months, particularly if market breadth continues to narrow.
U.S./India Trade Tensions Mount, But Semiconductor Carveouts Boost Emerging Markets India’s equity index continued to lag the broader MSCI EM benchmark last week as the U.S. announced plans to double the tariff rate on the second largest emerging economy from 25% to 50% at month-end, citing India’s continued purchases of Russian crude oil. The President also cited non-tariff trade barriers from India as justification for the increase. The MSCI India index notched a 1.3% decline over the course of the week, which stands in stark contrast to the 2.3% weekly gain out of the MSCI EM index. Strength out of the broader EM index was partially attributable to tariff carveouts for foreign chipmakers investing in U.S. production, a decision that boosted a broad swath of foreign semiconductor manufacturers. Trade bifurcation is likely to remain a dominant theme and source of volatility, and escalating tensions with India reduce the likelihood of a near-term off-ramp, raising the risk of a prolonged dispute and underperformance out of India’s equity market.
Small Caps Keep Pace With Large Caps As Earnings Surprise To The Upside. Smaller company stocks rallied alongside their larger counterparts on the week as the S&P Small Cap 600 generated a 2.2% gain, just shy of the S&P 500’s 2.4% advance. A return of risk appetite at the start of last week provided a tailwind for higher beta segments including volatile small caps stocks, but signs of improving fundamentals sustained the rally. By the end of the week, the S&P Small Cap 600 index was beating street estimates for earnings by a staggering 15.4% after 90% of index constituents reported. Fundamental improvement was broad based as seven of the eleven sectors in the index posted double-digit surprises, with the energy sector leading. Utilities were the only sector to fall short of expectations, but the sector accounts for less than 2% of the benchmark. The analyst community overshot with downgrades in the wake of Liberation Day and heightened tariff uncertainty, setting up a low bar to chin this earnings season. Positive earnings revisions in the coming months could provide a tailwind for smaller companies and put small caps on better footing.
Developed Markets Abroad Rebound As The U.S. Dollar Reverses Course On New Tariff Announcements. The MSCI EAFE developed markets index rose 2.2% last week as broad-based strength out of the Eurozone helped push the index higher. Country indices tied to France, Germany, Italy, and Spain all rallied 2.0% or more on the week. Stocks in the U.K. failed to keep pace with Eurozone indices and ended the week higher by 0.8%. Japanese stocks also continued to move higher with the MSCI Japan index closing higher by 3.4% for its 3rd consecutive week of gains as strength out of Mitsubishi UFJ, Sony, and Nintendo, among others, were leading contributors.
Bonds: Treasury Rally Stalls As Yields Move Modestly Higher Despite Lackluster Economic Data; Corporate High Yield, Emerging Market Bonds Catch Bids; Auctions Poorly Received As Investors Balk At Buying Duration After The Recent Rally.
Bond Rally Tapped Out For Now As Weaker Economic Data Fails To Force Yields Lower. The 10-Year U.S. Treasury yield began the week at 4.20%, the lower bound of its 3-month range, but steadily climbed to 4.27% by the weekend. That upward move in rates came despite a disappointing July ISM Services PMI reading and continued modest increases in both initial and jobless claims. When bonds fail to rally on lackluster economic news after approaching overbought territory the path of least resistance tends to be higher for yields. Treasury yields on the long end still appear rangebound even after the recent move lower and a hotter than expected CPI report this week could allow yields to continue to drift higher.
Non-Core Sectors Recover Losses From The Prior Week. After being blindsided by the July Nonfarm Payrolls report to start the month, calm returned to credit markets last week as market participants expect softer labor market conditions to spur the FOMC to cut the Fed funds rate in September. The Bloomberg U.S. Corporate High Yield index advanced by just shy of 0.4% as credit spreads tightened, more than offsetting the move higher in Treasury yields, as positive earnings were a tailwind, particularly for credits tied to the energy sector. The earnings backdrop and the prospect of lower rates leave current spread levels just slightly below fair value, an encouraging indicator of risk appetite and demand. Beyond domestic fixed income, emerging market debt also saw robust demand last week as the U.S. dollar fell and emerging market currencies resumed their uptrend. In Mexico, one of the largest emerging bond markets, the country’s central bank cut rates last week as inflation hit its lowest level since 2020, justifying tighter spreads in a period where U.S. inflation has ticked higher in each of the last two months.
Treasury Auctions Point To Limited Demand For Long Bonds After The Drop In Yields. Last Wednesday, the U.S. Treasury auctioned off $42B of 10-year notes, but the issue was poorly received with the dealer community forced to take down over 16% of the issue, well above the 12% to 13% average seen in recent 10-year auctions. The 10-year was trading hands with a yield of 4.21% in the lead-up to the auction, but the high yield on the new issue hit 4.255% before the 10-year yield ended the day at 4.24%. Results from Thursday’s auction of $25B of 30-year bonds weren’t much better as the 30-year yield moved higher intra-day as the auction ‘tailed,’ and dealers took down 17% of the issue, well above the average of recent 30-year auctions. It is notable, however, that the 30-year yield ended Thursday unchanged from Wednesday’s close at 4.81%. All told, the 10- and 30-year auctions last week provided ample evidence that investors are balking at buying duration after the post-July Nonfarm Payrolls rally in Treasuries, and we see limited downside for yields in the near-term.
IMPORTANT DISCLOSURES: THIS PUBLICATION HAS BEEN PREPARED BY THE STAFF OF HIGHLAND ASSOCIATES, INC. FOR DISTRIBUTION TO, AMONG OTHERS, HIGHLAND ASSOCIATES, INC. CLIENTS. HIGHLAND ASSOCIATES IS REGISTERED WITH THE UNITED STATES SECURITY AND EXCHANGE COMMISSION UNDER THE INVESTMENT ADVISORS ACT OF 1940. HIGHLAND ASSOCIATES IS A WHOLLY OWNED SUBSIDIARY OF REGIONS BANK, WHICH IN TURN IS A WHOLLY OWNED SUBSIDIARY OF REGIONS FINANCIAL CORPORATION. RESEARCH SERVICES ARE PROVIDED THROUGH MULTI-ASSET SOLUTIONS, A DEPARTMENT OF THE REGIONS ASSET MANAGEMENT BUSINESS GROUP WITHIN REGIONS BANK. THE INFORMATION AND MATERIAL CONTAINED HEREIN IS PROVIDED SOLELY FOR GENERAL INFORMATION PURPOSES ONLY. TO THE EXTENT THESE MATERIALS REFERENCE REGIONS BANK DATA, SUCH MATERIALS ARE NOT INTENDED TO BE REFLECTIVE OR INDICATIVE OF, AND SHOULD NOT BE RELIED UPON AS, THE RESULTS OF OPERATIONS, FINANCIAL CONDITIONS OR PERFORMANCE OF REGIONS BANK. UNLESS OTHERWISE SPECIFICALLY STATED, ANY VIEWS, OPINIONS, ANALYSES, ESTIMATES AND STRATEGIES, AS THE CASE MAY BE (“VIEWS”), EXPRESSED IN THIS CONTENT ARE THOSE OF THE RESPECTIVE AUTHORS AND SPEAKERS NAMED IN THOSE PIECES AND MAY DIFFER FROM THOSE OF REGIONS BANK AND/OR OTHER REGIONS BANK EMPLOYEES AND AFFILIATES. VIEWS AND ESTIMATES CONSTITUTE OUR JUDGMENT AS OF THE DATE OF THESE MATERIALS, ARE OFTEN BASED ON CURRENT MARKET CONDITIONS, AND ARE SUBJECT TO CHANGE WITHOUT NOTICE. ANY EXAMPLES USED ARE GENERIC, HYPOTHETICAL AND FOR ILLUSTRATION PURPOSES ONLY. ANY PRICES/QUOTES/STATISTICS INCLUDED HAVE BEEN OBTAINED FROM SOURCES BELIEVED TO BE RELIABLE, BUT HIGHLAND ASSOCIATES, INC. DOES NOT WARRANT THEIR COMPLETENESS OR ACCURACY. THIS INFORMATION IN NO WAY CONSTITUTES RESEARCH AND SHOULD NOT BE TREATED AS SUCH. THE VIEWS EXPRESSED HEREIN SHOULD NOT BE CONSTRUED AS INDIVIDUAL INVESTMENT ADVICE FOR ANY PARTICULAR PERSON OR ENTITY AND ARE NOT INTENDED AS RECOMMENDATIONS OF PARTICULAR SECURITIES, FINANCIAL INSTRUMENTS, STRATEGIES OR BANKING SERVICES FOR A PARTICULAR PERSON OR ENTITY. THE NAMES AND MARKS OF OTHER COMPANIES OR THEIR SERVICES OR PRODUCTS MAY BE THE TRADEMARKS OF THEIR OWNERS AND ARE USED ONLY TO IDENTIFY SUCH COMPANIES OR THEIR SERVICES OR PRODUCTS AND NOT TO INDICATE ENDORSEMENT, SPONSORSHIP, OR OWNERSHIP BY REGIONS OR HIGHLAND ASSOCIATES. EMPLOYEES OF HIGHLAND ASSOCIATES, INC., MAY HAVE POSITIONS IN SECURITIES OR THEIR DERIVATIVES THAT MAY BE MENTIONED IN THIS REPORT. ADDITIONALLY, HIGHLAND’S CLIENTS AND COMPANIES AFFILIATED WITH HIGHLAND ASSOCIATES MAY HOLD POSITIONS IN THE MENTIONED COMPANIES IN THEIR PORTFOLIOS OR STRATEGIES. THIS MATERIAL DOES NOT CONSTITUTE AN OFFER OR AN INVITATION BY OR ON BEHALF OF HIGHLAND ASSOCIATES TO ANY PERSON OR ENTITY TO BUY OR SELL ANY SECURITY OR FINANCIAL INSTRUMENT OR ENGAGE IN ANY BANKING SERVICE. NOTHING IN THESE MATERIALS CONSTITUTES INVESTMENT, LEGAL, ACCOUNTING OR TAX ADVICE. NON-DEPOSIT PRODUCTS INCLUDING INVESTMENTS, SECURITIES, MUTUAL FUNDS, INSURANCE PRODUCTS, CRYPTO ASSETS AND ANNUITIES: ARE NOT FDIC-INSURED I ARE NOT A DEPOSIT I MAY GO DOWN IN VALUE I ARE NOT BANK GUARANTEED I ARE NOT INSURED BY ANY FEDERAL GOVERNMENT AGENCY I ARE NOT A CONDITION OF ANY BANKING ACTIVITY.
NEITHER REGIONS BANK NOR REGIONS ASSET MANAGEMENT (COLLECTIVELY, “REGIONS”) ARE REGISTERED MUNICIPAL ADVISORS NOR PROVIDE ADVICE TO MUNICIPAL ENTITIES OR OBLIGATED PERSONS WITH RESPECT TO MUNICIPAL FINANCIAL PRODUCTS OR THE ISSUANCE OF MUNICIPAL SECURITIES (INCLUDING REGARDING THE STRUCTURE, TIMING, TERMS AND SIMILAR MATTERS CONCERNING MUNICIPAL FINANCIAL PRODUCTS OR MUNICIPAL SECURITIES ISSUANCES) OR ENGAGE IN THE SOLICITATION OF MUNICIPAL ENTITIES OR OBLIGATED PERSONS FOR SUCH SERVICES. WITH RESPECT TO THIS PRESENTATION AND ANY OTHER INFORMATION, MATERIALS OR COMMUNICATIONS PROVIDED BY REGIONS, (A) REGIONS IS NOT RECOMMENDING AN ACTION TO ANY MUNICIPAL ENTITY OR OBLIGATED PERSON, (B) REGIONS IS NOT ACTING AS AN ADVISOR TO ANY MUNICIPAL ENTITY OR OBLIGATED PERSON AND DOES NOT OWE A FIDUCIARY DUTY PURSUANT TO SECTION 15B OF THE SECURITIES EXCHANGE ACT OF 1934 TO ANY MUNICIPAL ENTITY OR OBLIGATED PERSON WITH RESPECT TO SUCH PRESENTATION, INFORMATION, MATERIALS OR COMMUNICATIONS, (C) REGIONS IS ACTING FOR ITS OWN INTERESTS, AND (D) YOU SHOULD DISCUSS THIS PRESENTATION AND ANY SUCH OTHER INFORMATION, MATERIALS OR COMMUNICATIONS WITH ANY AND ALL INTERNAL AND EXTERNAL ADVISORS AND EXPERTS THAT YOU DEEM APPROPRIATE BEFORE ACTING ON THIS PRESENTATION OR ANY SUCH OTHER INFORMATION, MATERIALS OR COMMUNICATIONS.
SOURCE: BLOOMBERG INDEX SERVICES LIMITED. BLOOMBERG® IS A TRADEMARK AND SERVICE MARK OF BLOOMBERG FINANCE L.P. AND ITS AFFILIATES (COLLECTIVELY “BLOOMBERG”). BARCLAYS® IS A TRADEMARK AND SERVICE MARK OF BARCLAYS BANK PLC (COLLECTIVELY WITH ITS AFFILIATES, “BARCLAYS”), USED UNDER LICENSE. BLOOMBERG OR BLOOMBERG’S LICENSORS, INCLUDING BARCLAYS, OWN ALL PROPRIETARY RIGHTS IN THE BLOOMBERG BARCLAYS INDICES. NEITHER BLOOMBERG NOR BARCLAYS APPROVES OR ENDORSES THIS MATERIAL OR GUARANTEES THE ACCURACY OR COMPLETENESS OF ANY INFORMATION HEREIN, OR MAKES ANY WARRANTY, EXPRESS OR IMPLIED, AS TO THE RESULTS TO BE OBTAINED THEREFROM AND, TO THE MAXIMUM EXTENT ALLOWED BY LAW, NEITHER SHALL HAVE ANY LIABILITY OR RESPONSIBILITY FOR INJURY OR DAMAGES ARISING IN CONNECTION THEREWITH.