Stocks: U.S. Indices Found Their Footing In The Lead-Up To The Tariff Announcement On Short Covering, But Pulled Back Sharply After; Important To Put The Pullback In Proper Context; Tariff Announcement Furthers The Case For Geographic, Currency Diversification.
Download Weekly Market Commentary | April 7 2025
What We’re Watching:
- The National Federation of Independent Businesses (NFIB) Small Business Optimism index for March is released Tuesday with the reading expected to fall to 99.0 after a 100.7 reading in February.
- U.S. Consumer Price Index (CPI) for March is released Thursday with headline inflation expected to rise 0.1% month over month and 2.6% year over year, which compares to 0.2% and 2.8% readings in February. Core CPI, which is more closely monitored by policymakers, is expected to rise 0.3% month over month and 3.0% year over year, versus 0.2% and 3.1% readings the prior month.
- The University of Michigan’s Consumer Sentiment survey for April is released Friday and is expected to fall further to 54.0 from a 57.0 reading in March. This release has made headlines in recent months due to the sharp rise in the future inflation expectations component of the survey, and the 1-Yr. Inflation Expectations piece of the survey is expected to rise to 5.1% from 5.0% in February. Some stabilization in inflation expectations would be welcomed by market participants.
Key Observations
- U.S. stocks climbed a wall of worry in the lead-up to Wednesday’s tariff announcement as short covering forced equity prices higher, but a ‘worse than worst- case scenario’ on the trade front weighed on sentiment and led to a sharp move lower for stock prices into the weekend. The U.S. dollar fell after tariffs were announced and contributed to relative outperformance out of developed and developing market stocks abroad versus the U.S.
- It will be worth watching how our trading partners react to the tariff news; 1) will they negotiate and remove tariff barriers for U.S. imports as the administration desires, 2) will they retaliate, contributing to fears of an outright trade war, or 3) will they devalue their currencies to make their goods more appealing for U.S. importers, likely drawing the ire of the administration and potentially leading to tariffs being raised further on some countries.
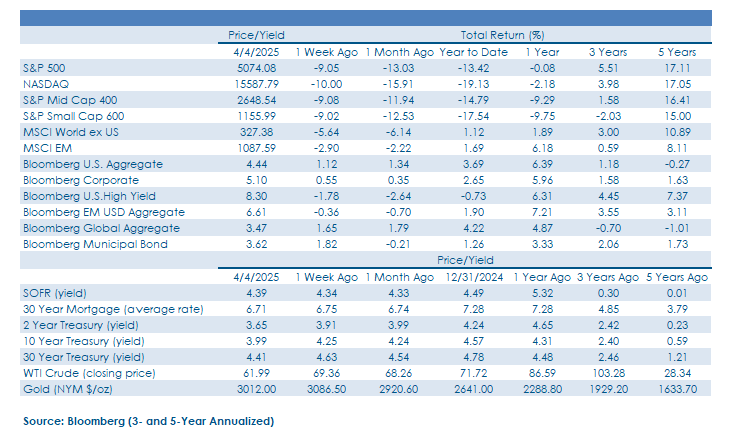
- Treasuries remained in bull market mode as yields across the curve fell as a flight to safety took hold on the heels of the tariff announcement. Yields on both the 2-year and 10-year U.S. Treasury fell more than 25-basis points on the week with the rally taking prices to levels last seen in September of last year.
What Happened Last Week:
Stocks: U.S. Indices Found Their Footing In The Lead-Up To The Tariff Announcement On Short Covering, But Pulled Back Sharply After; Important To Put The Pullback In Proper Context; Tariff Announcement Furthers The Case For Geographic, Currency Diversification.
‘Worse Than The Worst Case Scenario’ On Tariffs Weighs On U.S. Stocks, The Dollar; Focus Now Is On How Trading Partners Respond. President Trump’s tariff announcement on April 2 rattled markets and led to a sharp drop in stock prices and the U.S. dollar, and a commensurate rally in Treasury bonds as yields fell sharply on the week. We’ve seen the details described as ‘worse than the worst-case scenario.’ A universal 10% tariff was feared and delivered, which along with a blanketed 25% tariff on all imported automobiles (with some exclusions for USMCA-compliant goods from Canada and Mexico) appeared to generate the most investor angst. Whether the tariffs are used as a negotiating tactic and prove to be short-lived, or whether they remain in place over the intermediate term to encourage more domestic investment remains to be seen. It will be worth watching how our trading partners react to the news; 1) will they attempt to negotiate and/or remove tariff barriers for U.S. imports as the administration desires, 2) will they retaliate, thus generating fears of an outright trade war, or 3) will they attempt to ease monetary policy to stimulate economic growth and/or devalue their currencies to make their goods more appealing for U.S. importers, likely drawing the ire of the administration and potentially lead to tariffs being raised further on some countries. Mexico’s president has stated that that country would not retaliate, leading to hopes that tariffs could be reduced or removed on imported goods from that country, specifically. On the other hand, China already announced a retaliatory 34% tariff on U.S. imports Friday, which most view as a display of strength to save-face and put President Xi in a stronger negotiating position, but that also remains to be seen. If other countries enact a similar gameplan to Mexico and fail to escalate the situation then stocks should find their footing and respond positively in the coming months, but if more take China’s tact the downside could continue to dominate.
Putting The Pullback In Context. The S&P 500 fell 9% last week and is now lower by 13.4% year-to-date. While those are large and unsettling numbers to be sure, even after the selloff that has taken root over the past month and a half, the S&P 500 is just back to levels seen in August of 2024 during the initial unwind of the Japanese yen carry trade. Volatility (VIX) spiked last Thursday and made a new year-to-date high on Friday closing out the week above 45 as the S&P 500 fell 10.5% over that two-day stretch. This is a notable ‘higher high’ for the VIX and evidence of some degree of panic and a ‘get me out’ mentality which can coincide with more durable market bottoms. An elevated VIX makes the bar to chin for additional downside high as hedging costs are now exceedingly high for protection over the next 30 days. This is no guarantee that Friday’s flush is the bottom for stocks, but it’s worth noting that just 2 stocks in the Nasdaq 100 closed last Friday in positive territory, highlighting just how bad breadth was, particularly for communication services, consumer discretionary, and information technology stocks. With high trading volume behind Friday’s move lower, this is potentially a contrarian signal worth watching.
Tariffs Reinforce The Case For Diversification. On the equity front, there were few places to hide last week as U.S. indices as well as markets tied to Europe, Japan, and emerging markets all fell after the mid-week announcement on tariffs. Initially, stocks tied to developed and developing markets abroad held up better than U.S. large-caps and SMid, highlighting the continued value of geographic diversification. But it’s notable that the selloff spilled over outside the U.S. and made its way into foreign markets with Eurozone indices, specifically, pulling back in a big way into the weekend. The sharp drop in the U.S. dollar contributed to this relative outperformance and could buoy markets abroad as capital that has been hiding out in U.S. assets is repatriated and reallocated in its country of origin. At some point, the Trump administration is likely to pivot/shift and focus on more pro-growth policies, and if Canada and Mexico, specifically, attempt to deescalate the situation, U.S. equities could stabilize and find their footing in the coming weeks. From an asset allocation perspective, we remain neutral across asset classes and sub-asset classes. Diversification via geography and via exposures to assets denominated in foreign currencies remains desirable as we expect opportunities to be presented in the coming months/quarters as investors digest this news and see how it ultimately impacts economic growth and inflation. Swift market moves are unsettling, but investors with a longer- term investment horizon can take solace in improving valuations. At the time of this writing, the S&P 500 is trading at a more reasonable forward price-to-earnings (PE) ratio of 18.6 compared to 21.6 at the start of the year.
Bonds: Treasuries The Preferred ‘Risk-Off Asset’ In A Tough Tariff-Impacted Tape; Credit Spreads Widen, Corporate Bonds Cheapen As Issuance Drops Off; Labor Market Solid – For Now, Likely Keeping The Fed On The Sidelines In May.
Treasury Bond Bulls Big Winners Amid The Tariff Tumult. Core fixed income holdings were one of the few ports in the storm for investors last week with the Bloomberg Aggregate Bond index returning 1.1% as a lengthy list of tariffs were announced on a broad swath of the U.S.’ trading partners. Treasury yields fell every day last week, with the 10-year yield sinking by 26- basis points to close the week at 3.99%. The U.S. dollar reacted in kind to the move lower in Treasury yields, maintaining its positive correlation with interest rates with the U.S. Dollar Index (DXY) diving from 104.04 to 102.09 before rebounding slightly on Friday to 103.02 as sentiment around the U.S. economy’s standing relative to the rest of the world soured. With many investors wondering in recent years if they were getting the same diversification benefit from fixed income as they have grown accustomed to historically, the asset class has risen to the occasion during this latest bout of volatility, providing a lower correlation to equities and gains to help offset losses from stocks.
Credit Cheapens As Debt Issuance Comes To A Halt Due To Investor Angst. Higher quality corporate bonds that are stalwarts in most traditional investment portfolios couldn’t keep pace with the price appreciation out of U.S. Treasuries last week but did manage a respectable 0.5% gain on the week. Bond issuance dried up over the back-half of the week as trade uncertainty contributed to volatility which reverberated across markets. Just $6B of newly issued paper came to market prior to the tariff announcement and estimates calling for $10-15B in the coming week appears to be written in pencil, not pen. Valuations, as measured by option-adjusted spread (OAS), cheapened for both investment grade and high yield corporates with credit spreads in the latter widening enough to generate a negative total return for the Bloomberg U.S. Corporate High Yield index on the week. High grade bond spreads rose above 100-basis points for the first time in 2025 and high yield spreads widened by 75-basis points last week alone to 450-basis points above Treasuries, leading to a 1.7% weekly drop for lower quality bonds. The move is spreads is the largest weekly change since the onset of the pandemic in 2020 and captures the gravity of how markets are interpreting the potential impacts from the tariff announcement. Price declines that come with cheaper valuations can be difficult to stomach, but current investors that are reinvesting coupon payments at higher yields are set to benefit while those rushing for the exits crystalize losses.
March Nonfarm Payrolls Solid, Likely Keeping The Fed On The Sidelines. In the days leading up to President Trump’s tariff announcement, credit markets were already pushing yields lower as manufacturing gauges reflected a more downbeat view of the U.S. economy with the March Manufacturing ISM, specifically, falling further into contraction territory than expected. To add economic concerns, the February Job Openings and Labor Turnover Survey (JOLTS) revealed that both Job Openings and Quits fell by 4.5% and 2.0%, month over month, signaling less willingness to hire and fewer voluntary exits as the labor market has cooled. That decrease in labor demand comes at a time when we’re seeing new supply enter the market from the public sector as government job cuts surged to 217,000 during March per the Challenger US Job Cuts Index. Those job cuts didn’t make their way into Friday’s Nonfarm Payrolls report which surprised to the upside but may be a matter of ‘when’ not ‘if’ they make an impact. During March, 228k jobs were created, well above the140k estimate, although payrolls were revised lower by a net 48k for January and February. The unemployment rate ticked higher to 4.2% from 4.1% in February, but this was due to rounding and didn’t come in much above our estimate. Average hourly earnings rose 0.3% month over month, in-line with the consensus estimate, but the 3.8% year over year rise fell below the 4.0% estimate. Federal Open Market Committee (FOMC) Chairman Jerome Powell’s remarks on Friday were centered around the Fed’s role in keeping long-term inflation expectations anchored and noted that the labor market was on solid footing. Given the solid payrolls report, near-term intervention and policy easing out of the Fed or the resurgence of the ‘Fed Put’ seems off the table unless we see liquidity conditions deteriorate or seize up with markets unable to function or operate as normal. May could turn out to be a ‘live’ meeting, but June appears to be the earliest meeting at which a rate cut or policy easing of some sort will be on the viable.
IMPORTANT DISCLOSURES: THIS PUBLICATION HAS BEEN PREPARED BY THE STAFF OF HIGHLAND ASSOCIATES, INC. FOR DISTRIBUTION TO, AMONG OTHERS, HIGHLAND ASSOCIATES, INC. CLIENTS. HIGHLAND ASSOCIATES IS REGISTERED WITH THE UNITED STATES SECURITY AND EXCHANGE COMMISSION UNDER THE INVESTMENT ADVISORS ACT OF 1940. HIGHLAND ASSOCIATES IS A WHOLLY OWNED SUBSIDIARY OF REGIONS BANK, WHICH IN TURN IS A WHOLLY OWNED SUBSIDIARY OF REGIONS FINANCIAL CORPORATION. RESEARCH SERVICES ARE PROVIDED THROUGH MULTI-ASSET SOLUTIONS, A DEPARTMENT OF THE REGIONS ASSET MANAGEMENT BUSINESS GROUP WITHIN REGIONS BANK. THE INFORMATION AND MATERIAL CONTAINED HEREIN IS PROVIDED SOLELY FOR GENERAL INFORMATION PURPOSES ONLY. TO THE EXTENT THESE MATERIALS REFERENCE REGIONS BANK DATA, SUCH MATERIALS ARE NOT INTENDED TO BE REFLECTIVE OR INDICATIVE OF, AND SHOULD NOT BE RELIED UPON AS, THE RESULTS OF OPERATIONS, FINANCIAL CONDITIONS OR PERFORMANCE OF REGIONS BANK. UNLESS OTHERWISE SPECIFICALLY STATED, ANY VIEWS, OPINIONS, ANALYSES, ESTIMATES AND STRATEGIES, AS THE CASE MAY BE (“VIEWS”), EXPRESSED IN THIS CONTENT ARE THOSE OF THE RESPECTIVE AUTHORS AND SPEAKERS NAMED IN THOSE PIECES AND MAY DIFFER FROM THOSE OF REGIONS BANK AND/OR OTHER REGIONS BANK EMPLOYEES AND AFFILIATES. VIEWS AND ESTIMATES CONSTITUTE OUR JUDGMENT AS OF THE DATE OF THESE MATERIALS, ARE OFTEN BASED ON CURRENT MARKET CONDITIONS, AND ARE SUBJECT TO CHANGE WITHOUT NOTICE. ANY EXAMPLES USED ARE GENERIC, HYPOTHETICAL AND FOR ILLUSTRATION PURPOSES ONLY. ANY PRICES/QUOTES/STATISTICS INCLUDED HAVE BEEN OBTAINED FROM SOURCES BELIEVED TO BE RELIABLE, BUT HIGHLAND ASSOCIATES, INC. DOES NOT WARRANT THEIR COMPLETENESS OR ACCURACY. THIS INFORMATION IN NO WAY CONSTITUTES RESEARCH AND SHOULD NOT BE TREATED AS SUCH. THE VIEWS EXPRESSED HEREIN SHOULD NOT BE CONSTRUED AS INDIVIDUAL INVESTMENT ADVICE FOR ANY PARTICULAR PERSON OR ENTITY AND ARE NOT INTENDED AS RECOMMENDATIONS OF PARTICULAR SECURITIES, FINANCIAL INSTRUMENTS, STRATEGIES OR BANKING SERVICES FOR A PARTICULAR PERSON OR ENTITY. THE NAMES AND MARKS OF OTHER COMPANIES OR THEIR SERVICES OR PRODUCTS MAY BE THE TRADEMARKS OF THEIR OWNERS AND ARE USED ONLY TO IDENTIFY SUCH COMPANIES OR THEIR SERVICES OR PRODUCTS AND NOT TO INDICATE ENDORSEMENT, SPONSORSHIP, OR OWNERSHIP BY REGIONS OR HIGHLAND ASSOCIATES. EMPLOYEES OF HIGHLAND ASSOCIATES, INC., MAY HAVE POSITIONS IN SECURITIES OR THEIR DERIVATIVES THAT MAY BE MENTIONED IN THIS REPORT. ADDITIONALLY, HIGHLAND’S CLIENTS AND COMPANIES AFFILIATED WITH HIGHLAND ASSOCIATES MAY HOLD POSITIONS IN THE MENTIONED COMPANIES IN THEIR PORTFOLIOS OR STRATEGIES. THIS MATERIAL DOES NOT CONSTITUTE AN OFFER OR AN INVITATION BY OR ON BEHALF OF HIGHLAND ASSOCIATES TO ANY PERSON OR ENTITY TO BUY OR SELL ANY SECURITY OR FINANCIAL INSTRUMENT OR ENGAGE IN ANY BANKING SERVICE. NOTHING IN THESE MATERIALS CONSTITUTES INVESTMENT, LEGAL, ACCOUNTING OR TAX ADVICE. NON-DEPOSIT PRODUCTS INCLUDING INVESTMENTS, SECURITIES, MUTUAL FUNDS, INSURANCE PRODUCTS, CRYPTO ASSETS AND ANNUITIES: ARE NOT FDIC-INSURED I ARE NOT A DEPOSIT I MAY GO DOWN IN VALUE I ARE NOT BANK GUARANTEED I ARE NOT INSURED BY ANY FEDERAL GOVERNMENT AGENCY I ARE NOT A CONDITION OF ANY BANKING ACTIVITY.
NEITHER REGIONS BANK NOR REGIONS ASSET MANAGEMENT (COLLECTIVELY, “REGIONS”) ARE REGISTERED MUNICIPAL ADVISORS NOR PROVIDE ADVICE TO MUNICIPAL ENTITIES OR OBLIGATED PERSONS WITH RESPECT TO MUNICIPAL FINANCIAL PRODUCTS OR THE ISSUANCE OF MUNICIPAL SECURITIES (INCLUDING REGARDING THE STRUCTURE, TIMING, TERMS AND SIMILAR MATTERS CONCERNING MUNICIPAL FINANCIAL PRODUCTS OR MUNICIPAL SECURITIES ISSUANCES) OR ENGAGE IN THE SOLICITATION OF MUNICIPAL ENTITIES OR OBLIGATED PERSONS FOR SUCH SERVICES. WITH RESPECT TO THIS PRESENTATION AND ANY OTHER INFORMATION, MATERIALS OR COMMUNICATIONS PROVIDED BY REGIONS, (A) REGIONS IS NOT RECOMMENDING AN ACTION TO ANY MUNICIPAL ENTITY OR OBLIGATED PERSON, (B) REGIONS IS NOT ACTING AS AN ADVISOR TO ANY MUNICIPAL ENTITY OR OBLIGATED PERSON AND DOES NOT OWE A FIDUCIARY DUTY PURSUANT TO SECTION 15B OF THE SECURITIES EXCHANGE ACT OF 1934 TO ANY MUNICIPAL ENTITY OR OBLIGATED PERSON WITH RESPECT TO SUCH PRESENTATION, INFORMATION, MATERIALS OR COMMUNICATIONS, (C) REGIONS IS ACTING FOR ITS OWN INTERESTS, AND (D) YOU SHOULD DISCUSS THIS PRESENTATION AND ANY SUCH OTHER INFORMATION, MATERIALS OR COMMUNICATIONS WITH ANY AND ALL INTERNAL AND EXTERNAL ADVISORS AND EXPERTS THAT YOU DEEM APPROPRIATE BEFORE ACTING ON THIS PRESENTATION OR ANY SUCH OTHER INFORMATION, MATERIALS OR COMMUNICATIONS.
SOURCE: BLOOMBERG INDEX SERVICES LIMITED. BLOOMBERG® IS A TRADEMARK AND SERVICE MARK OF BLOOMBERG FINANCE L.P. AND ITS AFFILIATES (COLLECTIVELY “BLOOMBERG”). BARCLAYS® IS A TRADEMARK AND SERVICE MARK OF BARCLAYS BANK PLC (COLLECTIVELY WITH ITS AFFILIATES, “BARCLAYS”), USED UNDER LICENSE. BLOOMBERG OR BLOOMBERG’S LICENSORS, INCLUDING BARCLAYS, OWN ALL PROPRIETARY RIGHTS IN THE BLOOMBERG BARCLAYS INDICES. NEITHER BLOOMBERG NOR BARCLAYS APPROVES OR ENDORSES THIS MATERIAL OR GUARANTEES THE ACCURACY OR COMPLETENESS OF ANY INFORMATION HEREIN, OR MAKES ANY WARRANTY, EXPRESS OR IMPLIED, AS TO THE RESULTS TO BE OBTAINED THEREFROM AND, TO THE MAXIMUM EXTENT ALLOWED BY LAW, NEITHER SHALL HAVE ANY LIABILITY OR RESPONSIBILITY FOR INJURY OR DAMAGES ARISING IN CONNECTION THEREWITH.