Stocks: S&P 500 Shrugs Off Lackluster Economic Data, Closes The Week On A High Note As Earnings Boost Sentiment; Liquidity Backdrop For Stocks Set To Improve In The Near-Term; Breadth Remains Encouraging Abroad.
Download Weekly Market Commentary | April 29 2024
What We’re Watching:
- With Amazon and Apple, two members of the ‘Mag 7,’ set to report this week, the path for stocks this week hinges on earnings releases and commentary out of the FOMC above all else.
- Eurozone Consumer Price Index (CPI) for April is released Tuesday with a headline reading of 2.4% expected, which would be in-line with March. Perhaps more importantly for the European Central Bank from a monetary policy perspective, core CPI is expected to have risen 2.7% year over year, which would be a welcome downshift from 2.9% in March.
- The Federal Open Market Committee (FOMC) concludes its two-day meeting on Wednesday. No adjustment to the Fed funds rate is expected at this meeting, but market participants will be glued to Chair Jerome Powell’s post-meeting press conference in search of any clue as to the Committee’s current thinking regarding the potential timing of rate cuts. Any remarks or commentary related to the FOMC tapering quantitative tightening, or the pace at which the Fed’s balance sheet is shrinking, could prove market moving for Treasury yields as well.
- The April Nonfarm Payrolls report is released Friday with the consensus estimate calling for 205k jobs to have been created during the month. Average hourly earnings are expected to grow 0.3% month over month and 4.1% year over year, which would fall in-line with March readings.
Key Observations
- In the U.S., the S&P 500 shrugged off suboptimal economic data late in the week as earnings out of a handful of companies in the ‘Magnificent 7’ encouraged investors to deploy capital into some of the beneficiaries of the artificial intelligence (AI) theme. This remains an environment in which stock pickers focused on individual company fundamentals or secular growth themes can take advantage of any overreaction to news on the economic, geopolitical, or macro front.
- Abroad, both developed and emerging markets performed well on the week, and what stood out most was the impressive breadth or participation behind the moves. International equities, broadly speaking, remain attractively valued relative to U.S. stocks, which is supportive of the case for international diversification.
- A weak preliminary read on first quarter GDP and a hotter than expected core inflation reading during the quarter presented headwinds for both stocks and bonds late in the week as confidence surrounding a soft landing for the U.S. economy gave way to growing stagflation fears. However, the selloff in stocks and move higher in Treasury yields in the wake of the GDP release reversed quickly as market participants concluded that stagflation fears were overblown and that revisions to the GDP report would likely throw cold water on this narrative.
What Happened Last Week:
Stocks: S&P 500 Shrugs Off Lackluster Economic Data, Closes The Week On A High Note As Earnings Boost Sentiment; Liquidity Backdrop For Stocks Set To Improve In The Near-Term; Breadth Remains Encouraging Abroad.
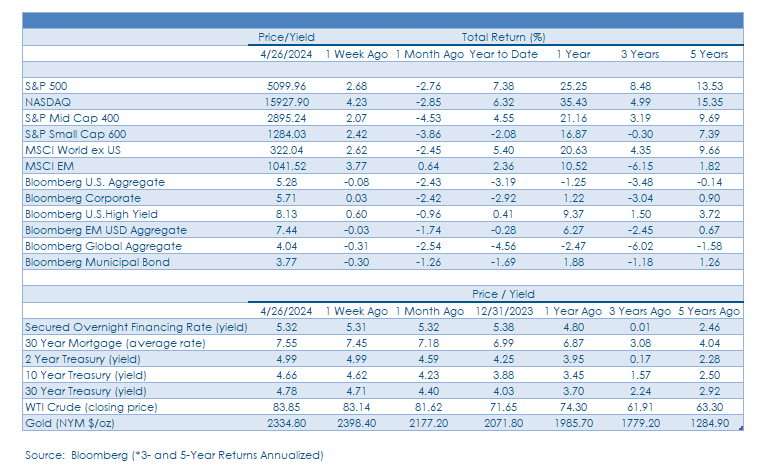
Earnings Offset Economic Angst, Rising Treasury Yields To Drive Weekly Gain: Stocks responded to oversold conditions and moved higher early last week with the S&P 500, S&P Mid Cap 400, and S&P Small Cap 600 each gaining more than 2% through Wednesday as positive earnings releases and relative calm in the Treasury market boosted sentiment and risk appetite. Positive sentiment shifted after market close on Wednesday when Meta Platforms (META), formerly known as Facebook, posted results as expense guidance was above expectations as the company geared up to invest in Artificial Intelligence (AI) infrastructure. Meta fell 10% on Thursday and weakness spread to some of the other ‘Magnificent 7’ names viewed as likely to issue similar guidance, but the S&P 500’s resiliency was on display as the index ended the day with only a 0.4% decline. Meta’s issues were quickly dismissed as both Microsoft and Alphabet (Google) reported earnings which were very well received after market close on Thursday. Microsoft rallied 2.5% on the heels of the release, while Alphabet popped 9% on Friday, propelling the S&P 500 to a 2.6% weekly gain. After last week, 45% of S&P 500 constituents have now posted quarterly results and 80% have topped the consensus earnings per share (EPS) estimate, while 60% have bested the consensus sales estimate. Notably, while the percentage of companies beating on EPS this quarter is in-line with 1Q23, the percentage beating on revenues is well shy of the 75% that did so one year ago.
Tailwinds For Stocks Building Into The Summer Months: April has been a challenging month for the S&P 500, broadly speaking, which comes as little surprise given strong year- to-date performance out of the index in the 1st quarter. However, we see reasons to believe that headwinds faced over the past month could be shifting in a more positive direction for stocks. Among them, historically, in election years such as this, a positive seasonal backdrop tends to emerge from May through October leading up to the November election. Much of that tailwind for stocks starting in May of a given election year is driven by elevated fiscal spending by the incumbent President’s party, and with tax filing season in the rearview mirror and the Treasury’s coffers restocked with cash, we expect fiscal spending to ramp up and greatly improve the liquidity backdrop, benefitting stocks. The reopening of the corporate buyback window this week is another potential upside catalyst for stocks that shouldn’t be overlooked, and with earnings season so far providing investors with the confidence to remain allocated to themes such as AI, datacenters, power generation, and aerospace and defense, among others, May should be a decent month for stocks, broadly speaking.
Constructive Price Action Across The Pond: Eurozone and U.K. stocks continued to perform well last week, as the Euro Stoxx 600 index rose 2.1% on the week, while the MSCI U.K. index fared even better with a 4% gain. As U.S. stocks struggled to gain ground in recent weeks, participation narrowed meaningfully, but interestingly, the advance out of U.K. and euro area equities has remained broad, with 70% or more of the constituents within country indices tied to France, Italy, Spain, and the U.K. still trading above their 10-day moving average. While this is admittedly a very short-term indicator, it is encouraging that there hasn’t been deterioration or lost momentum across the pond.
China Rally Boosts Emerging Market Indices: The MSCI China index rallied sharply last week, churning out a 7.4% gain and contributing in a big way to a 3.6% return out of the MSCI Emerging Markets (EM) index, but China was far from the lone bright spot. Country indices tied to Brazil, Mexico, South Korea, and Taiwan each rose 2.5% or more on the week while India was a notable laggard yet still gained 1.9%.
Bonds: Fixed Income Investors Still Hesitant To Buy Long-Term Bonds As Inflationary Pressures Persist; Stagflation Fears Overblown On The Heels Of Lackluster, Albeit Noisy, Economic Releases.
Treasury Yields Remain Volatile, But Most Maturities End The Week Little Changed: After briefly touching 4.75% in the middle of last week, the 10-year U.S. Treasury caught a modest bid into the weekend as March inflation data was largely in-line with expectations. After the relentless rise in yields on long-dated Treasuries since early March, the siren’s song of higher long-term yields has grown louder by the week, but with inflation data continuing to surprise to the upside, investors/allocators appear willing to wait for signs inflationary pressures are subsiding in a sustainable manner before stepping in to buy long-term bonds of any type. For the 10-year Treasury, specifically, the 4.75% level could loom large for both stocks and bonds. A break above that level could bring the November 2023 high of 5% quickly into play, which would likely spur a selloff in stocks and weakness in corporate bonds as well. Conversely, should the 10-year yield remain range bound and in the 4.50% to 4.70% area, assets of all types should respond positively.
1Q GDP Report Briefly Presents A Headwind For Stocks And Bonds: A preliminary read on first quarter U.S. GDP was released last Thursday with GDP rising at an annualized rate of 1.6% during the quarter, well shy of the 2.2% consensus estimate. Year over year, GDP rose 3.0% in the first quarter, a small miss relative to the 3.1% estimate. While the headline miss caught the attention of investors, the underlying details of the release paint a less dire view of the U.S. economy than might be portrayed in the media. Specifically, real private domestic demand, the sum of household and business spending, rose at a still strong 3.1% annual rate during the quarter, and two of the more volatile GDP components – inventories and trade – drove much of the ‘miss’ relative to the consensus estimate. However, what spurred a selloff in both stocks and bonds in the wake of the report was the inflation data embedded in the release. U.S. core consumer inflation surprised to the upside in a big way with the Core PCE Deflator rising at a 3.7% annualized rate during the quarter. The GDP release was taken by market participants as a sign that the prospect of stagflation should be on the radar of investors and that the path toward either an economic soft landing or no landing scenario was narrowing. From our perspective, the GDP release provided us with little in the way of surprises on either the economic growth or inflation front and despite the market’s initial reaction to the report, a soft landing for the U.S. economy remains our base-case, and as a result we believe stagflation fears are overblown. Investors appeared to come to that realization on Friday as Treasury yields fell modestly, but the stagflation narrative is unlikely to go quietly into that good night anytime soon.
Weaker April U.S. PMI, GDP Drags On The U.S. Dollar: The April Purchasing Managers Index (PMI) was released last Tuesday, with the Composite reading coming in at 50.9, below the 52.5 consensus estimate and the 52.1 reading from March. A reading above 50 indicates growth/expansion, while a reading below 50 indicates contraction, and with this metric teetering on the edge between expansion/contraction, market participants took this as a sign that economic growth might not be quite as strong as expected in the 2nd quarter. This realization initially put downward pressure on the U.S. dollar but ultimately, the Dollar index (DXY) ended the week down only modestly. The dollar remains relatively strong but with the DXY encountering resistance at its November ’23 high on multiple occasions, we believe upside is limited. A steady/stable dollar would be a most welcome sight and could potentially drive upside for our exposure to emerging markets debt, specifically, over the coming quarters.
IMPORTANT DISCLOSURES: THIS PUBLICATION HAS BEEN PREPARED BY THE STAFF OF HIGHLAND ASSOCIATES, INC. FOR DISTRIBUTION TO, AMONG OTHERS, HIGHLAND ASSOCIATES, INC. CLIENTS. HIGHLAND ASSOCIATES IS REGISTERED WITH THE UNITED STATES SECURITY AND EXCHANGE COMMISSION UNDER THE INVESTMENT ADVISORS ACT OF 1940. HIGHLAND ASSOCIATES IS A WHOLLY OWNED SUBSIDIARY OF REGIONS BANK, WHICH IN TURN IS A WHOLLY OWNED SUBSIDIARY OF REGIONS FINANCIAL CORPORATION. RESEARCH SERVICES ARE PROVIDED THROUGH MULTI-ASSET SOLUTIONS, A DEPARTMENT OF THE REGIONS ASSET MANAGEMENT BUSINESS GROUP WITHIN REGIONS BANK. THE INFORMATION AND MATERIAL CONTAINED HEREIN IS PROVIDED SOLELY FOR GENERAL INFORMATION PURPOSES ONLY. TO THE EXTENT THESE MATERIALS REFERENCE REGIONS BANK DATA, SUCH MATERIALS ARE NOT INTENDED TO BE REFLECTIVE OR INDICATIVE OF, AND SHOULD NOT BE RELIED UPON AS, THE RESULTS OF OPERATIONS, FINANCIAL CONDITIONS OR PERFORMANCE OF REGIONS BANK. UNLESS OTHERWISE SPECIFICALLY STATED, ANY VIEWS, OPINIONS, ANALYSES, ESTIMATES AND STRATEGIES, AS THE CASE MAY BE (“VIEWS”), EXPRESSED IN THIS CONTENT ARE THOSE OF THE RESPECTIVE AUTHORS AND SPEAKERS NAMED IN THOSE PIECES AND MAY DIFFER FROM THOSE OF REGIONS BANK AND/OR OTHER REGIONS BANK EMPLOYEES AND AFFILIATES. VIEWS AND ESTIMATES CONSTITUTE OUR JUDGMENT AS OF THE DATE OF THESE MATERIALS, ARE OFTEN BASED ON CURRENT MARKET CONDITIONS, AND ARE SUBJECT TO CHANGE WITHOUT NOTICE. ANY EXAMPLES USED ARE GENERIC, HYPOTHETICAL AND FOR ILLUSTRATION PURPOSES ONLY. ANY PRICES/QUOTES/STATISTICS INCLUDED HAVE BEEN OBTAINED FROM SOURCES BELIEVED TO BE RELIABLE, BUT HIGHLAND ASSOCIATES, INC. DOES NOT WARRANT THEIR COMPLETENESS OR ACCURACY. THIS INFORMATION IN NO WAY CONSTITUTES RESEARCH AND SHOULD NOT BE TREATED AS SUCH. THE VIEWS EXPRESSED HEREIN SHOULD NOT BE CONSTRUED AS INDIVIDUAL INVESTMENT ADVICE FOR ANY PARTICULAR PERSON OR ENTITY AND ARE NOT INTENDED AS RECOMMENDATIONS OF PARTICULAR SECURITIES, FINANCIAL INSTRUMENTS, STRATEGIES OR BANKING SERVICES FOR A PARTICULAR PERSON OR ENTITY. THE NAMES AND MARKS OF OTHER COMPANIES OR THEIR SERVICES OR PRODUCTS MAY BE THE TRADEMARKS OF THEIR OWNERS AND ARE USED ONLY TO IDENTIFY SUCH COMPANIES OR THEIR SERVICES OR PRODUCTS AND NOT TO INDICATE ENDORSEMENT, SPONSORSHIP, OR OWNERSHIP BY REGIONS OR HIGHLAND ASSOCIATES. EMPLOYEES OF HIGHLAND ASSOCIATES, INC., MAY HAVE POSITIONS IN SECURITIES OR THEIR DERIVATIVES THAT MAY BE MENTIONED IN THIS REPORT. ADDITIONALLY, HIGHLAND’S CLIENTS AND COMPANIES AFFILIATED WITH HIGHLAND ASSOCIATES MAY HOLD POSITIONS IN THE MENTIONED COMPANIES IN THEIR PORTFOLIOS OR STRATEGIES. THIS MATERIAL DOES NOT CONSTITUTE AN OFFER OR AN INVITATION BY OR ON BEHALF OF HIGHLAND ASSOCIATES TO ANY PERSON OR ENTITY TO BUY OR SELL ANY SECURITY OR FINANCIAL INSTRUMENT OR ENGAGE IN ANY BANKING SERVICE. NOTHING IN THESE MATERIALS CONSTITUTES INVESTMENT, LEGAL, ACCOUNTING OR TAX ADVICE. NON-DEPOSIT PRODUCTS INCLUDING INVESTMENTS, SECURITIES, MUTUAL FUNDS, INSURANCE PRODUCTS, CRYPTO ASSETS AND ANNUITIES: ARE NOT FDIC-INSURED I ARE NOT A DEPOSIT I MAY GO DOWN IN VALUE I ARE NOT BANK GUARANTEED I ARE NOT INSURED BY ANY FEDERAL GOVERNMENT AGENCY I ARE NOT A CONDITION OF ANY BANKING ACTIVITY.
NEITHER REGIONS BANK NOR REGIONS ASSET MANAGEMENT (COLLECTIVELY, “REGIONS”) ARE REGISTERED MUNICIPAL ADVISORS NOR PROVIDE ADVICE TO MUNICIPAL ENTITIES OR OBLIGATED PERSONS WITH RESPECT TO MUNICIPAL FINANCIAL PRODUCTS OR THE ISSUANCE OF MUNICIPAL SECURITIES (INCLUDING REGARDING THE STRUCTURE, TIMING, TERMS AND SIMILAR MATTERS CONCERNING MUNICIPAL FINANCIAL PRODUCTS OR MUNICIPAL SECURITIES ISSUANCES) OR ENGAGE IN THE SOLICITATION OF MUNICIPAL ENTITIES OR OBLIGATED PERSONS FOR SUCH SERVICES. WITH RESPECT TO THIS PRESENTATION AND ANY OTHER INFORMATION, MATERIALS OR COMMUNICATIONS PROVIDED BY REGIONS, (A) REGIONS IS NOT RECOMMENDING AN ACTION TO ANY MUNICIPAL ENTITY OR OBLIGATED PERSON, (B) REGIONS IS NOT ACTING AS AN ADVISOR TO ANY MUNICIPAL ENTITY OR OBLIGATED PERSON AND DOES NOT OWE A FIDUCIARY DUTY PURSUANT TO SECTION 15B OF THE SECURITIES EXCHANGE ACT OF 1934 TO ANY MUNICIPAL ENTITY OR OBLIGATED PERSON WITH RESPECT TO SUCH PRESENTATION, INFORMATION, MATERIALS OR COMMUNICATIONS, (C) REGIONS IS ACTING FOR ITS OWN INTERESTS, AND (D) YOU SHOULD DISCUSS THIS PRESENTATION AND ANY SUCH OTHER INFORMATION, MATERIALS OR COMMUNICATIONS WITH ANY AND ALL INTERNAL AND EXTERNAL ADVISORS AND EXPERTS THAT YOU DEEM APPROPRIATE BEFORE ACTING ON THIS PRESENTATION OR ANY SUCH OTHER INFORMATION, MATERIALS OR COMMUNICATIONS.
SOURCE: BLOOMBERG INDEX SERVICES LIMITED. BLOOMBERG® IS A TRADEMARK AND SERVICE MARK OF BLOOMBERG FINANCE L.P. AND ITS AFFILIATES (COLLECTIVELY “BLOOMBERG”). BARCLAYS® IS A TRADEMARK AND SERVICE MARK OF BARCLAYS BANK PLC (COLLECTIVELY WITH ITS AFFILIATES, “BARCLAYS”), USED UNDER LICENSE. BLOOMBERG OR BLOOMBERG’S LICENSORS, INCLUDING BARCLAYS, OWN ALL PROPRIETARY RIGHTS IN THE BLOOMBERG BARCLAYS INDICES. NEITHER BLOOMBERG NOR BARCLAYS APPROVES OR ENDORSES THIS MATERIAL OR GUARANTEES THE ACCURACY OR COMPLETENESS OF ANY INFORMATION HEREIN, OR MAKES ANY WARRANTY, EXPRESS OR IMPLIED, AS TO THE RESULTS TO BE OBTAINED THEREFROM AND, TO THE MAXIMUM EXTENT ALLOWED BY LAW, NEITHER SHALL HAVE ANY LIABILITY OR RESPONSIBILITY FOR INJURY OR DAMAGES ARISING IN CONNECTION THEREWITH.