
Download Asset Allocation | September 2025
The Weight
Economic Update
An Uncertain Path Ahead
September, a typically punishing month for S&P 500 investors, has arrived with an unexpected calm. As fall approaches and the summer heat ebbs, the contrast becomes evident. This year has been anything but cool or calm. Global conflicts surged, and the pace of executive orders out of Washington is running at almost triple the rate of any year on record. As a softening labor market casts a shadow on the economic outlook, the Fed, as expected, cut rates this month. The update Dot Plot implies two further twenty-five basis point cuts by the end of 2025. At least for today, the Fed may finally be singing the tune markets want to hear, signaling- I do believe it’s time, as The Band once sang.
Despite the weight of tariffs and jobs data, U.S. equities have continued their climb- defying the seasonal trend. The U.S. dollar and treasury yields, however, have felt the gravity of tariff policies, with rates falling to their lowest level since April. While easing rates often pull currencies lower still, many believe markets have priced in this weakness. Historically, currency weakness and tariffs are meaningful drivers of inflation over the short term. As September’s CPI release accelerates to its fastest pace in seven months, probabilities increase that consumers and companies go looking for a place to hide from inflation.
Beneath headlines, the strain is showing. Second quarter corporate profit margins reveal suppliers and companies are shouldering much of the tariff burden. As inflation potentially causes profitability growth to slow, will this persist? Or will incremental inflation be shared differently? Will corporations continue to take a load for free or will they put the load right on the consumer? As October’s potential government shutdown looms, the question remains: can the U.S. economy sustain momentum against the gathering headwind, or will the slowdown many have expected finally materialize?
Based on revised and more complete source data, the Bureau of Economic Analysis (BEA) now puts Q2 real GDP growth at an annual rate of 3.3 percent, up from the initial estimate of 3.0 percent growth. At the same time, real private domestic demand – combined business and household spending adjusted for price changes – is now reported to have grown at a 1.9 percent rate in Q2, up from the initial estimate of 1.2 percent. The revisions to growth in real GDP and real private domestic demand largely reflect hefty upward revisions to the BEA’s original estimates of business investment in machinery and equipment and intellectual property products, with an assist from a modest upward revision to the original estimate of growth in real consumer spending.
The BEA’s second look at Q2 real GDP also brought their first look at Q2 corporate profits. The profits data took on added interest, with many looking to the Q2 data for clues on how higher tariff rates may have impacted corporate bottom lines, particularly given that at least thus far the retail-level data on inflation suggest only a limited tariff pass-through. If not passing higher tariffs along in the form of higher prices, firms are either inducing suppliers to take on some of the tariff burden, shifting orders to countries facing lower tariff rates, or simply absorbing the tariff burden out of margins, though in many cases it is some combination of all of the above. Either way, given the extent to which firms rushed to build inventories over the first few months of this year to avoid, at least temporarily, tariff-related price hikes on inputs to production and final goods ordered from abroad, the Q2 profits data were unlikely to offer definitive evidence of the impact of higher tariffs.
Using the measure (profits without adjustments for inventory valuation and capital consumption) most comparable to the S&P 500 measure, the GDP measure of corporate profits snapped back from a weak first quarter, with before-tax profits rising by 1.2 percent in Q2 and after-tax profits rising by 1.4 percent. These translate into year-on-year increases of 6.9 percent on a before-tax basis and 7.0 percent on an after-tax basis. While profit margins narrowed modestly in Q2, they nonetheless remain considerably wider than historical norms and pre-pandemic margins. Obviously, as with any aggregate measure, not all firms in all industries would have been in that position, and some firms in some industry groups may have been willing to take a more aggressive pricing posture from the outset, which to some extent is consistent with the somewhat scattered increases in goods prices seen in the measures of producer and consumer prices to date. The broader point here, however, is that elevated margins are one reason why we never thought it realistic to expect an immediate jump in prices as higher tariff rates took effect.
We’re getting to the point, however, where more firms will have to begin making what could be some tough decisions on pricing. Inventories accumulated earlier in the year have not yet been totally drawn down but are getting leaner. At the same time, while there have been some deals reached with foreign trading partners, there is still a great deal of uncertainty around where tariff rates will ultimately settle, and that point applies independent of a still-uncertain outcome of legal challenges to many of the higher tariffs now in place. While these are things we can see in tracking the various economic data series and surveys, these are also points made by many firms in the latest round of corporate earnings calls.
What remains to be seen is whether, or to what extent, firms will take steps to prevent further erosion in profit margins. In lieu of passing along the costs of higher tariffs in the form of higher prices, firms could instead scale back on capital spending and/or total labor input. Comments along those lines were not uncommon in the latest round of corporate earnings calls, with many firms stressing increased efficiency and holding the line on hiring. We obviously cannot quantify the extent to which this may be a factor in what has been a pronounced slowdown in the pace of monthly job growth, but it is reasonable to think that it has played at least some role.
One potentially important factor in such deliberations is that recent changes to the tax code, particularly expanded deductions for capital spending, expenditures on research and development, and interest payments should free up additional cash that could serve as a buffer against higher tariff costs. These expanded deductions could spur faster growth in after-tax profits, thus leaving more cash on corporate balance sheets. To be sure, corporations could put more emphasis on returning capital to shareholders while continuing to push for greater efficiency and thus still hold the line on hiring or capital outlays, but these expanded deductions should help offset higher tariff costs, particularly given a starting point of elevated profit margins. While we and most others still expect to see further, and more broadly based, tariff pass-through in the months ahead, a starting point of elevated profit margins along with the prospect of enhanced cash flows could mitigate the extent of tariff pass-through.
Total nonfarm payrolls rose by just 22,000 jobs in August, while prior estimates of job growth in June and July were revised modestly lower. While we have for months been pointing to a slowing trend rate of job growth, there are two questions that we and others are still trying to answer. First, to what extent has trend job growth truly slowed? Second, what is behind the slowing trend rate of job growth? We’ve routinely pointed to measurement and collection issues that continue to cloud the data from both the establishment and household surveys, making it difficult to answer the first question. As for the answer to the second question, while increased emphasis on efficiency and controlling operating costs may be a factor, we continue to argue that the steep decline in the foreign-born labor force – down by over one million people between January and August – is a bigger drag on job growth. We’d also argue that this is not getting nearly as much discussion as it merits, perhaps because it is not possible to directly quantify any such effects in the BLS’s establishment survey data.
Absent clear answers to the two questions posed above, it’s hard to have much confidence in anyone’s outlook for the labor market, whatever that outlook may be. The same is true of the outlook for inflation, and that will remain the case until there is more clarity around the ultimate degree of tariff passthrough. Anyone who thinks this question has already been settled need only look to the Institute for Supply Management’s (ISM) August surveys of the manufacturing and services sectors. Comments from survey respondents suggest that not only is uncertainty around tariffs impacting current orders and pricing but also that price effects will be more significant going forward, which goes to the point we made above about firms having to make tough decisions on pricing.
With inflation already running well ahead of their 2.0 percent target, this leaves an increasingly divided FOMC to debate which is the most pressing risk – the downside risk to the labor market or the upside risk to inflation. While we have for months expected a twenty-five-basis point cut in the Fed funds rate at this month’s FOMC meeting, we also think markets may be too aggressive in pricing in subsequent cuts. This month’s meeting will bring an updated set of economic and financial projections, and market participants will be focused on the path of the funds rate implied by the updated dot plot. We think it worth noting, however, that in the FOMC’s June projections the median forecast put the unemployment rate at 4.5 percent in Q4 2025 and core PCE inflation at 3.1 percent, with the June edition of the dot plot implying only seventy-five basis points of cuts in the funds rate by year-end 2026.
In other words, the June projections seem to have clearly anticipated much of what we’re now seeing, i.e., softening labor market conditions and lingering inflation pressures. It could be that at least some of the cuts now priced into the markets reflect expectations of changes in the composition of the FOMC, yielding a more aggressive series of funds rate cuts than the Committee as now comprised would deliver. While we do not discount that possibility, we nonetheless think many market participants may be underestimating the Committee’s resolve to push inflation closer to their 2.0 percent target rate.
Sources: Bureau of Economic Analysis; Bureau of Labor Statistics
Investment Strategy Update
Regions Multi-Asset Solutions & Highland Associates
As we noted in last month’s outlook, the S&P 500 has historically fared quite poorly in September, with the index generating an average return of -1.1% during the month dating back to 1928. From a ‘’batting average’ perspective, odds favor the S&P 500 ending the month lower; since 1928 the S&P 500 has closed out September lower 53 times and higher 43 times, making September the only calendar month in which the index has been down more than it has been up. Finally, when the S&P 500 fell in September, the average decline has been 4.7% – that data point alone should give investors angst about what could materialize in the coming weeks. Still, the S&P 500’s September struggles have been well documented and widely discussed, which is reason enough for contrarians to stand up and take notice.
With most market participants already expecting and potentially positioned for stocks to pull back this month, we are reminded of Bernard Baruch’s famous quip that “the main purpose of the stock market is to make fools of as many men as possible.” Elevated volatility in the bond market could contribute to a choppier trading environment for U.S. large cap stocks this month, and with investor sentiment still fragile even five months and some 1,700 S&P 500 points off the April lows, a modest pullback can’t be ruled out. However, with the FOMC likely to cut the Fed funds rate mid-month and investors keen to buy in advance of the historically profitable October through January stretch, any drawdown will likely be viewed as a buying opportunity.
U.S. large cap stocks fared better than has typically been the case in August, with measures of market breadth improving as capital rotated out of some of this year’s biggest winners and found its way into some of the lagging sectors or industry groups. This is evidence of a constructive and healthy backdrop for stocks, broadly speaking. And with better breadth behind the S&P 500’s push to new all-time highs last month and earlier this month, the onus is on the bears to show they can put sustained downward pressure on equity prices for more than a week. Suffice it to say that we don’t expect bulls to go down without putting up a fight despite September’s reputation as being unkind to those with an optimistic outlook on U.S. stocks.
Small caps have surged with expectations in interest rate cuts.With continued signs of labor market softening, a quarter point cut to the Fed funds rate is all but certain at this month’s FOMC meeting. Market participants have been coming around to investments that tend to fare best in an environment characterized by falling/lower interest rates, and as a result the S&P Small Cap 600 surged by 7% on a total return basis in August, outpacing the S&P 500’s 2% gain. Prior instances in which the FOMC paused before resuming policy easing suggest dusting off the old play book could prove profitable for patient investors. Smaller company stocks have outperformed large caps in the year following a pause in four of the most recent five instances after rate cuts resumed. That macro tailwind could be enough to get capital moving into relatively attractive valuations and improving fundamentals for small caps that we’ve highlighted in recent months. Rate cuts could embolden bulls and lead to broader participation, which could act as a springboard for the next leg higher in U.S. equities.
After An FOMC Pause, Small Caps Have Historically Played Catch Up Into And After The Next Cut
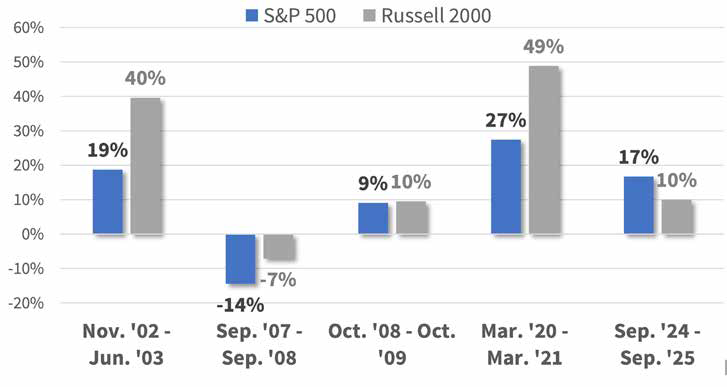
Source: Bloomberg
Lackluster breadth in the MSCI EAFE index raises a caution flag in international developed equities. The MSCI EAFE, rose 4% in August with Japan leading the charge as the country’s Nikkei 225 index rose 7% during the month. In early September, over 75% of Nikkei 225 constituents traded above their 20-day moving average and over 88% of constituents were trading above their 100-day moving average, a sign of broad-based participation in the rally that should be supportive of further upside. However, U.K. and Euro area equities also generated gains during the month, but breadth measures are far less encouraging as less than 35% of the Eurostoxx 600 index and around 43% of the U.K.’s FTSE 100 traded above the 20-day moving average in early September.
We are incrementally more constructive on the outlook for Japanese equities as the breadth and momentum behind the Nikkei’s move to fresh all-time highs shouldn’t be ignored. However, downgrades to the outlook for euro area economic growth are possible as stepped-up fiscal spending fails to offset structural headwinds, and the prospect of political upheaval and a more uncertain fiscal outlook in the U.K. could weigh on sentiment and spur capital outflows from that market.
Bonds are facing a “High Quality” problem. With the notable exception of 20- and 30-year bonds, yields fell across the Treasury curve in August, contributing to a 1.2% monthly gain out of the Bloomberg Aggregate Bond index. The 10-year Treasury yield ended August at 4.23% after again encountering resistance in the 4.15% to 4.20% zone twice during the month. However, the 10-year yield finally made a weekly close below the lower-end of that range in the first week of September as evidence of further softness in the labor market rolled in. While this is a potential character change that could usher in additional downside for yields in the belly of the curve, it could also prove to be a head fake with investors late to the rally in higher quality, longer duration bonds facing tougher sledding.
The sharp move lower in yields appears overdone, and our view is that yields on Treasuries in the belly of the yield curve (3- to 10-years) are more likely to rise than fall from current levels. Interestingly, the rally in U.S. Treasuries in early September occurred despite continued upward pressure on yields on longer-dated sovereign bonds abroad. This divergence is a result of capital being reallocated from foreign debt markets into U.S.-dollar denominated assets – more on that later – but we have reason to question the durability of this source of demand.
The FOMC cut the Fed funds rate by one quarter point this month (in line with expectations), but inflation readings remain well above the Fed’s 2% target. As a result, we don’t expect the FOMC to be as aggressive in cutting the funds rate as many market participants appear to, and we expect the 10-year yield to ultimately retest the 4.15%-4.20% range. Investment grade corporate bonds rallied alongside Treasuries in August and the spread over the Treasury curve for the Bloomberg Corporate Bond index approached year-to-date lows mid-month, evidence of continued robust demand even though investors are receiving less compensation for taking credit risk. With yields low and credit spreads historically tight, we are tempering our expectations for higher quality, longer duration corporate bonds and see better near-term opportunities outside of this segment of the fixed income market. Diversification remains key as interest rate volatility is likely to remain elevated, and with the back-up in yields abroad, foreign bonds are increasingly appealing.
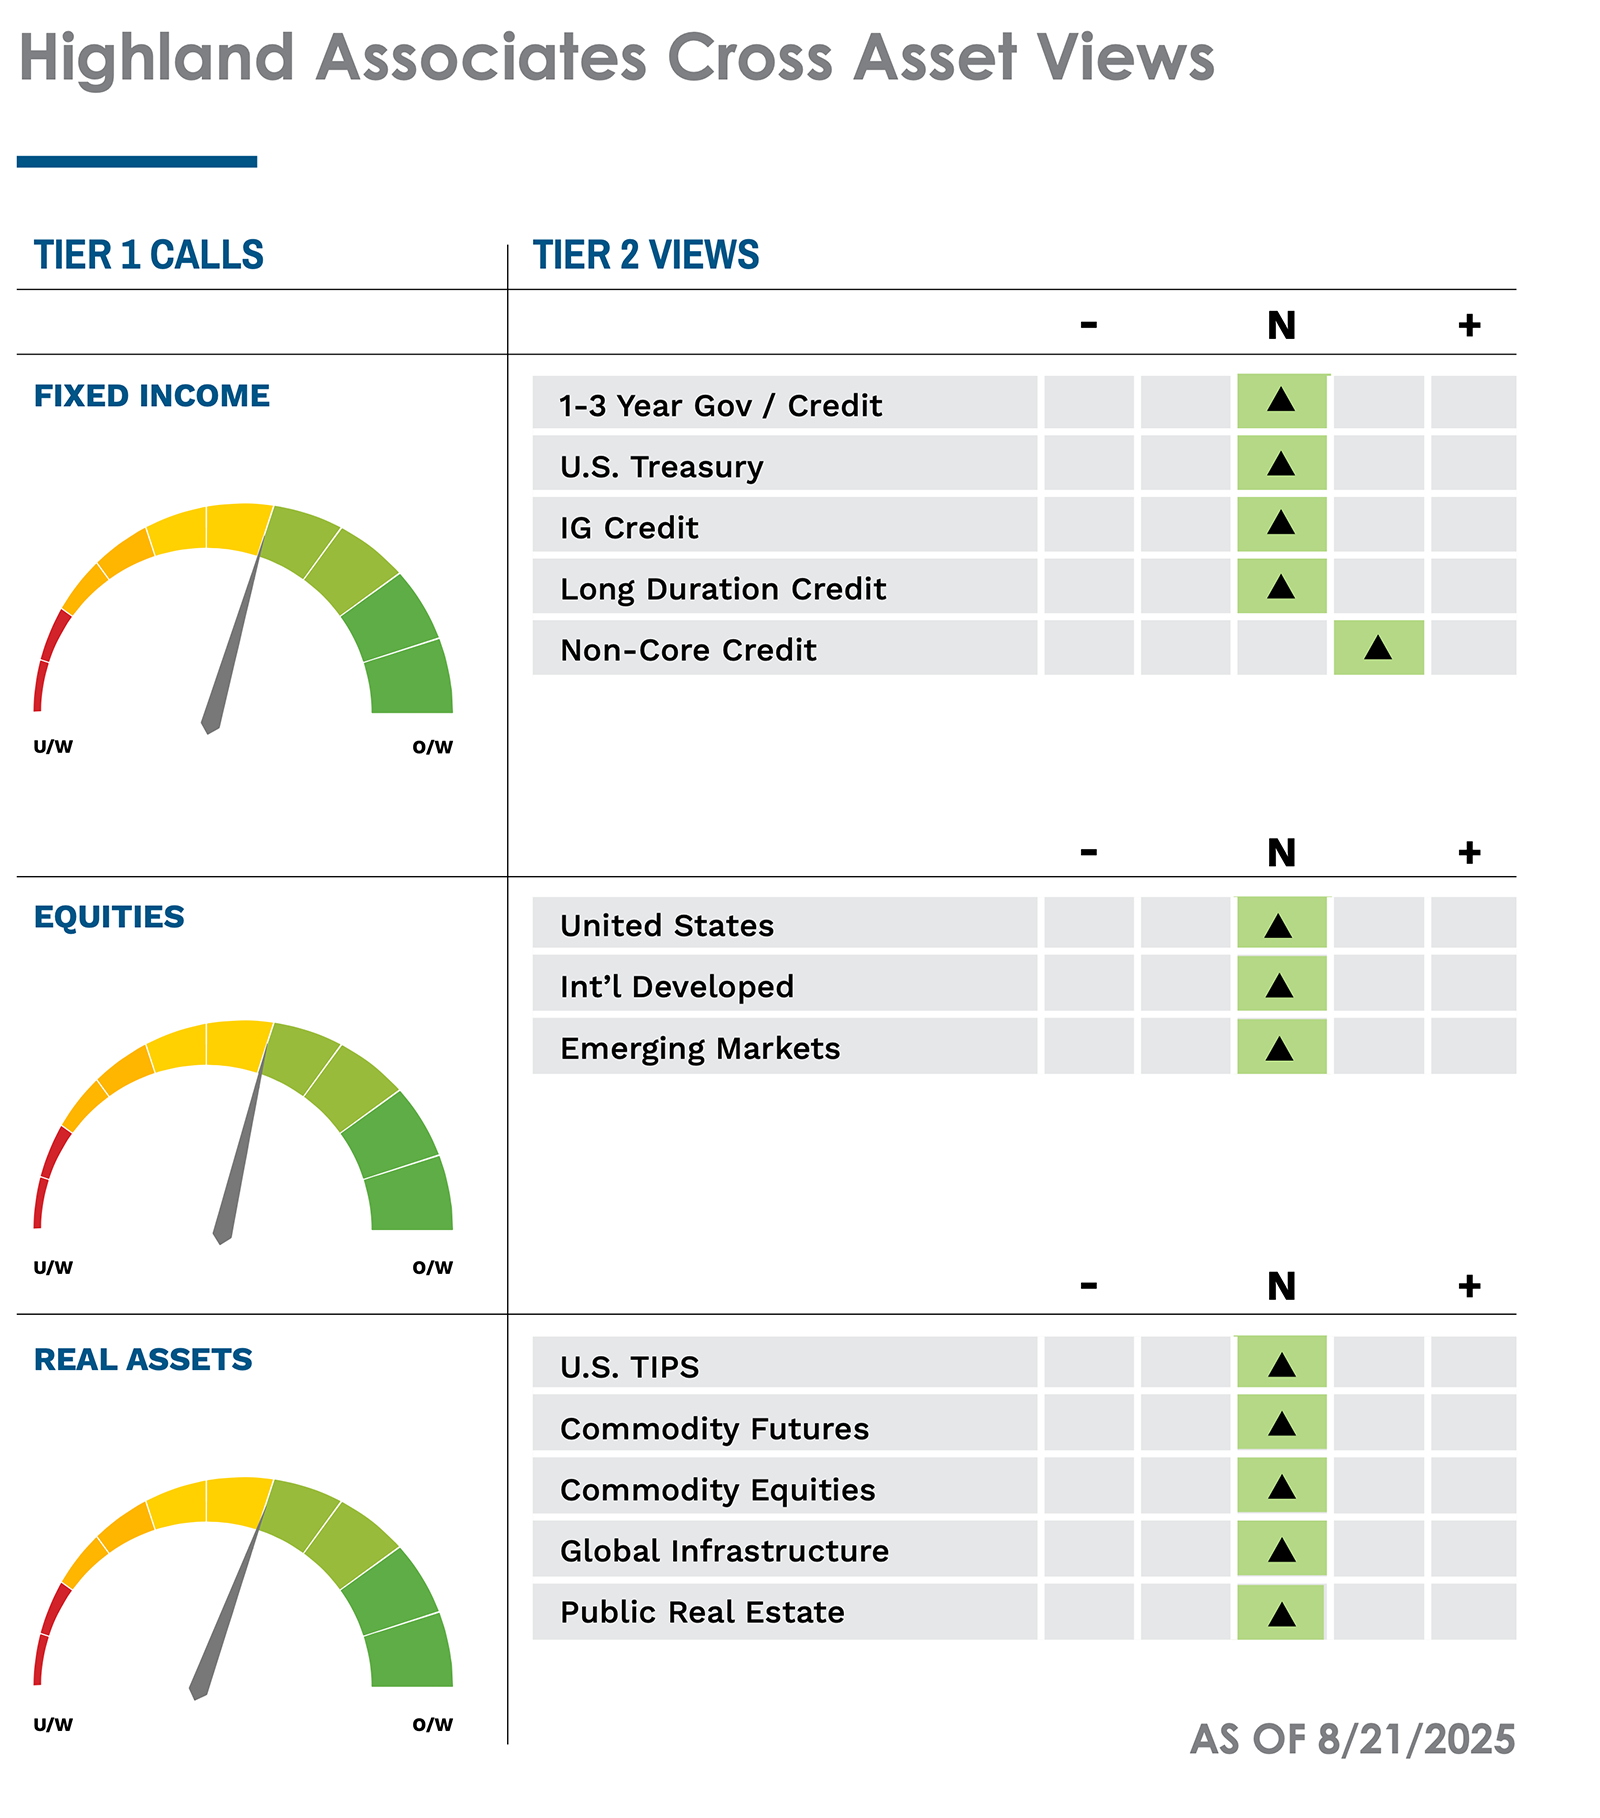
Highland is maintaining a neutral risk-positioning as equity markets push new all-time highs and spreads continue to grind tighter. The Highland Diffusion Index remains risk-on, with the Economic and Monetary Policy scores reflecting the only risk-off indicators. The unemployment rate has risen and is currently above the 12-month moving average, bringing the overall Employment score lower, but still risk-on. While capital continues to flow into equity strategies, investors increased their allocations to fixed income strategies during the month. Convertible strategies saw some of the largest inflows of the year while bank loans strategies have seen outflows. Lingering inflation concerns have also driven capital into Commodity strategies over the past two months after slowing during the summer months. Capital flows into European strategies have slowed after months of outperformance versus domestic equities, and outflows from Latin American countries have sharply increased.
Within our public inflation hedge sleeve we are leaning into the inflation-sensitive portfolio, specifically liquid real assets. Sectors such as Utilities and Materials are typically a smaller allocation in equity portfolios, and we believe these sectors can continue to outperform more value-focused sectors like Consumer Staples and Financials. The Real Estate sector has underperformed most other sectors besides healthcare, and we do not expect that trend to reverse any time soon. We are likely to move capital away from listed REITs in favor of infrastructure or natural resource equities. Commodities have been mixed throughout the year, although precious metals and livestock have been two exceptions. The increasing demand for electricity should continue to put upward pressure on commodities, but we are likely to see oil prices fall with the OPEC+ decision to increase production. The US administration has also looked into punishing countries like India for skirting sanctions and purchasing Russian oil, and follow-through on the rhetoric could offset any price action from production increases.
Our fixed income portfolios have been moving higher in quality as spreads tighten, and we favor investment grade corporates and Treasuries over non-core allocations like high yield and bank loans. Mortgage-backed securities have also become overweight within the portfolio as the consumer remains in a financially healthy position. The yield curve has continued to un-invert throughout the year, but we believe the fall in rates along the 1- to 5-year portion of the curve was due to investors front running the September rate cut. As mentioned earlier, we believe the move in the belly of the curve is likely overdone and yields will float upward through the remainder of the month. While we favor higher-quality fixed income, more esoteric sectors such as convertibles and preferreds, may provide some additional yield and diversification to traditional core bonds.
We anticipate some choppiness throughout the remainder of the year which reinforces our belief that a neutral risk-position is appropriate. While equity markets are pushing new highs, we believe that this is a result of investors’ front-running rate cuts and could face a trend reversal if there are less cuts than anticipated. Signs of deteriorating labor market conditions will be a major focus of the Fed going forward as it attempts to balance labor market stability and lingering inflation pressures.
IMPORTANT DISCLOSURES: This publication has been prepared by the staff of Highland Associates, Inc. for distribution to, among others, Highland Associates, Inc. clients. Highland Associates is registered with the United States Security and Exchange Commission under the Investment Advisors Act of 1940. Highland Associates is a wholly owned subsidiary of Regions Bank, which in turn is a wholly owned subsidiary of Regions Financial Corporation. Research services are provided through Multi-Asset Solutions, a department of the Regions Asset Management business group within Regions Bank. The information and material contained herein is provided solely for general information purposes only. To the extent these materials reference Regions Bank data, such materials are not intended to be reflective or indicative of, and should not be relied upon as, the results of operations, financial conditions or performance of Regions Bank. Unless otherwise specifically stated, any views, opinions, analyses, estimates and strategies, as the case may be (“views”), expressed in this content are those of the respective authors and speakers named in those pieces and may differ from those of Regions Bank and/or other Regions Bank employees and affiliates. Views and estimates constitute our judgment as of the date of these materials, are often based on current market conditions, and are subject to change without notice. Any examples used are generic, hypothetical and for illustration purposes only. Any prices/quotes/statistics included have been obtained from sources believed to be reliable, but Highland Associates, Inc. does not warrant their completeness or accuracy. This information in no way constitutes research and should not be treated as such. The views expressed herein should not be construed as individual investment advice for any particular person or entity and are not intended as recommendations of particular securities, financial instruments, strategies or banking services for a particular person or entity. The names and marks of other companies or their services or products may be the trademarks of their owners and are used only to identify such companies or their services or products and not to indicate endorsement, sponsorship, or ownership by Regions or Highland Associates. Employees of Highland Associates, Inc., may have positions in securities or their derivatives that may be mentioned in this report. Additionally, Highland’s clients and companies affiliated with Highland Associates may hold positions in the mentioned companies in their portfolios or strategies. This material does not constitute an offer or an invitation by or on behalf of Highland Associates to any person or entity to buy or sell any security or financial instrument or engage in any banking service. Nothing in these materials constitutes investment, legal, accounting or tax advice. Non-deposit products including investments, securities, mutual funds, insurance products, crypto assets and annuities: Are Not FDIC-Insured I Are Not a Deposit I May Go Down in Value I Are Not Bank Guaranteed I Are Not Insured by Any Federal Government Agency I Are Not a Condition of Any Banking Activity.
Neither Regions Bank nor Regions Asset Management (collectively, “Regions”) are registered municipal advisors nor provide advice to municipal entities or obligated persons with respect to municipal financial products or the issuance of municipal securities (including regarding the structure, timing, terms and similar matters concerning municipal financial products or municipal securities issuances) or engage in the solicitation of municipal entities or obligated persons for such services. With respect to this presentation and any other information, materials or communications provided by Regions, (a) Regions is not recommending an action to any municipal entity or obligated person, (b) Regions is not acting as an advisor to any municipal entity or obligated person and does not owe a fiduciary duty pursuant to Section 15B of the Securities Exchange Act of 1934 to any municipal entity or obligated person with respect to such presentation, information, materials or communications, (c) Regions is acting for its own interests, and (d) you should discuss this presentation and any such other information, materials or communications with any and all internal and external advisors and experts that you deem appropriate before acting on this presentation or any such other information, materials or communications.
Source: Bloomberg Index Services Limited. BLOOMBERG® is a trademark and service mark of Bloomberg Finance L.P. and its affiliates (collectively “Bloomberg”). BARCLAYS® is a trademark and service mark of Barclays Bank Plc (collectively with its affiliates, “Barclays”), used under license. Bloomberg or Bloomberg’s licensors, including Barclays, own all proprietary rights in the Bloomberg Barclays Indices. Neither Bloomberg nor Barclays approves or endorses this material or guarantees the accuracy or completeness of any information herein, or makes any warranty, express or implied, as to the results to be obtained therefrom and, to the maximum extent allowed by law, neither shall have any liability or responsibility for injury or damages arising in connection therewith.