
Download Asset Allocation | September 2024
Wake Me Up When September Ends
Economic Update
Yes, the Waiting Really Is the Hardest Part
By Regions Economic Division
Perhaps the biggest question analysts, market participants, and central bankers alike are trying to answer is whether economic activity is finally normalizing after the significant disruptions/distortions brought about by the pandemic and the policy response to it or whether something less benign is underway and will end in recession. While our view is that it is the former, not the latter, the reality is that it will take some time to know the answer. In the interim, however, it seems that each economic data release is being interpreted as though it provides a definitive answer, which, given the mixed signals being sent by the various data releases, is contributing to volatility in the equity and fixed income markets as well as rapidly shifting expectations around the path of monetary policy. This is something that may not change anytime soon.
The second estimate from the U.S. Bureau of Economic Analysis (BEA) puts Q2 real GDP growth at an annual rate of 3.0%, up from the initial estimate of 2.8%. Growth in real consumer spending on both goods and services was revised higher, putting Q2 growth at an annual rate of 2.9% compared to the initial estimate of 2.3% growth. This more than offset modest downward revisions in other components to push top-line real GDP growth higher. The BEA’s monthly data on personal income and spending, which directly enter the GDP data, show Q3 spending growth got off to a strong start. Real consumer spending grew by 0.4% in July, meaning that even if real spending were flat over the final two months of the quarter, real consumer spending would grow at an annual rate of 3.0% for Q3. We do not, however, expect that pace of growth to be sustained, and look for growth in consumer spending to slow sequentially over the final two quarters of 2024.
There are pockets of financial stress within the household sector, particularly among lower-to-middle-income households that have exhausted any savings buffers they were able to build up during the early phases of the pandemic, when sizable financial transfers to the household sector were a staple of pandemic relief efforts. Absent those savings buffers, many lower-to- middle-income households are having a harder time dealing with the cumulative effects of inflation over the past few years, with higher prices for necessities such as food, energy, and shelter leaving less and less room for discretionary spending. While households in the higher income buckets are still able to spend comfortably, there are nonetheless signs that spending on discretionary services has softened, which could be a sign that there is increasingly less pent-up demand for such services rather than a sign of financial stress working its way up the income distribution.
Income Growth, Spending Growth Realigning?
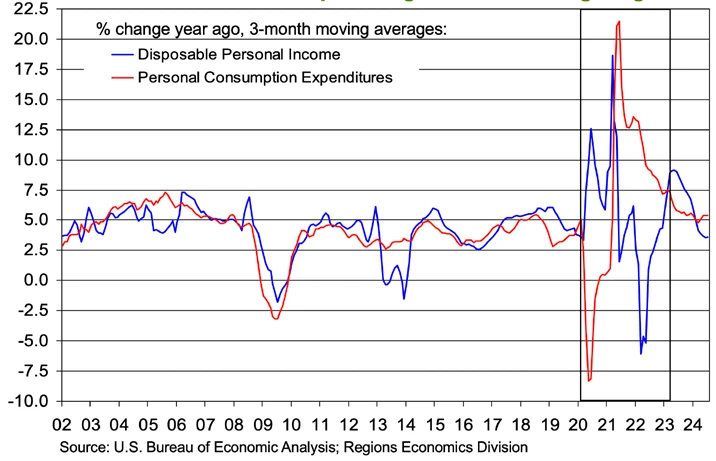
Either way, slowing growth in discretionary services spending would be consistent with the slowing pace of growth in total consumer spending our baseline forecast anticipates. As pandemic-related supports for income and spending fade, it follows that growth in consumer spending will become realigned with growth in after- tax income, rekindling what for many years prior to the pandemic had been a fairly stable relationship. Given that labor earnings are by far the largest component of personal income, this points to the importance of labor market conditions in the outlook for consumer spending. Unfortunately, the labor market data are sending decidedly mixed signals. While there is no doubt that the trend rate of job growth has slowed over the past several months, what is far from clear is whether job growth is settling into a slower but more sustainable pace or whether a more pronounced deterioration in labor market conditions is, well, in the works.
While total nonfarm employment rose by 142,000 jobs in August, prior estimates of job growth in June and July were revised down by a net 86,000 jobs for the two- month period. Moreover, the August employment report showed no signs of payback for a weak July print, which was something we expected to see given the apparent impacts of Hurricane Beryl in the July data. Average hourly earnings rose by 0.45%, while the average length of the workweek rose by one-tenth of an hour. Between the gain in employment, growth in average hourly earnings, and the longer workweek, aggregate private sector earnings rose by 0.8% in August, leaving them up 5.0% year-on-year, easily ahead of inflation. Hiring was more broadly based across the private sector in August, with the one-month hiring diffusion index rising to 53.4%. After having risen to 4.3% in July, the unemployment rate fell to 4.2% in August, largely reflecting a reversal of most of the sharp increase in the number of those reporting to have been on temporary layoff in July.
The August employment report did nothing to settle the question of whether what we are seeing is normalization or something less benign. That our preferred gauge of trend job growth, the running 12-month change in not seasonally adjusted nonfarm payrolls (a measure that gets around any issues related to seasonal adjustment), has fallen back in line with the average that prevailed over the five years prior to the pandemic settles nothing, as that trend rate will almost surely slip further in the months ahead. We do think it relevant to note once again that the slowing trend rate of job growth has thus far been a function of less hiring as opposed to rising layoffs. To that point, the not seasonally adjusted weekly data on claims for unemployment insurance benefits show initial claims below 200,000 in each of the past three weeks, a notably low number that leaves initial claims at their lowest level since last October. To be sure, diminished hiring will, given growth in the labor force, put upward pressure on the jobless rate, but any such increase will be far more moderate in the absence of rising layoffs. That said, the weekly data – not seasonally adjusted – on initial claims are what we at present consider to be the most reliable and the most important labor market indicators at our disposal.
Although it is too soon to know how much further the labor market will soften, it does seem clear that the focus of the Federal Open Market Committee (FOMC) has shifted away from inflation and toward the full employment side of its dual mandate. To that point, public comments by several FOMC members, including Chair Powell, have made it clear that the committee will cut the Fed funds rate at this month’s meeting, but whether the initial cut in the funds rate will be 25 or 50 basis points seems a much closer call than we and many others would have anticipated a few weeks ago. That call will likely come down to what the majority of FOMC members see as the rationale for cutting the funds rate. If it is believed the FOMC can, and should, cut the funds rate to make monetary policy less restrictive than it currently is, which the sharp deceleration in inflation allows for, that would favor a 25-basis-point cut, which would sit better with those members still concerned about inflation reaccelerating. If, however, more FOMC members are concerned that labor market conditions are, or could be, deteriorating to a point that threatens to trigger recession, that would favor a cut of 50 basis points.
Either way, the FOMC will release an updated set of economic and financial projections at this month’s meeting, including an updated dot plot. It could be that the committee opts for a smaller rate cut at this month’s meeting but makes it clear, in their post- meeting policy statement and in Chair Powell’s post- meeting press conference, that they will move more aggressively at subsequent meetings should conditions warrant such a move. The reality is that the FOMC is in the same boat as analysts and market participants, i.e., trying to discern whether the economy is normalizing back toward its pre-pandemic trend rate of growth or whether something less benign is playing out. There is, however, no quick or easy answer to this question, and until there is more clarity around the answer, the fv inancial markets are likely to remain highly volatile.
Sources: U.S. Bureau of Economic Analysis; U.S. Bureau of Labor Statistics
Investment Strategy Update
Stocks: A Leadership Shift into a Historically Tough Seasonal Stretch
Regions Multi-Asset Solutions & Highland Associates
August was a choppy, albeit profitable, month for investors in large-cap U.S. stocks. A sharp sell-off early in the month on the Japanese yen carry trade unwind was quickly followed by a sharp rebound mid-month, with the S&P 500 ultimately gaining 2.2%. The Magnificent 7 served as a source of funds during the month as investors reduced exposure to this year’s biggest winners and put capital to work in defensive (healthcare, consumer staples) and interest rate sensitive (financial services, real estate, utilities) sectors. While fears that labor market weakness could translate into weaker consumer spending, slower economic growth, and lower corporate profitability in the coming quarters were making the rounds, S&P 500 participation/breadth remained impressive with over 75% of index constituents trading above their 50- and 200-day moving averages at month-end.
Encouragingly, strong breadth readings put the market on firmer footing as we enter a historically weak seasonal stretch — from September into late October — for stocks in presidential election years. The S&P 500’s ability to recover quickly from the early-August doldrums and shrug off post- earnings weakness out of Mag 7 member Nvidia is a good sign. But with earnings season in the rearview mirror, and with a quarter-point rate cut in September priced in and potentially a “sell the news” event should the FOMC move more aggressively, upside catalysts for U.S. stocks are more difficult to identify and appear limited in the near-term.
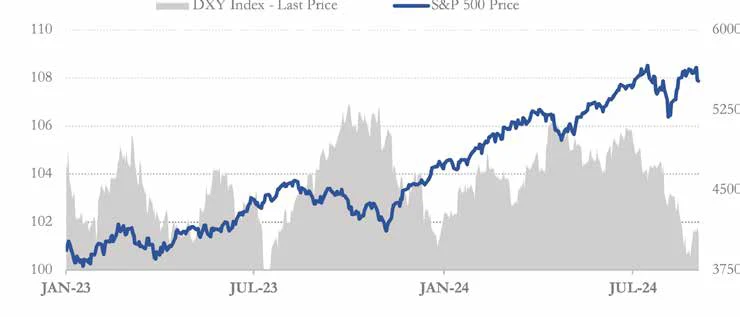
The U.S. Dollar Index (DXY) fell from $104 at the end of July to $101 at the end of August, taking its two-month loss to 4.2%. Demand for the greenback has waned amid fears of a U.S. economic slowdown and as expectations the FOMC would cut, perhaps aggressively, in mid-September have risen. U.S. dollar (USD) strength is a double-edged sword as it highlights demand for dollars and U.S. economic strength but has historically acted as a modest headwind for U.S. large-cap stocks, which derive approximately 40% of their revenue from overseas. The recent decline could boost S&P 500 revenue this quarter, but, given the velocity of the recent dollar decline and seasonal factors in play, a reversal of the downtrend or stabilization could materialize in the coming months. Seasonal trends over the last 20 years show the greenback typically gaining ground from August through October before weakening modestly in November through December. In presidential election years, those seasonal stats hold, as over the last four presidential cycles the dollar has moved lower in the fourth quarter by an average of 1.5%, likely a product of policy uncertainty that often proves less impactful than feared.
Should the U.S. dollar find its footing in the near-term, small- and mid-cap (SMid) stocks, which have lagged as fears of a U.S. economic slowdown have grown, could fare a bit better as a relative beneficiary of U.S. dollar strength. Where the dollar closes out the year is anyone’s best guess given elevated political and monetary policy uncertainty, but by maintaining a diversified portfolio across market cap and geographies, investors should be well positioned to ride out currency volatility and react accordingly should market dislocations arise.
U.S. Dollar Trading Near a 1-Year Low – Where Does It Go From Here?
Equity Markets Abroad Beneficiaries of the U.S. Dollar’s Slide
The U.S. dollar’s August slide provided a tailwind for equities outside of the U.S. in August, with developed markets benefiting the most. Country indices tied to Germany, Italy, Spain, and Switzerland all generated returns north of 4.5% on the month in U.S. dollar terms. Strong relative performance out of international developed markets could prove short-lived should the tailwind from a weaker U.S. dollar wane in the coming months, in keeping with historical patterns. Longer-term fundamental headwinds such as lackluster earnings growth along with regulatory and political uncertainty abroad remain, which prevents us from getting too constructive on international developed market stocks despite appealing valuations and dividend yields, leaving us neutral relative to our strategic benchmark.
Emerging market equities, on the other hand, have been building momentum in recent months. The fundamental outlook outside of China has improved as the U.S. dollar has weakened. Additionally, relatively attractive valuation metrics, including a one-year earnings growth estimate of 31.9% and a 12-month forward price-to-earnings (P/E) ratio of just 13, have garnered interest from relative value and growth investors alike. Although we’re receiving positive signals out of the broader EM asset class, dispersion at the country level leads us to favor a more active approach as even in August the best performing EM country, Brazil, posted a 5.5% gain, while the worst performer, Mexico, notched a 5.4% decline. The remaining pieces of the puzzle to make us more bullish on emerging market assets lie with better technical breadth and improved relative strength readings, which would be signs that investors are appreciating recent fundamental improvements in the space and are allocating capital accordingly.
Bonds: Risks Now Skewed to the Upside for Treasury Yields?
Bonds of all types have staged an impressive summer rally. Treasury yields across the curve moved sharply lower in recent months as the labor market cooled and market participants became increasingly convicted in their belief that a rate-cutting cycle would begin this month. At the start of September, the 10-year U.S. Treasury carried a yield of 3.91%, which compares to 4.51% at the end of May, 4.36% at the end of June, and 4.09% at the end of July. This three-month downtrend in yields has been quite profitable for investors in longer-duration Treasury bonds while also generating sizable gains for investment- grade corporates. Our view is that the U.S. economy is normalizing, not on the brink of collapsing, with growth expected to hover in a range of 1.5% to 2% over the next several quarters. With inflation gradually trending toward 2% and little in the way of progress on curbing government spending in the offing, near-term downside for yields on longer-term Treasuries is likely limited from here.
It stands out to us that even a more dovish than expected speech from FOMC Chair Jerome Powell in late-August failed to push the 10-year yield below the 3.75% to 3.80% range, and the 10-year yield has, so far, held the 3.70% level on the heels of a softer August employment report. This range provided resistance and a floor of support in July and December of 2023 as well with yields bouncing from that zone. A third retest and failure to break below implies to us that it could take some shockingly weak economic data releases in the coming months for this resistance level to give way and for the downtrend in yields to be sustained. As a result of this view, risks appear to be skewed to the upside for yields and downside for prices of U.S. Treasury bonds in the coming months. Maintaining an allocation to higher-quality long-duration Treasuries is still advisable for diversification purposes as these bonds provide a portfolio ballast and mitigate volatility, but it’s difficult to find value at present, and price appreciation is limited near-term.
Corporate Bonds Remain Appealing Despite Economic Slowdown Concerns
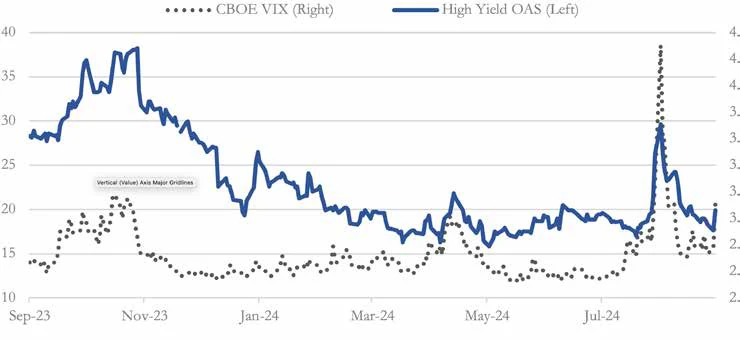
Investment-grade and high-yield corporate bonds outperformed the S&P 500 in August. Both segments have also fared well quarter-to-date, with the Bloomberg U.S. Corporate and U.S. Corporate High Yield indices rising 3.9% and 3.6%, respectively, versus the S&P 500’s also respectable 3.6% gain since the end of June. Credit spreads widened materially in early August, but with the growth scare short-lived, investors quickly found their way back into credit as widening credit spreads/ higher yields attracted fresh capital waiting patiently for a buying opportunity. If economic slowdown concerns persist, skittish investors looking for higher yields could increasingly favor higher-quality investment-grade issues relative to high-yield as we enter a historically tough seasonal stretch for riskier asset classes. With Treasuries appearing richly priced at month-end after a multi-month rally, we again see relative value residing with corporate bonds, although we are tempering our expectations for price improvement with credit spreads only 10 to 15 basis points above the tightest levels seen year-to-date.
High-Yield Bonds Holding Up Well Even as Volatility Rises
Source: Bloomberg
IMPORTANT DISCLOSURES: This publication has been prepared by the staff of Highland Associates, Inc. for distribution to, among others, Highland Associates, Inc. clients. Highland Associates is registered with the United States Security and Exchange Commission under the Investment Advisors Act of 1940. Highland Associates is a wholly owned subsidiary of Regions Bank, which in turn is a wholly owned subsidiary of Regions Financial Corporation. Research services are provided through Multi-Asset Solutions, a department of the Regions Asset Management business group within Regions Bank. The information and material contained herein is provided solely for general information purposes only. To the extent these materials reference Regions Bank data, such materials are not intended to be reflective or indicative of, and should not be relied upon as, the results of operations, financial conditions or performance of Regions Bank. Unless otherwise specifically stated, any views, opinions, analyses, estimates and strategies, as the case may be (“views”), expressed in this content are those of the respective authors and speakers named in those pieces and may differ from those of Regions Bank and/or other Regions Bank employees and affiliates. Views and estimates constitute our judgment as of the date of these materials, are often based on current market conditions, and are subject to change without notice. Any examples used are generic, hypothetical and for illustration purposes only. Any prices/quotes/statistics included have been obtained from sources believed to be reliable, but Highland Associates, Inc. does not warrant their completeness or accuracy. This information in no way constitutes research and should not be treated as such. The views expressed herein should not be construed as individual investment advice for any particular person or entity and are not intended as recommendations of particular securities, financial instruments, strategies or banking services for a particular person or entity. The names and marks of other companies or their services or products may be the trademarks of their owners and are used only to identify such companies or their services or products and not to indicate endorsement, sponsorship, or ownership by Regions or Highland Associates. Employees of Highland Associates, Inc., may have positions in securities or their derivatives that may be mentioned in this report. Additionally, Highland’s clients and companies affiliated with Highland Associates may hold positions in the mentioned companies in their portfolios or strategies. This material does not constitute an offer or an invitation by or on behalf of Highland Associates to any person or entity to buy or sell any security or financial instrument or engage in any banking service. Nothing in these materials constitutes investment, legal, accounting or tax advice. Non-deposit products including investments, securities, mutual funds, insurance products, crypto assets and annuities: Are Not FDIC-Insured I Are Not a Deposit I May Go Down in Value I Are Not Bank Guaranteed I Are Not Insured by Any Federal Government Agency I Are Not a Condition of Any Banking Activity.
Neither Regions Bank nor Regions Asset Management (collectively, “Regions”) are registered municipal advisors nor provide advice to municipal entities or obligated persons with respect to municipal financial products or the issuance of municipal securities (including regarding the structure, timing, terms and similar matters concerning municipal financial products or municipal securities issuances) or engage in the solicitation of municipal entities or obligated persons for such services. With respect to this presentation and any other information, materials or communications provided by Regions, (a) Regions is not recommending an action to any municipal entity or obligated person, (b) Regions is not acting as an advisor to any municipal entity or obligated person and does not owe a fiduciary duty pursuant to Section 15B of the Securities Exchange Act of 1934 to any municipal entity or obligated person with respect to such presentation, information, materials or communications, (c) Regions is acting for its own interests, and (d) you should discuss this presentation and any such other information, materials or communications with any and all internal and external advisors and experts that you deem appropriate before acting on this presentation or any such other information, materials or communications.
Source: Bloomberg Index Services Limited. BLOOMBERG® is a trademark and service mark of Bloomberg Finance L.P. and its affiliates (collectively “Bloomberg”). BARCLAYS® is a trademark and service mark of Barclays Bank Plc (collectively with its affiliates, “Barclays”), used under license. Bloomberg or Bloomberg’s licensors, including Barclays, own all proprietary rights in the Bloomberg Barclays Indices. Neither Bloomberg nor Barclays approves or endorses this material or guarantees the accuracy or completeness of any information herein, or makes any warranty, express or implied, as to the results to be obtained therefrom and, to the maximum extent allowed by law, neither shall have any liability or responsibility for injury or damages arising in connection therewith.