
Download Asset Allocation | September 2023
Dirty Work
Economic Update
Your Guess Is as Good as Ours…
By Regions Economic Division
The U.S. economy is a) shifting into a faster rate of growth; b) gently easing into a soft landing; or c) on the road to recession. You pick, and whichever scenario you believe, or want, to be the case, we’ve got the data to prove it. The only problem, of course, is that no data point ever actually proves anything, even when the reliability of the economic data is not in question. At present, not only is the economic data all over the map, but we also find ourselves with more questions about the reliability of the data than we can recall ever having.
The second estimate from the U.S. Bureau of Economic Analysis (BEA) puts Q2 real GDP growth at 2.1%, down from the initial estimate of 2.4% due to downward revisions to inventory accumulation and business investment, but nonetheless marking a fourth straight quarter of above-trend growth. That streak will last for at least one more quarter, as a surprisingly strong July puts a high floor under Q3 growth in real consumer spending, which in turn could push Q3 real GDP growth above 3%. We do, however, expect growth in real consumer spending to slow sharply by the end of Q3, setting up a virtually flat trajectory for Q4 spending and, in turn, Q4 real GDP. We will note that on September 28 the BEA will release the initial results of the comprehensive revisions to data on GDP, personal income, and corporate profits, among other series. How the economy looks, or how we think it looks, could thus be different at the end of the month than it is today.
Along with the revised Q2 GDP data, the BEA also released their first estimate of Q2 corporate profits, much broader than the S&P 500 measure of profits. Before-tax profits fell by 0.4% in Q2 while after-tax profits rose by 1.6%, yielding over-the-year declines of 6.5% and 6.2%, respectively. While many heralded the sequential increase in after-tax profits as proof of an improving earnings outlook, we pointed to a quirk in the data over recent years in which corporate tax payments are reported to decline significantly in the second quarter, thus flattering after-tax profits. Whether this quirk will remain in the revised data remains to be seen, but either way, we expect further pressure on corporate profit margins in the quarters ahead with further deceleration in revenue growth and little relief on the cost front unless firms begin making cuts in total labor expenses and/or capital spending.
Total nonfarm employment rose by 187,000 jobs in August, with job growth more broadly based across the private sector, an uptick in average weekly hours, and moderation in the pace of wage growth. At the same time, the unemployment rate rose to 3.8% from 3.5% in July due to a spike in labor force participation. Moreover, the most recent data from the Job Openings and Labor Turnover Survey (JOLTS) show a significant decline in the number of open jobs. Taken as a whole, the labor market data suggest an economy easing into a soft landing, and many pointed to slowing wage growth and the higher unemployment rate as taking further Fed funds rate hikes off the table. That narrative survives if one goes no further than the headline numbers, but the deeper one goes into the details of the data, the more suspect each of these observations becomes.
August job growth would have been even faster were it not for three factors: 1) the SAG-AFTRA strike took almost 17,000 jobs off payrolls in information services (striking workers are not counted as employed in the establishment survey data); 2) Yellow Corp.’s bankruptcy resulted in the loss of roughly 30,000 jobs in the truck transportation industry group; and 3) seasonal adjustment noise resulted in the seasonally adjusted data showing a decline in employment among education workers in state and local governments at a time the school year was starting up. In that sense, it may seem that measured August job growth is significantly understated.
Here’s where things get messy—well, more messy. First, prior estimates of job growth in June and July were revised down by a net 110,000 jobs for the two-month period, a notably large revision. With the initial estimate of July job growth having been revised down, that means that in each of the first seven months of this year the initial estimate of job growth has subsequently been revised lower. Second, the response rate to the August establishment survey was only 59.3%, the second lowest response rate since the onset of the pandemic. This means that the initial estimates of August employment, hours, and earnings are all suspect and subject to revision, perhaps sizable, over coming months.
As to the unemployment rate rising for the “right” reason—i.e., higher labor force participation—higher participation among the 16-to-24-year-old age cohort accounted for nearly one-half of the total increase in the labor force in August. This is nothing more than seasonal adjustment noise, as the not seasonally adjusted data show the number of people in this age cohort in the labor force declined by 863,000 in August. This noise added two-tenths of a point to the unemployment rate, casting doubt on just how much labor market conditions eased in August.
The substantial decline in job openings shown in the July JOLTS data is even more suspicious. The response rate to the survey used to produce the JOLTS data has hovered around 30% for most of the post-pandemic period. This, along with a very small sample size, contributes to a notably high degree of month-to-month volatility and makes the initial estimates of the metrics in the JOLTS data prone to sizable revision. To that point, the initial estimate of job openings in June was, a month later, revised down by over 400,000, a ridiculously large revision from a base of roughly 9.5 million openings. We do have more confidence in the trends shown in the JOLTS data, including job openings trending lower and the quits rate falling back in line with pre-pandemic norms, both of which suggest a cooling labor market.
While Federal Open Market Committee (FOMC) members may conclude that, beneath all the noise in the data, the labor market has cooled enough to warrant holding the Fed funds rate steady at this month’s meeting, the August inflation data, out a week before the meeting, will make the discussion a bit more uncomfortable. With a spike in retail gasoline prices and higher food prices, August headline inflation will likely approach 4.0% significantly faster than in the prior two months. So, while a funds rate hike may not be in the offing at this month’s meeting, the committee could use their updated economic and financial projections, including an updated “dot plot,” to send a hawkish message that would rattle the markets.
In addition to noisy and often contradictory data, there are two potential wild cards that could make it even more difficult to get an accurate read on where the economy is, let alone where it is going. First, a potential strike by the United Auto Workers, whose current contracts expire September 14, could shut down production among the “Big 3” at a time when production and inventories are finally normalizing after being badly impaired by supply chain snarls. Second, it is possible, if not likely, that October 1 will bring at least a partial shutdown of the federal government due to Congress remaining at an impasse on funding the government. All of which adds up to continued volatility in the financial markets.
Sources: U.S. Bureau of Economic Analysis; U.S. Bureau of Labor Statistics
Investment Strategy Update
August lived up to its billing as a challenging month for equity investors as the S&P 500 fell 2% and the MSCI ACWI ex. U.S. Index lost 4%. But upward price momentum did return at month-end and pushed the S&P 500 back above its 50-day moving average, an important technical level. As a result of this surge, optimism is building that September may be more kind to equity investors than it has historically been. While that ultimately may be the case, the weak seasonal backdrop still presents a hurdle for equities to gain ground during the month. With few identifiable catalysts to push stocks higher leading up to the FOMC’s September 19-20 meeting, stocks will likely take their cue from U.S. Treasury yields and the U.S. dollar. Stocks responded positively to falling Treasury yields in late August, but the U.S. dollar could be a bigger driver of equity prices in September. A breakout to the upside for the U.S. Dollar Index, or DXY, could be viewed as a risk-off signal and sign that investor sentiment is waning.
Within Fixed Income, U.S. Treasury yields ended August little changed, but interest rate volatility was again elevated during the month, a backdrop that contributed to a general sense of unease on the part of fixed income investors. The 2-year Treasury yield ended the month down 3 basis points at 4.85%, but the 2-year yield traded up to 5.05% mid-month before retreating, a level last seen in June of 2007. The 10-year yield rose 12 basis points on the month to close at 4.09%, masking intra-month volatility as the 10-year yield closed at 4.34% mid-month, re-testing its intra-day highs from October 2022. Treasury yields could remain range-bound into the FOMC’s September 19-20 meeting, with the 2-year yield likely stuck in the 4.75% to 5.05% zone and the 10-year yield mired in a new trading range between 4.05% and 4.35%.
With the FOMC expected to skip a rate hike in September on the heels of the August employment report, yields could move back toward the top end of recent trading ranges as investors require higher yields to compensate for the prospect of inflation reaccelerating into year-end due to higher energy prices, just as the FOMC may be moving to the sidelines. Increased Treasury supply/issuance could also put additional upward pressure on Treasury yields, particularly with a buyers’ strike taking place abroad as both the Bank of Japan and People’s Bank of China have been selling Treasury holdings to support domestic interests. The Bank of Japan may remain an active seller of U.S. Treasuries over coming months as it appears focused on preventing the Japanese yen from weakening materially. A duration profile in line with that of the Bloomberg Aggregate Bond Index (Agg) remains warranted as the near-term risk is skewed to the upside for yields, and with a 5% yield-to-worst on the Agg, investors are being paid to wait for clarity on the path forward for the U.S. economy and interest rates.
High yield bonds weren’t immune to volatility in August, but it’s hard to tell with the credit spread on the Bloomberg High Yield Index ending the month just one basis point wider. The 7% return of the Bloomberg High Yield Index year-to-date through August has been impressive. The increase in yields year-to-date, while painful, bodes well for future returns. However, as we noted in recent months, valuations are an important consideration when investing in high yield bonds, and at present the sector appears fair. Against this backdrop, we continue to hold a Neutral risk position in portfolios.
Private Real Estate Update
A Challenging Year with Uncertainty Remaining
Regions Multi-Asset Solutions
Private real estate has been one of the major topics of conversation this year as the space has encountered a repricing over the last 8 to 12 months. An increase in interest rates over the last 18 months has led to an increase in cap rates and discount rates, which ultimately results in the decrease of property values assuming all things equal. While rent growth has helped partially offset the decline, even this is starting to wane. The NCREIF ODCE Index, a capitalization weighted index of open-end private real estate funds, is down 10.7% over the past year. The lack of private real estate transactions presents a challenge, giving the appraiser few comparable to use when valuing portfolios. Investors likely need to see increased transaction volume for true price discovery in this current environment.
The asset that most investors are asking question about today is Office. The fundamentals in Office had unfavorable characteristics prior to Covid, which weakened further as working from home became more acceptable. With
demand for many office properties remaining unfavorable, the ability to refinance or maintain high occupancy is a major threat. Industrial and multifamily properties have been a bright spot in this current environment, as the growth in e-commerce and general undersupply of housing have been a tailwind. Our team is watching development trends in both asset types, as oversupply could put pressure on prices at a time when demand is slowing.
Unfortunately for investors looking to rebalance and take advantage of recent volatility across the capital markets, the level of redemption queues has risen. The queue mechanism serves to protect long-term investors from forced selling of desirable assets but limits investor flexibility during times like these. We expect redemption queues to remain elevated over the next several quarters.
While we expect further challenges for the asset class in the coming quarters as the outlook for both interest rates and the U.S. economy remain murky, real estate continues to be one of our favorite long-term investments. It exhibits low correlation to traditional stocks and bonds, provides an attractive income return, and serves as an effective hedge against high inflation, a risk that is not going away. Like past periods, investors will be rewarded for remaining patient and seeking opportunities when a more favorable environment presents itself.
Public Policy Update
Who’s the Boss?
Regions Government Affairs, Highland Associates
Congress needs to reach an agreement on government funding to avoid a shutdown at the end of September, but halfway through the month the two sides remain far apart on an overall spending measure and uncertain on the best procedural path forward. The next two weeks will likely be spent deciding on the contours of a stopgap measure known as a Continuing Resolution (“CR”), which would fund the government at current levels for a period of time (perhaps 30-60 days), or risk shutting down the government until an agreement can be reached.
All indications are that the Senate (which has already passed their version of new appropriations bills) is working in bipartisan fashion to craft a CR through November or December, but one that will include $40+ billion in additional funding to support Ukraine and domestic natural disaster relief.
The House, however, is a different story and the situation remains incredibly fluid. Speaker Kevin McCarthy (R-CA) must balance calls from moderates in his party to advance a CR (which he can likely only pass with the help of some Democrats) and demands from a small ultra-conservative group known as the House Freedom Caucus (also Republicans) who have stated they will not agree to a “clean” CR and are stridently against adding funds to support Ukraine. Members of the Freedom Caucus – although not fully aligned on their priorities – are instead seeking to include in any spending measure a series of policy riders focused on reduced government spending levels, enhanced security of the southern border, combatting social policy agendas within the Pentagon, and potentially seeking impeachment proceedings against President Biden.
Thus far this Congress, McCarthy has been extremely effective at managing his disparate caucus and advancing negotiations across the aisle and with the White House. He will need to show his deft leadership touch in order to avoid a major funding calamity while adding just enough policy riders to mollify conservatives. But there are potential consequences as well, as some in the Freedom Caucus have stated publicly, they may attempt to oust McCarthy from his role as Speaker should he negotiate a funding deal that ignores the far right.
The bottom line is this: there are two weeks left for to agree to a short-term CR to buy more negotiating time (perhaps into November, when we will have to do this all over again) or risk shutting the government down. While some optimism remains, odds of a shutdown have risen and at this point it is 50/50. Shutting down the government is not an altogether rare outcome for spending negotiations, however, as there have been 20 shutdowns since the 1970s, the last of which was in 2018 and lasted 35 days.
Highland Associates Cross Asset Views
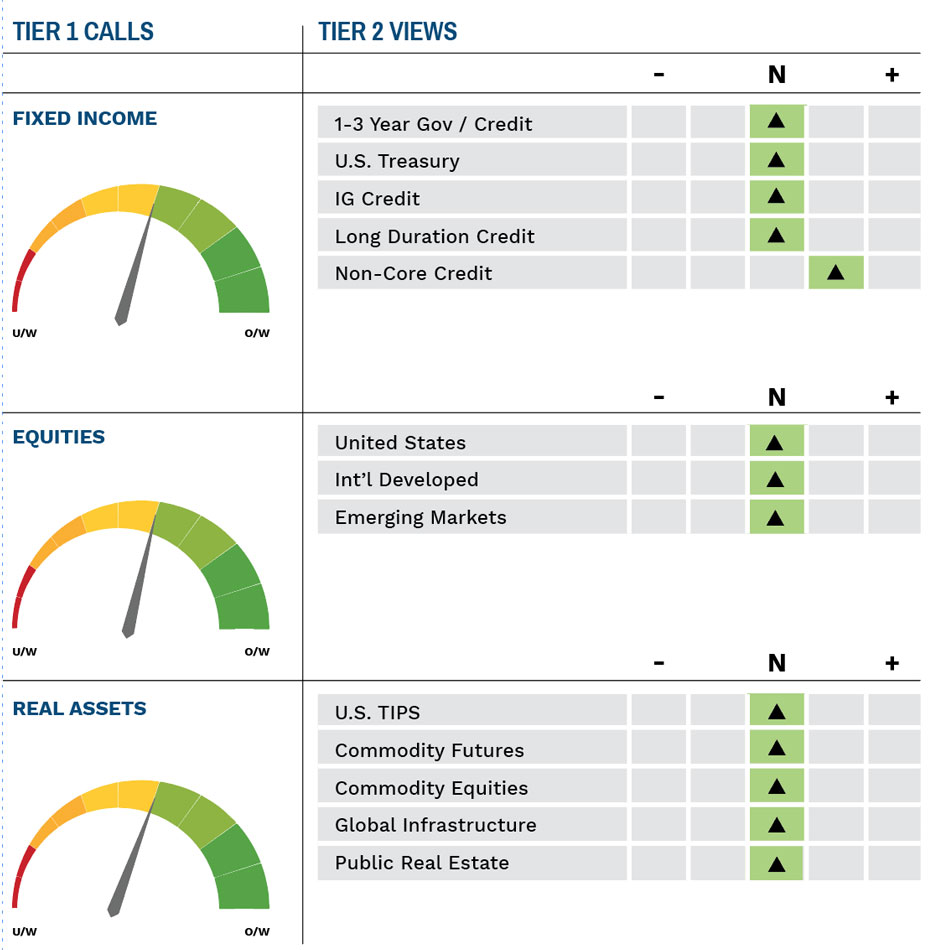
As of 9/11/2023
IMPORTANT DISCLOSURES: This publication has been prepared by the staff of Highland Associates, Inc. for distribution to, among others, Highland Associates, Inc. clients. Highland Associates is registered with the United States Security and Exchange Commission under the Investment Advisors Act of 1940. Highland Associates is a wholly owned subsidiary of Regions Bank, which in turn is a wholly owned subsidiary of Regions Financial Corporation. Research services are provided through Multi-Asset Solutions, a department of the Regions Asset Management business group within Regions Bank. The information and material contained herein is provided solely for general information purposes only. To the extent these materials reference Regions Bank data, such materials are not intended to be reflective or indicative of, and should not be relied upon as, the results of operations, financial conditions or performance of Regions Bank. Unless otherwise specifically stated, any views, opinions, analyses, estimates and strategies, as the case may be (“views”), expressed in this content are those of the respective authors and speakers named in those pieces and may differ from those of Regions Bank and/or other Regions Bank employees and affiliates. Views and estimates constitute our judgment as of the date of these materials, are often based on current market conditions, and are subject to change without notice. Any examples used are generic, hypothetical and for illustration purposes only. Any prices/quotes/statistics included have been obtained from sources believed to be reliable, but Highland Associates, Inc. does not warrant their completeness or accuracy. This information in no way constitutes research and should not be treated as such. The views expressed herein should not be construed as individual investment advice for any particular person or entity and are not intended as recommendations of particular securities, financial instruments, strategies or banking services for a particular person or entity. The names and marks of other companies or their services or products may be the trademarks of their owners and are used only to identify such companies or their services or products and not to indicate endorsement, sponsorship, or ownership by Regions or Highland Associates. Employees of Highland Associates, Inc., may have positions in securities or their derivatives that may be mentioned in this report. Additionally, Highland’s clients and companies affiliated with Highland Associates may hold positions in the mentioned companies in their portfolios or strategies. This material does not constitute an offer or an invitation by or on behalf of Highland Associates to any person or entity to buy or sell any security or financial instrument or engage in any banking service. Nothing in these materials constitutes investment, legal, accounting or tax advice. Non-deposit products including investments, securities, mutual funds, insurance products, crypto assets and annuities: Are Not FDIC-Insured I Are Not a Deposit I May Go Down in Value I Are Not Bank Guaranteed I Are Not Insured by Any Federal Government Agency I Are Not a Condition of Any Banking Activity.
Neither Regions Bank nor Regions Asset Management (collectively, “Regions”) are registered municipal advisors nor provide advice to municipal entities or obligated persons with respect to municipal financial products or the issuance of municipal securities (including regarding the structure, timing, terms and similar matters concerning municipal financial products or municipal securities issuances) or engage in the solicitation of municipal entities or obligated persons for such services. With respect to this presentation and any other information, materials or communications provided by Regions, (a) Regions is not recommending an action to any municipal entity or obligated person, (b) Regions is not acting as an advisor to any municipal entity or obligated person and does not owe a fiduciary duty pursuant to Section 15B of the Securities Exchange Act of 1934 to any municipal entity or obligated person with respect to such presentation, information, materials or communications, (c) Regions is acting for its own interests, and (d) you should discuss this presentation and any such other information, materials or communications with any and all internal and external advisors and experts that you deem appropriate before acting on this presentation or any such other information, materials or communications.
Source: Bloomberg Index Services Limited. BLOOMBERG® is a trademark and service mark of Bloomberg Finance L.P. and its affiliates (collectively “Bloomberg”). BARCLAYS® is a trademark and service mark of Barclays Bank Plc (collectively with its affiliates, “Barclays”), used under license. Bloomberg or Bloomberg’s licensors, including Barclays, own all proprietary rights in the Bloomberg Barclays Indices. Neither Bloomberg nor Barclays approves or endorses this material or guarantees the accuracy or completeness of any information herein, or makes any warranty, express or implied, as to the results to be obtained therefrom and, to the maximum extent allowed by law, neither shall have any liability or responsibility for injury or damages arising in connection therewith.