
Download Asset Allocation | September 2022
The Adults Are Talking
Economic Update
The “Things Are Not Always As They Seem” Economy
By Regions Economic Division
“Things are not always as they seem; the first appearance deceives many.” OK, so maybe Phaedrus wasn’t ruminating on the nature of economic data, but it fits, nonetheless. Even in the most normal of times, the economic data can send often conflicting and confusing signals on the state of the economy. Since the onset of the pandemic, however, the signals being sent by the economic data have been even harder to decipher. The disruptions stemming from the economy coming to a sudden stop and the distortions caused by what in the U.S. was an extraordinarily aggressive policy response have yet to be fully unwound. One implication is that what for decades were normal seasonal patterns in a wide swath of economic activity have been cast into disarray, such that the headline numbers on a given data release are now often at odds with the underlying details. Clearly, the U.S. economy has slowed under the weight of elevated inflation and rising interest rates. What is far less clear, however, is the extent to which the economy has truly slowed and the likelihood that this slowdown will progress into recession.
The second estimate from the Bureau of Economic Analysis (BEA) showed real GDP contracted at an annual rate of 0.6% in Q2, compared to the initial estimate of a 0.9% contraction. While some have taken the contractions in real GDP in each of the first two quarters of 2022 as “proof” that the economy is in recession, we’ve been on record with our view that the GDP data have said more about the quirks of GDP accounting than the underlying health of the U.S. economy. For instance, because they grew at a slower pace in Q2 than was the case in Q1, business inventories knocked 1.83 percentage points off the quarterly change in real GDP in Q2. Moreover, the readings on real GDP are at odds with the readings on real Gross Domestic Income (GDI). Real GDI expanded at annual rates of 1.8% in Q1 and 1.4% in Q2, not great by any stretch, but neither is this a sign of a contracting economy.
In theory, GDP and GDI are measuring the same thing, simply from different vantage points; GDP is an expenditures-based measure of all final goods and services produced in a given period, while GDI measures the income generated in the production of those final goods and services. When the two measures have diverged in the initial estimates, revised data have tended to lean toward where the initial estimate of GDI was, and we won’t be surprised if that is the case this time around. Our premise will be put to the test on September 29, when the BEA releases their annual comprehensive revisions to the recent historical GDP data.
Even if the revised data show real GDP tracking real GDI more closely over 1H 2022 than has thus far been reported, that will still leave a decided disconnect between the GDP data and the employment data. Total nonfarm payrolls increased by 2.663 million jobs over the first half of 2022 as real GDP is reported to have been contracting, but the disconnect is even more pronounced than has appeared. The Bureau of Labor Statistics (BLS) released the preliminary results of its annual benchmark revisions to the data from its monthly establishment survey, the basis of the BLS’s estimates of nonfarm employment. Each year, the establishment survey data are benchmarked to comprehensive counts of employment based on payroll tax returns, which all employers must file, as of the month of March. Based on the preliminary 2022 results, the level of nonfarm employment as of March 2022 will be revised up by 462,300 jobs, equivalent to 0.3% of total nonfarm employment and much larger than the average revision (0.1%) over the past 10 years.
The upward revision is not a surprise. Given how the dynamics of the labor market have shifted since the onset of the pandemic, particularly the meaningfully higher degree of turnover, we’ve suspected the errors associated with the initial estimates of job growth have been larger over recent quarters. Still, while the direction of the revision to nonfarm employment isn’t surprising, the magnitude of the revision is, with one implication being an even larger disparity between the GDP data and the employment data. While the pending revisions to the GDP data may narrow that disparity, they won’t eliminate it.
As the GDP data now stand, nonfarm labor productivity is reported to have declined at annual rates of 7.4% in Q1 and 4.1% in Q2. With the revised employment data yielding a meaningful upward revision to the estimate of aggregate hours worked, the declines in productivity over 1H 2022 figure to be even larger than first reported, which is hard to fathom. Unless of course you believe that firms were taking on workers at a breakneck pace in order to have them sit idle all day every day. Or it could be that “quiet quitting” is really a thing and the only people who haven’t caught on to it are the bosses who don’t know their subordinates aren’t really working.
Looming revisions to key data have the potential to reshape perceptions of the economy’s path over 1H 2022. Then again, it may be that the revised data offer no more clarity than did the initial estimates, particularly since the more recent data have been just as muddled. For instance, a “surge” in labor force participation pushed the unemployment rate up to 3.7% in August from 3.5% in July despite a sizable increase in employment. A substantial portion of August’s increase in the labor force, however, is no more than seasonal adjustment noise, leaving a much smaller actual increase in the labor force. This is no trivial matter, given the extent to which depressed labor force participation remains a drag on job growth and an accelerant to wage growth. While the ISM Manufacturing Index held steady at 52.8% in August, the survey details show more industry groups reported declines in new orders and production than reported increases, the takeaway being that the expansion in the factory sector is slower and less broadly based than had been the case. Finally, while lower gasoline prices have led to significantly smaller monthly changes in the Consumer Price Index, the over-the-year change remains above 8.0%.
The FOMC raised the Fed funds rate target range by 75 basis points at their September meeting, a move widely expected in the wake of the August CPI data showing an acceleration in core inflation. The updated economic projections show real GDP running well below “potential” through 2023, with more persistent inflation than anticipated in the June projections along with a higher unemployment rate. The updated dot plot implies a more aggressive path of Fed funds rate hikes than that implied in the June edition, with the midpoint of the funds rate target range topping out at 4.625% in 2023. Clearly, the FOMC was late to the game in responding to elevated inflation, and just as clearly, they seem intent on making up for lost time. What is far less clear, particularly in light of them now expecting inflation to be higher and more persistent than only a few months ago, is how far the FOMC will ultimately go and what the effects will be on the labor market and the broader economy.
In his post-meeting press conference, Chairman Powell stressed that the FOMC is “strongly resolved” to bring inflation back down to 2.0% and will “keep at it” until that goal is attained. Chairman Powell noted that there is “no painless way” to get inflation down, and again stressed that the costs of prematurely loosening policy would be worse than the costs of the FOMC remaining on its present path. Not exactly inspiring, and more than a bit late, but at this point the right message to send.
Sources: Bureau of Economic Analysis; Bureau of Labor Statistics; Institute for Supply Management
Investment Strategy Update
Global equities’ summer rally reversed in the second half of August as Federal Reserve Chair Jerome Powell reaffirmed the committee’s restrictive policy stance and commitment to bringing the inflation rate down. The U.S. Treasury Yield curve remains inverted at 1/5s, 2/10s, and 5/10s portions of the curve. The inverted yield curve has proven in the past to be a reliable indicator of a recession. We also continue to see further deterioration in our economic indicators, such as new orders and consumer expectations.
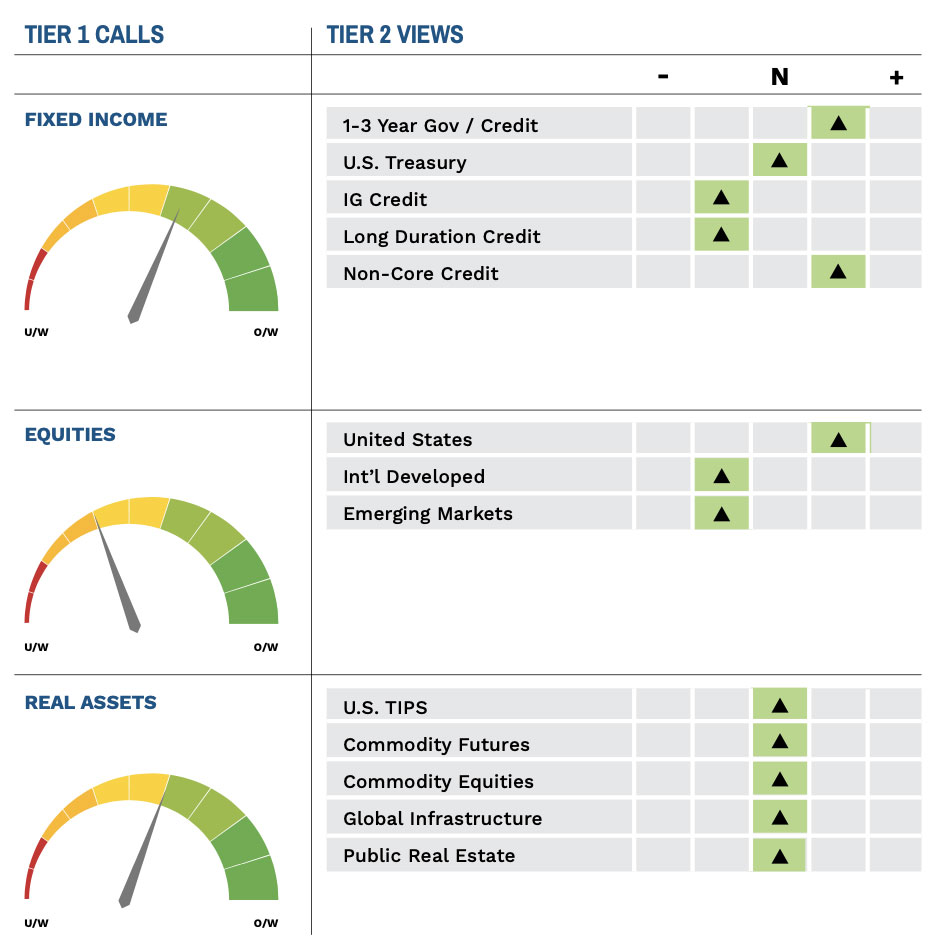
Against this backdrop, the Highland Diffusion Index is now signaling Risk Off. We initiated an underweight position to equities in favor of short-duration bonds and hedged equity strategies. Both tactical trades position portfolios defensively in protection against more equity volatility and rising interest rates. With yields on shorter term bonds in line or higher than core, a parallel shift up in the yield curve has less downside and takes less time to recover any losses. We also continue to maintain an overweight to U.S. equities and alternative, non-directional fixed income strategies, both of which have been accretive to portfolios year-to-date.
The Highland Diffusion Index Framework
Our Highland Diffusion Index (HDI) framework is central to how we manage risk in client portfolios. The framework tracks 27 data points across six primary areas: economic, employment, monetary policy, credit spreads, yield curve, and market momentum. It helps to cut through market noise and assess the likelihood markets are in a risk-on, neutral, or risk-off environment. The framework helped us successfully navigate periods like the Global Financial Crisis in 2008–2009 and the Dot-com Bubble in the early 2000s.
Importantly, the framework is not a financial model we follow blindly. We always ask ourselves what is not being picked up in the data and what is different this time. This helped us navigate the 2020 COVID market sell-off as monetary and fiscal stimulus measures were being implemented by the time our HDI indicators signaled Risk-Off. We did not adopt a defensive stance at that time. No such monetary and fiscal stimulus measures are planned in the current environment.
Today, five of the six indicators – economic, yield curve, monetary policy, credit spread, and momentum – are all signaling Risk-Off. Market-based indicators like credit spreads and momentum turned negative earlier in the year as spreads on investment grade and high yield bonds increased and equity markets waned. In recent months, the frameworks economic, yield curve, and monetary policy indicators have shifted negative as portions of the yield curve have inverted and the Federal Reserve continues to adopt a more restrictive strategy. Employment remains a bright spot. The last three times these five indicators were all pointing risk-off was in September 2000, January 1982, and September 1973.
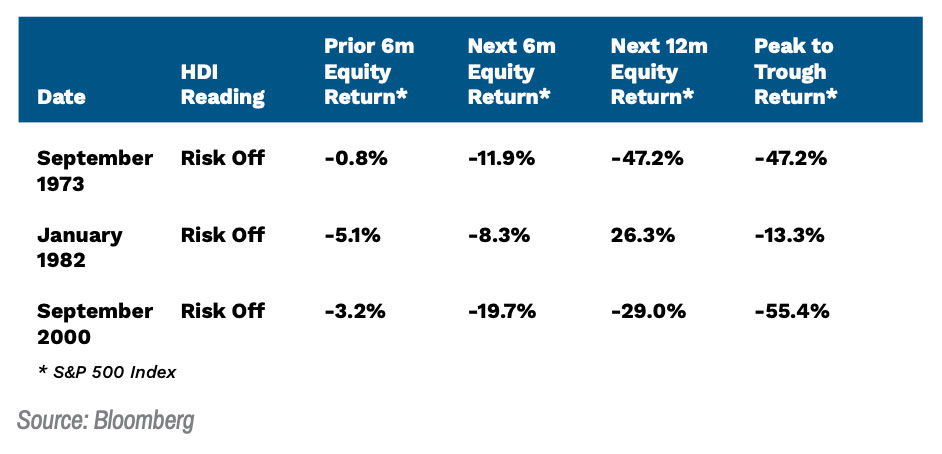
What is potentially different this time? While there are similarities, few market participants are predicting an oil crisis like we witnessed in the early 1970s or double-digit interest rates we experienced in the early 1980s when Fed Chair Paul Volcker was trying to break the back of inflation. At the same time, while investors are still questioning the earnings potential of many tech-related companies, few market participants are likening the current environment to the Dot-com Bubble burst of the early 2000s. Household and business balance sheets remain healthy, and employment is strong. Those investors positioning for a recession are doing so with the expectation that it will be a “shallow” one.
How does a Risk-Off stance potentially go against us? If we see a quick end to the war in Ukraine or China dramatically lessens its no-COVID policies, we will likely see a rebound in equity markets. Geopolitics is unpredictable, and the odds of either happening in the near term is not low. In either case, pressure on the Fed to fight inflation with the “hammer” of interest rate policy lessens, which could lead to a positive change in our outlook.
Highland Associates Cross Asset Views
As of 09/21/2022