
Download Asset Allocation | October 2025
1999
Economic Update
Regions Economic Division
The late 1990s changed markets and culture forever, and the similarities to the current environment are becoming increasingly undeniable. Technological innovations that defined an era- the internet revolution- find their modern counterpart in artificial intelligence. Both fueled powerful rallies, (excluding periods between 1995 and 1999) the three-year annualized performance through September is the strongest since the S&P 500 was first created. Just as in 1998, the FED pivoted from a multi-year period of tightening to easing, having successfully fought inflation and engineered a soft landing. Comparisons between valuations, index concentration, and leadership abound. As in every great bull run, voices of caution and optimism clash. Echoes of bull and bear markets past can be heard as Paul Tudor Jones and other storied investors call for the exuberance to continue into potential bubble territory. However, it’s just (a party and parties weren’t meant to last).
Historical parallels aside, October has not been without its share of tricks or treats. A signed peace treaty between Israel and Palestine has signaled potential peace in the Middle East. Meanwhile, trade tensions between the U.S. and China have flared anew over rare earth exports, and some market participants could have sworn it was judgement day when a surprise 100% tariff threat sent risk assets tumbling. At home, the U.S. Government shutdown drags into its third week, leaving government employees unpaid and critical data- on which markets rely- unreleased. Will the economy and market’s momentum endure the absence of clear signals? Or beneath the investor indifference and exuberance, are we already running out of time?
It’s hard to know where you’re going when you’re not sure where you are. That is a lesson we learned the hard way thanks to navigational skills so woefully inadequate that at times not even GPS can save us. We’ve used that hard-learned insight over the years as a metaphor for trying to divine the path ahead for the U.S. economy in times of heightened uncertainty and/or when the various economic data series are sending decidedly mixed messages. This seems like one of those times, particularly since the shutdown of the federal government, still ongoing at this writing, will meaningfully constrict the flow of economic data, the most notable example thus far being the September employment report which had been scheduled for release on October 3.
As for the effects of the shutdown, past shutdowns have tended to be nonevents for the U.S. economy, which likely goes a long way toward understanding why the markets have, at least thus far, taken a fairly sanguine view of this one. While there are disruptions in activity and furloughed federal government employees are not being paid, activity deferred during shutdowns tends to ultimately be made up for and furloughed workers are given back pay. Not made whole, however, are private sector individuals/firms working as contractors to the federal government and who, as such, suffer a loss of income during shutdowns. The longer the duration of a shutdown, the greater the potential for more significant and lasting impacts on the economy, and there is simply no way of knowing how long the current shutdown will last. Moreover, one thing that could make this shutdown different than those in the past is the threat of permanent reductions in the federal government workforce, which could add thousands of workers to the ranks of those who have already taken voluntary buyouts/early retirement. Indeed, most of those workers would have officially come off the books at the end of the fiscal year on September 30, which is why we and most others expect the October employment report, when it is ultimately published, to show a decline of around 200,000 federal government jobs.
To be sure, there is the usual stream of privately produced data series, such as the monthly surveys from the Institute for Supply Management (ISM) and the monthly reports on private sector job growth from payroll processing firm ADP, as well as the various “alternative” data series. Many of the alternative data series, however, are fairly new and not all providers disclose the methodology used to produce their data. As such, perhaps the best analogy is that we’re driving in a very dense fog, with limited visibility of the immediate path ahead and none whatsoever of what lies further down the road. That would be less of a hurdle if we were sure where we were when the flow of data suddenly turned into a trickle.
While it may seem like assessing the state of the economy with a full slate of data at hand should be a fairly straightforward endeavor, the reality is that assessments of the state of the U.S. economy ahead of the shutdown were, to stick with our theme here, all over the map. While some contend that the U.S. economy was in or on the verge of recession, others contend the economy was on fairly solid footing. More broadly, the Bureau of Labor Statistics’ (BLS) release of their preliminary estimate of their annual benchmark revision to the recent historical data from the monthly establishment survey, showing the level of nonfarm employment as of March 2025 would be revised down by 911,000 jobs, seems to have changed how many viewed the economy, and not for the better. As a side note, the BLS will publish the final results of the benchmark revisions with the January 2026 employment report, set for release on February 6.
We were amongst those pushing back on the rather downbeat assessments of the economy. For the most part, the last batch of data released prior to the shutdown portrayed an economy on firm footing rather than an economy on the verge of rolling over. The third estimate from the Bureau of Economic Analysis (BEA) showed real GDP grew at an annual rate of 3.8% in Q2, up from the second estimate showing 3.3% growth. Note that the BEA’s third estimate incorporated their annual revisions to the data from the National Economic Accounts, the root source of the BEA’s estimates of GDP, personal income, corporate profits, and a host of other series. While those revisions were largely uneventful in that there were no meaningful changes to prior estimates of real GDP growth, one thing that did stand out to us is that corporate profits were much weaker over 1H 2025 than had previously been reported. If nothing else, the timing was lousy, given that we devoted this space last month to a discussion of elevated profit margins, but even with the downward revisions to the 1H 2025 data, profit margins remain easily above historical norms.
Some have dismissed the upward revision to Q2 real GDP growth on the grounds that the Q2 data are backward looking. While that may be the case, our tracking estimate had Q3 real GDP growth running at or slightly above a 3.0% annualized rate. The report on August personal income and spending, the last published ahead of the shutdown, showed real consumer spending grew 0.4%, putting Q3 growth in real consumer spending on course to top the 2.5% annualized growth logged in Q2. Data from the Census Bureau show orders for core capital goods, an early indicator of the data on business investment in equipment and machinery in the GDP data, followed up on July’s 0.8% increase with a 0.6% increase in August. The weekly data on initial claims for unemployment insurance, still available during the shutdown as they are compiled by the individual states, show that as of the last week of September the rate at which workers were being laid off was still below the pre-pandemic pace.
There are some obvious soft spots in the economy, one being the housing market, with builders cutting back on new single family starts as they concentrate on paring down uncomfortably high inventories of spec homes for sale. The most glaring soft spot is the pronounced slowdown in the pace of job growth which, as noted above, seems to be setting the tone for how many see the broader economy. We are by no means downplaying this, as we have for months pointed to a slowing trend rate of job growth. We see this, however, as more of a labor supply story than a labor demand story in light of the significant outflow of foreign-born labor over the course of 2025 which in our view has acted as a material drag on the rate at which firms are adding jobs. While we do see demand-side factors at play, we think the slower pace of job growth to be a labor supply story.
The PCE Deflator, the FOMC’s preferred gauge of inflation, showed core inflation running at 2.9% in August, and to the extent that tariff pass-through becomes more pronounced over coming months, core inflation could likely push higher. That inflation could push even further above their 2.0% target; however, it did not deter the FOMC from cutting the Fed funds rate by twenty-five basis points at their September meeting as enough members saw the downside risks to the labor market as a more pressing concern than the upside risks to inflation. While the updated dot plot implies two additional quarter-point cuts by the end of 2025, there is nothing close to resembling a strong consensus around that view.
Chair Powell referred to the September cut as a “risk management” cut, i.e., aimed to help alleviate the downside risks to the labor market. In that sense, the Committee could opt for another twenty-five basis point cut at this month’s meeting if the flow of economic data is still impeded by the government shutdown, the premise being that the shutdown may pose even greater risks to the labor market that would warrant a less restrictive monetary policy stance. Like the rest of us, the FOMC is now contending with a lack of timely indicators as to the state of the U.S. economy, meaning that how anyone saw the economy prior to shutdown is probably how they will continue to see it until the shutdown is over and the data start to flow again.
Sources: Bureau of Economic Analysis; Bureau of Labor Statistics; U.S. Census Bureau
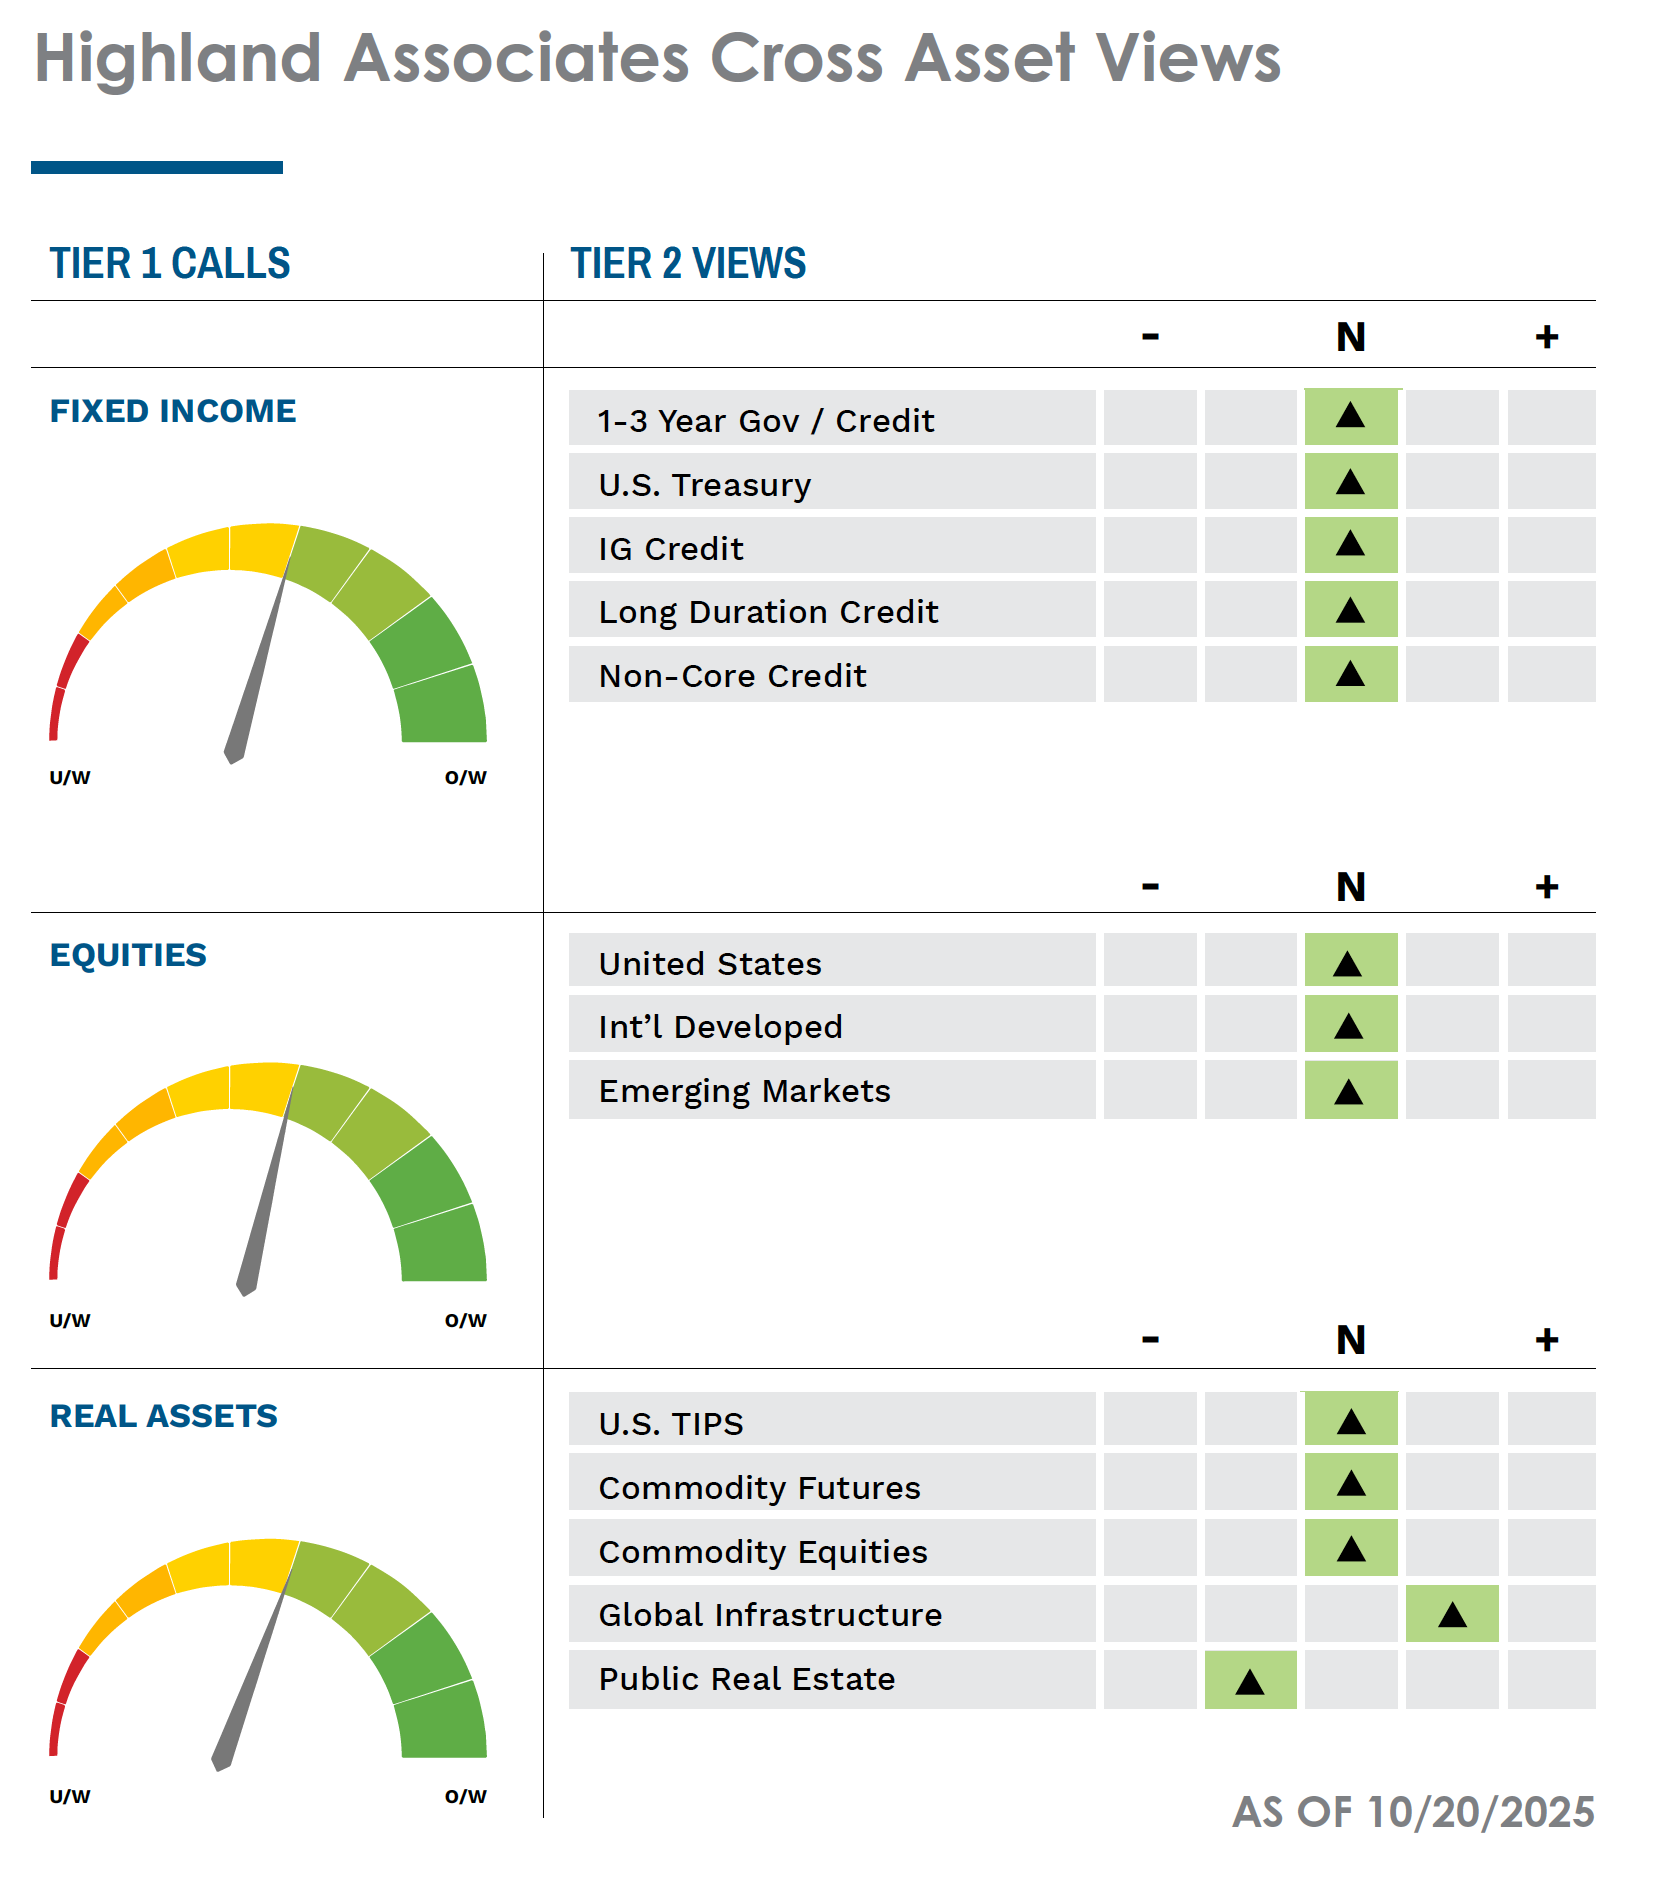
Investment Strategy Update
Regions Multi-Asset Solutions & Highland Associates
U.S. equities across the market capitalization spectrum produced gains in September with large caps leading the charge due to strength of the ‘Magnificent 7’ and beneficiaries of the mania surrounding artificial intelligence (AI) and data centers. Breadth narrowed during the month, however, as communication services, consumer discretionary, information technology, and utilities led while cyclical areas more reliant on the path of the U.S. economy, such as energy, financials, and industrials lagged. Strong relative performance out of secular growth stocks tied to the AI theme is a reasonable base case in the coming months. Many active managers are trailing their benchmark and, as such, will buy any dip in these names or run the risk of chasing these stocks higher into the seasonally strong October through December stretch.
The consensus estimates for S&P 500 earnings in 2025 and 2026 were again revised higher, albeit modestly, in September, continuing a trend that has been in place since May. Positive earnings revisions have been supportive of improved investor sentiment in recent months, but weekly AAII surveys point to continued disbelief in the rally with those ‘bearish’ on U.S. stocks over the next six months still well above the historical average. This scenario provides a healthy backdrop for U.S. stocks to continue climbing a wall of worry. With the S&P 500 trading at almost 25 times projected 2025 earnings and 22 times expected 2026 earnings, trailing earnings likely matter little compared to the outlook/guidance provided. The bar perceived beneficiaries of AI and related spending must chin when providing commentary and forward guidance is now exceedingly high, with shortfalls potentially punished severely.
While growth-oriented sectors powered gains in September, positive U.S. economic surprises stood out in the back-half of the month with durable goods orders surprising to the upside and jobless claims surprising to the downside, among other notable data points. This dynamic, should it persist, could lead to a broadening out of the rally with economically sensitive sectors participating in a more meaningful way if data continues to surprise to the upside. The Fed is increasingly focused on supporting the labor market after making a ‘risk management cut’ last month, and companies are seeking out ways to take advantage of the ability to immediately expense capital expenditures tied to the “One Big Beautiful Bill Act.” Thus, both monetary and fiscal policies appear supportive of further upside in U.S. stocks into 2026.
While we remain constructive on the outlook for U.S. stocks into year-end, we acknowledge that expectations and valuations for large caps provide little margin for error. However, old habits die hard, and investors may continue crowding into the largest, most well capitalized companies that make up a sizable slug of the S&P 500, thus limiting the depth of any near-term drawdown on guidance shortfalls.
S&P Small Cap 600 and S&P Midcap 400 failed to build off momentum from August, producing only modest gains in September and lagging U.S. large and mega cap stocks in the process. After investors put the rate cut playbook into action after a lackluster July payrolls report, propelling the S&P 600 higher by 7% in August alone, they appeared to ‘sell the news’ and take profits in the wake of a 25-basis point rate cut at the FOMC’s September meeting. This dynamic highlights to us that investors continue to view small and mid-cap stocks as little more than a trade and remain hesitant to reallocate capital that has been treated quite well in the S&P 500 into smaller cap alternatives except over a short-term time horizon, but that’s where the opportunity lies.
Valuation Gap Between large-Cap and SMid Has
Widened Even Further
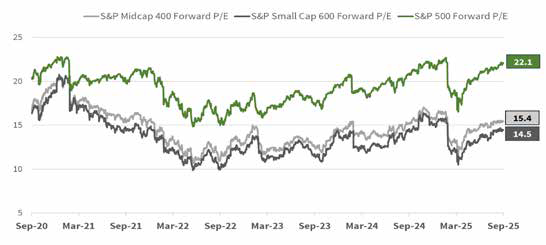
Source: Bloomberg
In international markets the tailwinds for Emerging Markets and the headwind for developed markets are building. The MSCI Emerging Markets index gained 7% during September with exposure to China, Mexico, South Africa, South Korea, and Taiwan notable contributors as indices tied to each country rose 9% or more on the month. Momentum and broad-based strength behind the move higher in the MSCI EM index has been impressive and stands in contrast to the MSCI EAFE’s narrowing leadership profile. The MSCI EAFE developed markets index generated a 1.9% total return last month with country indices tied to Italy, Japan, and Spain all returning 1.5% or more on the month. On the other side of the ledger, Australia, Germany, and Switzerland, which together account for 25% of the MSCI EAFE index, closed out the month with modest losses of 1% or less.
Concerns surrounding potential political upheaval and a more uncertain outlook for fiscal policy are swirling across developed nations abroad, and investors may be more cautious when allocating capital to developed international equities. Conversely, emerging markets, on balance, have the wind at their sails as capital expecting an improved growth outlook in the coming years has flowed into many of these economies, which has contributed to consistent strengthening of EM currencies since the end of April. With inflationary pressures easing and the U.S. dollar weaker versus a broad basket of EM currencies, central banks have more room to ease monetary policy to spur growth in the coming year, which should support a continued lift in stocks and bonds tied to developing markets.
Bonds are fairly to richly valued, but we expect no catalysts for this to correct soon. Yields on U.S. Treasuries moved lower into mid-September and as expected, the FOMC prepared cut 25 bps at their October meeting. Inflation data came in as expected during the month with the core PCE Deflator, the Fed’s preferred inflation gauge, rising 2.9% year over year, while initial and continuing jobless claims showed some signs of stabilization in the U.S. labor market as the month wound down. Taken together, sticky inflation and a resilient labor market called into question just how aggressively the FOMC would be cutting the funds rate in the coming months. Market participants expect 50-basis points of cuts between now and year-end, but we expect the FOMC to move at a more measured pace with just one more 25-basis point move in 2025 remaining our base case.
Treasury yields, broadly speaking, are expected to remain anchored near current levels over the near-term, in our view. Inflationary pressures are showing few signs of abating, and surprises in the U.S. economic data in September skewed to the upside. This combination could force the FOMC to drag its feet in the coming months and put upward pressure on longer-term Treasury yields along the way. From the perspective of a fixed income investor, very little appears cheap at present, and many segments of the bond market are trading at rich valuations relative to historical levels/norms. That doesn’t mean that bonds can’t remain in frothy territory for the foreseeable future, but a diversified core approach that includes Treasuries, investment grade corporate bonds, and exposure to GSE mortgages is a good way to reduce portfolio volatility while waiting for dislocations to create tactical opportunities to reallocate capital.
Higher grade corporate borrowers were eager to tap the credit market in September with investment grade (IG) issuance topping $200B during the month, just the fifth month ever to surpass that level. Buyers had a ravenous appetite for relatively higher yielding, longer duration corporate bonds as they sought to lock in higher yields on the prospect of additional cuts to the Fed funds rate in the coming months. A willingness to buy at any price pushed the credit spread for the Bloomberg Corporate index over Treasuries lower by 5-basis points on the month to end the month at 73-basis points, marginally above year-to-date tight levels.
This is a sign that the rally in both stocks and riskier bonds could continue as both liquidity and investor risk appetite remain supportive of further price gains over the near-term. With the IG credit spread just above 70-bps over similar duration Treasuries at month-end, investors are certainly receiving paltry compensation for taking credit risk. But with the U.S. economy on solid footing and the FOMC likely to gradually cut the funds rate in the coming quarters, it’s difficult to envision a scenario in which spreads widen materially in the near-term, leaving us with the view that corporate bonds are likely to remain well-bid into year-end.
The Bloomberg U.S. High Yield Index returned 0.8% in September, bringing year-to-date gains to 7.2%. Spreads have compressed meaningfully throughout the balance of the year, ending the third quarter at 270 basis points over Treasuries, well below the historical average range of 400–500 basis points. While current spread levels are tight, several structural shifts in the high yield market help explain a portion of this compression. First, the credit quality of the index has improved, with a notable decline in CCC-rated issues and an increase in large-scale BB-rated credits. Second, the maturity profile of the index has shortened. During 2020 and 2021, many high yield issuers extended maturities by locking in low yields, pushing the average maturity to 6.6 years. However, with issuance and refinancing activity slowing over the past four years, the average maturity has now fallen to 4.8 years, near all-time lows for the benchmark. Given the upward-sloping nature of the high yield credit curve, shorter maturities could justify lower spreads. Lastly, market liquidity has improved, which supports higher valuations and tighter credit spreads but also suggests that some of the traditional illiquidity premium historically embedded in high yield bonds may have diminished to a certain degree. Looking ahead, we hold a slightly cautious view on high yield credit as current valuations appear stretched and leave little margin for error. While structural improvements, such as better credit quality, shorter maturities, and enhanced liquidity justify some of the spread compression, we believe the risk/reward profile has become less compelling at these levels.
Investment Grade, High Yield Spreads At Or Near All
Time Tights
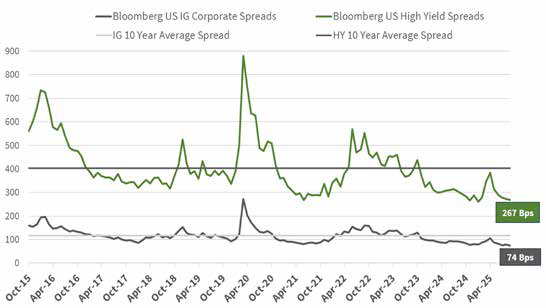
Source: Bloomberg
Highland has held a risk-neutral stance throughout 2025, but we are carefully monitoring some of the weaknesses beginning to emerge in capital markets and the US consumer. As mentioned previously, the U.S. government shutdown has cast a fog over a wide array of economic data and what little data is being released is less reliable than the data we would get from agencies such as the BLS. Unemployment has crept up slowly since April and could accelerate if the administration follows through with government layoffs. Consumer sentiment has also fallen throughout 2025 as year-over-year inflation remains well above the Fed’s mandated 2% target. Despite these troubles, equity markets have continued to push their highs and credit markets continue to trade tighter. Bad news has been good news for risk assets this year because bad news means the Fed may cut rates at a faster pace if labor markets continue to deteriorate. We believe the risk asset rally is partially due to investors front-running the anticipated rate cuts, but if economic and labor weakness is indeed growing, equity markets may whipsaw as those trades are unwound for more defensive positions. Our sights are set on the next Fed meeting at the end of October where Fed Chair Jerome Powell may provide some additional insights into the economy in-lieu of the delayed economic releases.
IMPORTANT DISCLOSURES: This publication has been prepared by the staff of Highland Associates, Inc. for distribution to, among others, Highland Associates, Inc. clients. Highland Associates is registered with the United States Security and Exchange Commission under the Investment Advisors Act of 1940. Highland Associates is a wholly owned subsidiary of Regions Bank, which in turn is a wholly owned subsidiary of Regions Financial Corporation. Research services are provided through Multi-Asset Solutions, a department of the Regions Asset Management business group within Regions Bank. The information and material contained herein is provided solely for general information purposes only. To the extent these materials reference Regions Bank data, such materials are not intended to be reflective or indicative of, and should not be relied upon as, the results of operations, financial conditions or performance of Regions Bank. Unless otherwise specifically stated, any views, opinions, analyses, estimates and strategies, as the case may be (“views”), expressed in this content are those of the respective authors and speakers named in those pieces and may differ from those of Regions Bank and/or other Regions Bank employees and affiliates. Views and estimates constitute our judgment as of the date of these materials, are often based on current market conditions, and are subject to change without notice. Any examples used are generic, hypothetical and for illustration purposes only. Any prices/quotes/statistics included have been obtained from sources believed to be reliable, but Highland Associates, Inc. does not warrant their completeness or accuracy. This information in no way constitutes research and should not be treated as such. The views expressed herein should not be construed as individual investment advice for any particular person or entity and are not intended as recommendations of particular securities, financial instruments, strategies or banking services for a particular person or entity. The names and marks of other companies or their services or products may be the trademarks of their owners and are used only to identify such companies or their services or products and not to indicate endorsement, sponsorship, or ownership by Regions or Highland Associates. Employees of Highland Associates, Inc., may have positions in securities or their derivatives that may be mentioned in this report. Additionally, Highland’s clients and companies affiliated with Highland Associates may hold positions in the mentioned companies in their portfolios or strategies. This material does not constitute an offer or an invitation by or on behalf of Highland Associates to any person or entity to buy or sell any security or financial instrument or engage in any banking service. Nothing in these materials constitutes investment, legal, accounting or tax advice. Non-deposit products including investments, securities, mutual funds, insurance products, crypto assets and annuities: Are Not FDIC-Insured I Are Not a Deposit I May Go Down in Value I Are Not Bank Guaranteed I Are Not Insured by Any Federal Government Agency I Are Not a Condition of Any Banking Activity.
Neither Regions Bank nor Regions Asset Management (collectively, “Regions”) are registered municipal advisors nor provide advice to municipal entities or obligated persons with respect to municipal financial products or the issuance of municipal securities (including regarding the structure, timing, terms and similar matters concerning municipal financial products or municipal securities issuances) or engage in the solicitation of municipal entities or obligated persons for such services. With respect to this presentation and any other information, materials or communications provided by Regions, (a) Regions is not recommending an action to any municipal entity or obligated person, (b) Regions is not acting as an advisor to any municipal entity or obligated person and does not owe a fiduciary duty pursuant to Section 15B of the Securities Exchange Act of 1934 to any municipal entity or obligated person with respect to such presentation, information, materials or communications, (c) Regions is acting for its own interests, and (d) you should discuss this presentation and any such other information, materials or communications with any and all internal and external advisors and experts that you deem appropriate before acting on this presentation or any such other information, materials or communications.
Source: Bloomberg Index Services Limited. BLOOMBERG® is a trademark and service mark of Bloomberg Finance L.P. and its affiliates (collectively “Bloomberg”). BARCLAYS® is a trademark and service mark of Barclays Bank Plc (collectively with its affiliates, “Barclays”), used under license. Bloomberg or Bloomberg’s licensors, including Barclays, own all proprietary rights in the Bloomberg Barclays Indices. Neither Bloomberg nor Barclays approves or endorses this material or guarantees the accuracy or completeness of any information herein, or makes any warranty, express or implied, as to the results to be obtained therefrom and, to the maximum extent allowed by law, neither shall have any liability or responsibility for injury or damages arising in connection therewith.