
Download Asset Allocation | October 2022
’Cause this is Thriller
Economic Update
Good (Bad) Data Are Bad (Good) News to On-Edge Markets
By Regions Economic Division
As we noted last month, even in the most normal of times, the economic data can send often conflicting and confusing signals on the state of the economy. With the U.S. economy either at or nearing a cyclical turning point, it becomes even harder to ferret out the meaning of a steady barrage of seemingly conflicting data. The first week of October was the latest illustration of this point, with signs that the manufacturing sector is starting to wobble while the labor market remains strong. As if this wasn’t confusing enough, the reaction in the financial markets to each new piece of data may seem even more confusing.
We’ve fallen back into a “good (bad) data are bad (good) news” pattern in which a piece of data we’d perceive as being positive triggers a rout in the markets, while a piece of data we’d perceive as being negative sparks a rally in the markets. Moreover, the magnitude of the reactions in both the equity and fixed income markets seems out of proportion to the information actually contained in any given data point. Clearly, market participants are on edge over the extent to which the FOMC will continue to push the Fed funds rate higher. What is less clear, however, is whether the markets’ reactions to the economic data reflect rising/falling fears of the FOMC going too far and pushing the economy into recession, or whether the reactions reflect the degree to which hopes of the FOMC executing a quick pivot from rate hikes to rate cuts are being dashed/bolstered. Either way, these wild swings in sentiment have fostered considerable volatility in asset prices.
The Institute for Supply Management’s (ISM) September surveys of the manufacturing and services sectors illustrate the mixed messages in the economic data. The ISM Manufacturing Index remains above the 50.0% break between contraction and expansion, but at 50.9% in September, that margin has narrowed considerably. Not only has the pace of the expansion in the factory sector slowed, but the expansion has become increasingly less broad based. Only 9 of the 18 industry groups included in the ISM’s survey reported expansion in September, the fewest in any month since May 2020, while 7 industry groups reported contraction.
The slower and narrower any expansion is, the more vulnerable it is. To that point, orders for new manufactured goods fell in September, the third decline in the past four months, while backlogs of unfilled orders have been largely worked off, a combination that bodes poorly for manufacturing employment and output in the months ahead. To our earlier point, the less-than-upbeat messages in the September survey brought more than a little cheer to the markets, helping push equity prices higher and yields on U.S. Treasury securities down on the day of its release.
In contrast, the ISM’s survey of the services sector showed continued steady and broadly based expansion in September, with 15 of the 18 industry groups included in the survey reporting growth. Growth in new orders remains steady, which should help sustain job growth in the broad services sector over coming months. In another reflection of the diverging fortunes of the manufacturing and services sectors, manufacturing firms report price pressures on non-labor inputs have eased materially over recent months, which is mainly a function of fading demand. In contrast, firms in the services sector continue to face intense price pressures for non-labor inputs, which helps sustain services price inflation on the retail level, even as goods price inflation fades.
While some areas of the U.S. economy, most notably the housing market, have clearly slowed, the labor market has been a notable outlier. One sign that this may be changing came in the BLS’s Job Openings and Labor Turnover Survey (JOLTS) for August. The number of open jobs fell sharply in August, and the ratio of open jobs to unemployed persons fell from 1.97 in July to 1.67 in August. In keeping with our general theme, this news was greeted warmly in the markets, with market participants either not knowing or just not caring that there are still more than 10 million open jobs across the U.S. economy and, even though down, at 1.67, the ratio of open jobs to unemployed persons is still far above the highest ratio on record prior to the pandemic.
The Bureau of Labor Statistics (BLS) reported that total nonfarm employment rose by 263,000 jobs in September, with private sector payrolls up by 288,000 jobs and public sector payrolls down by 25,000 jobs. While the pace of job growth has slowed, job growth remains notably broad based across private sector industry groups, which is an indication that the labor market is not about to roll over. The reality is that, even with the drop in job openings and the pace of job growth slowing, labor supply remains no match for labor demand.
The unemployment rate fell back to 3.5% in September from 3.7% in August. As we noted last month, the “surge” in labor force participation that pushed the jobless rate up to 3.7% in August from 3.5% in July was largely a seasonal adjustment mirage, one that we anticipated would be reversed in the September data, leading to a decline in the jobless rate. It is no secret that the data from the BLS’s household survey are inherently volatile from one month to the next. As such, any given change in any given number drawn from that survey in any given month is just as likely to be noise as it is to be signal, a point apparently lost on those on edge about what any given number might mean for the FOMC. News of the decline in the jobless rate sent the markets reeling, with equity prices down sharply and yields on U.S. Treasury securities jumping higher after the release of the September employment report.
As hard as it may sometimes be, it helps to remember that the headline number on any economic data release tells you very little of value (that’s what the details are for), that any given headline number (and underlying details) will be revised, in many cases more than once, and that the FOMC does not make decisions based on any single data point in any given month. While none of that seems to matter to many market participants these days, it also helps to note that there is no signaling value in the wild swings in asset prices that are becoming almost common. The bottom line is that the FOMC remains singularly focused on inflation, and inflation is now and will for some time be far too high for the FOMC to take their collective foot off the gas, even if that means they push the economy into recession. That comes straight from the FOMC, and while absolutely no one likes that message, were more market participants willing to accept it, the markets would likely be calmer than they have been of late.
Sources: Bureau of Labor Statistics; Institute for Supply Management
Investment Strategy Update
As communicated last month, the Highland Investment Working Group adopted a defensive stance in client portfolios in late Q3. Five of the six indicators we monitor as part of our Highland Diffusion Index framework – economic, yield curve, monetary policy, credit spread, and momentum – are all signaling Risk-Off. Market-based indicators like credit spreads and momentum turned negative earlier in the year as spreads on investment grade and high yield bonds increased and equity markets waned. In recent months, the frameworks economic, yield curve, and monetary policy indicators have shifted negative as portions of the yield curve have inverted and the Federal Reserve continues to adopt a more restrictive strategy. Employment remains a bright spot.
We initiated an underweight position in equities in favor of short duration bonds and hedged equity strategies in September. With yields rising since the start of the year, bonds are now priced to deliver returns in line with long-term averages. Moreover, higher yields help compensate investors who prefer to play defense in this period of uncertainty and higher volatility. We also continue to maintain an overweight to U.S. equities and alternative, non-directional fixed income strategies, which have both been accretive to portfolios year-to-date.
U.S. Equity Market Update
After underperforming every major market from 2000 to 2008, U.S. stocks have outperformed the rest of the world by a wide margin. During this time, Highland held an overweight to U.S. equity markets in client accounts from January 2011 to December 2014, August 2018 to February 2021, and November 2021 to current. These allocations have served our clients well. However, the question we are asking ourselves today is how long can this long period of U.S. equity market outperformance continue? Our current positioning of overweight U.S. equities and underweight international equities remains attractive as a safe haven over the near-term, but we continue to watch for potential catalysts that would provide an opportunity to rotate into other markets.
Annualized Global Equity Market Returns
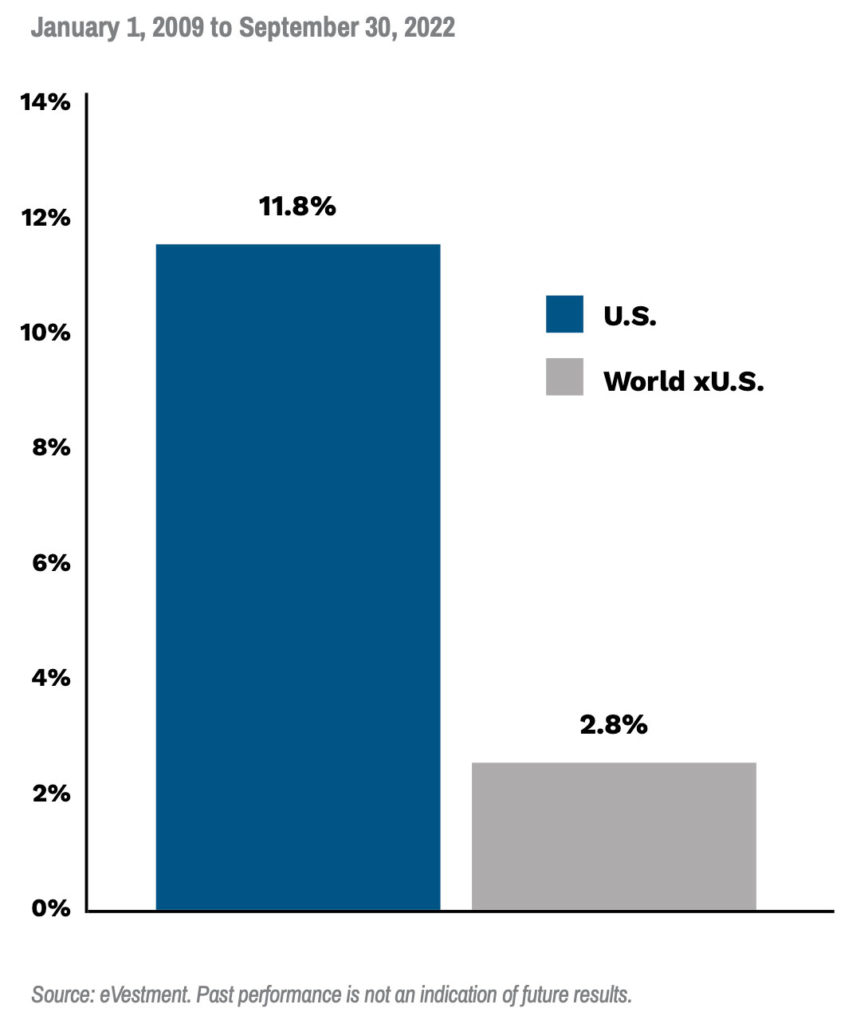
BCA, a leading provider of global investment research, points out that a surge in U.S. sales has been the biggest driver of U.S. outperformance during this period, followed by profit margins and then P/E expansion. Regarding sales and profit margins, BCA makes the case that they are both on shakier ground today than in the recent past. First, sales are closely linked to nominal GDP, and the IMF forecasts stronger growth outside the U.S. going forward. Second, historically any region’s profit margins are unable to remain above the global average longer than 15 years. This makes sense, as economic theory purports that when profitability is excessive in one market, increased competition will come in and exert downward pressure on margins. U.S. profit margins have now been above global levels for almost 13 years, which would imply we are in the later innings of U.S. dominance in this area.
Another catalyst we continue to monitor is the price of the dollar relative to other major global market currencies. When the dollar is rising, this can be a tailwind for U.S. equity market returns versus the rest of the world, and vice versa. Today the dollar is high. In nominal returns, the dollar exchange rate is the highest it’s been since 2002. In real terms, after adjusting for higher U.S. inflation, this is the highest exchange rate since mid-1980s. When the Federal Reserve pauses its current rate-hike campaign, we expect the dollar to fall as the gap between U.S. rates and international rates narrows. Moreover, the dollar tends to strengthen when global growth wanes and weaken when global growth is rising, as the U.S. remains the preferred safe haven. If and when global growth improves, we would also expect to see the dollar fall and make international markets more attractive.
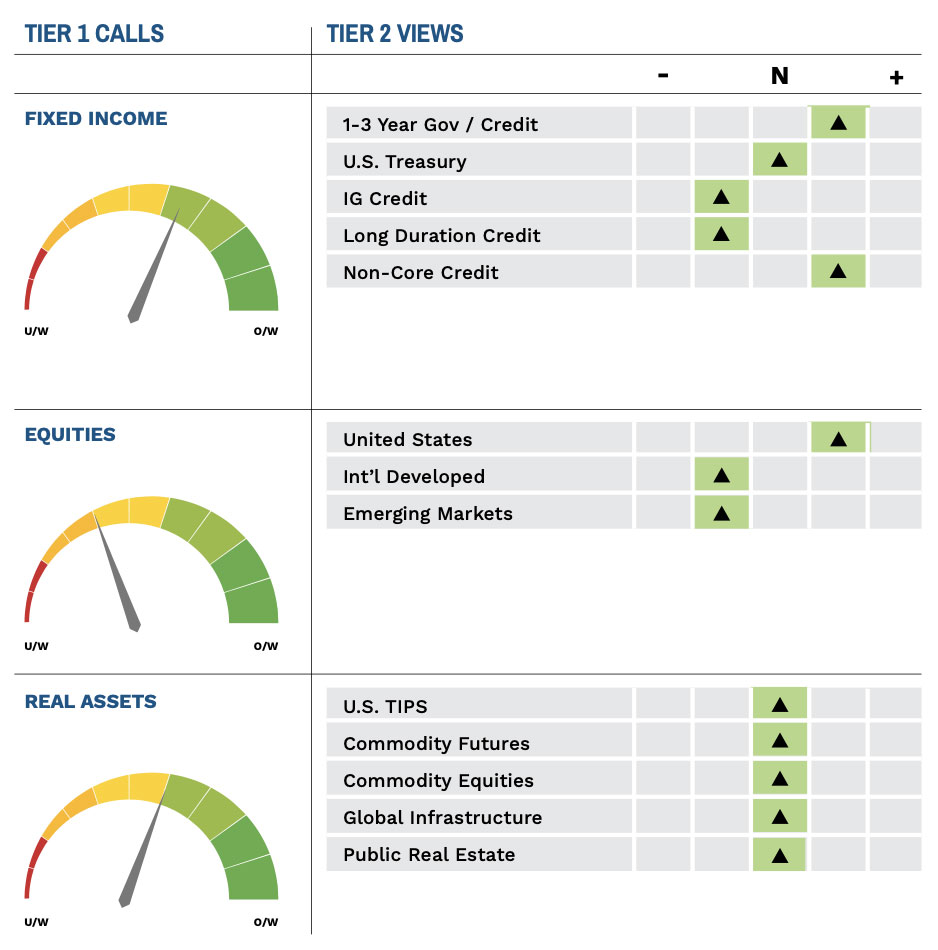
Highland Associates Cross Asset Views
As of 10/20/2022