
Download Asset Allocation | November 2023
Time of the Season
Economic Update
Well, That Didn’t Last Long, Did It?
By Regions Economic Division
On October 26, the U.S. Bureau of Economic Analysis (BEA) released their initial estimate of Q3 GDP, which showed real GDP grew at an annual rate of 4.9% during the quarter, with consumer spending, government spending, and a faster pace of nonfarm business inventory accumulation the main drivers of growth. The initial print on Q3 real GDP growth fell right in line with what had been a firmer tone, at least on the surface, of much of the economic data. As we saw it, there were two alternative views of how to interpret the robust Q3 growth. One interpretation was that the economy was largely immune to the effects of higher interest rates, and what many for some time saw as an inevitable recession was off the table. The alternative take was that the burst of growth seen in Q3 was unsustainable, largely a function of one-off supports that would quickly fade, and that while perhaps less probable, recession was still a possibility in the not-too-distant future. We lean more toward the latter interpretation, and we’ve been clear in our view that the pace of economic activity would slow sharply over the final quarter of 2023.
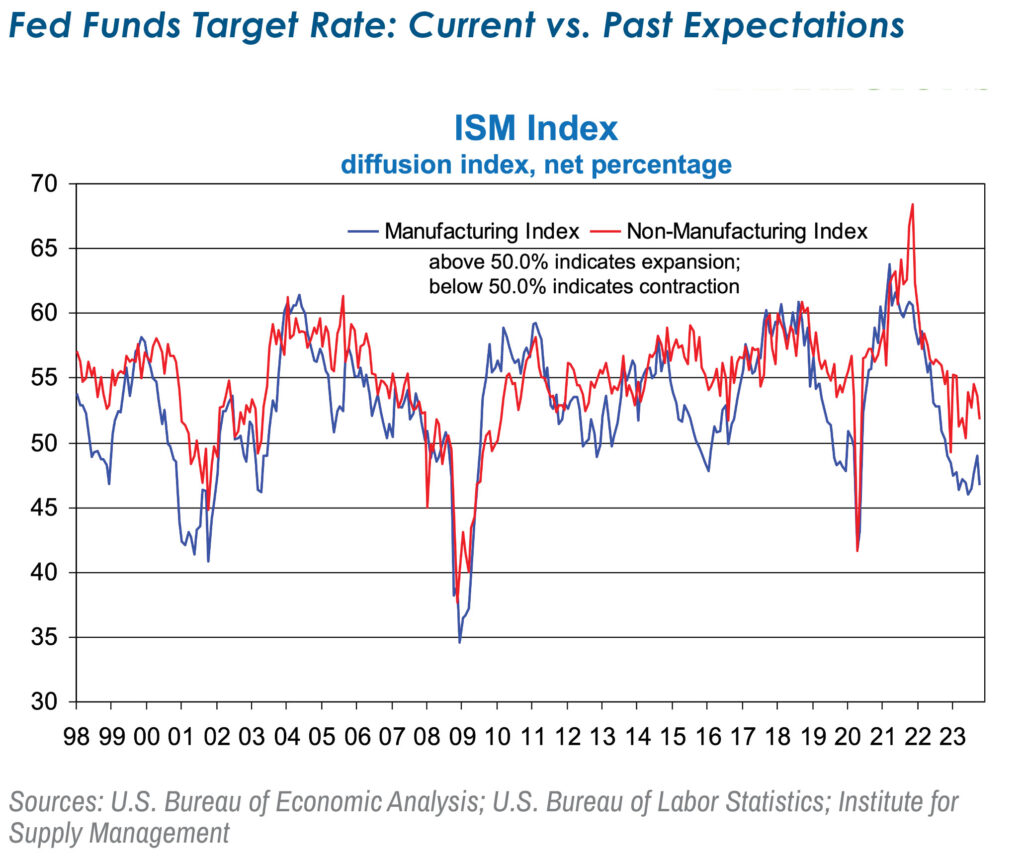
While it is far too soon, at least in terms of the flow of Q4 economic data, to draw any meaningful conclusions, the initial batch of data suggests Q4 growth got off to a very slow start. After the Institute for Supply Management’s (ISM) September survey offered glimmers of hope that conditions in the factory sector were at least beginning to stabilize, the October survey was more of a cold slap in the face. The ISM Manufacturing Index fell to 46.7% in October from 49.0% in September, indicating a 12th straight month of contraction. The details beneath the headline index were even more bleak. For instance, the index of new orders, an important forward-looking indicator, tumbled to 45.5% in October after having flirted with the 50.0% cut-off point between contraction and growth in September, with only 3 of 18 industry groups reporting growth in new orders. At the same time, October was the 13th straight month in which backlogs of unfilled orders contracted, which is important in that contracting new orders and thinning order backlogs set up a weak profile for production and employment. To that point, while the ISM’s gauge-indicated factory sector employment fell in October, we found it much more telling that ISM reported that firms were more aggressively using layoffs to manage head counts, “indicating a more urgent need to reduce staffing.” All in all, there are few signs that stability, let alone growth, is readily within reach in the manufacturing sector.
While the ISM Non-Manufacturing Index indicates that expansion in the broad services sector continued in October, it also shows the pace of that expansion slowed meaningfully, with the headline index falling to a five-month low of 51.8%. One striking detail of the October data was that export orders abruptly contracted after having grown steadily over the prior several months. This suggests that tepid global growth is finally starting to take a toll on activity in the broader services sector after having for months been a drag on activity in the U.S. manufacturing sector.
The U.S. Bureau of Labor Statistics (BLS) reported that nonfarm payrolls rose by 150,000 jobs in October, with private sector payrolls up by just 99,000 jobs and public sector payrolls rising by 51,000 jobs. At the same time, prior estimates of job growth in August and September were revised down by a net 101,000 jobs for the two-month period. The bulk of that downward revision came from private sector payrolls, continuing a string of downward revisions to the initial estimates of private sector job growth. One important caveat is that the UAW strike deducted roughly 34,000 jobs from manufacturing payrolls in October, as striking workers are not counted as employed under the BLS’s reporting conventions. With the strike having been settled, pending ratification of the proposed contracts, those jobs will be added back in the November data.
Even allowing for the impact of the UAW strike, the details of the October employment report were glaringly weak. The one-month hiring diffusion index, a measure of the breadth of hiring across private sector industry groups, fell to 52.0%, the lowest reading since April 2020, and furthering a trend that has seen job growth become meaningfully less broad based across industry groups. To that point, hiring in healthcare accounted for almost all private sector job growth in October. The average length of the workweek declined by one-tenth of an hour in October. While a decline in hours worked in durable goods manufacturing was expected given the impacts of the UAW strike, several other industry groups reported declines in average weekly hours. Hours worked have been drifting lower over the past several months, consistent with slowing, not accelerating, economic growth. The unemployment rate rose to 3.9% in October, and there were more people involuntarily working part-time due to slack business conditions.
As we noted above, with only a few data points for October to go on, it is far too soon to draw any meaningful conclusions regarding Q4 growth. That said, the few data points we do have at our disposal suggest a marked slowdown after the blistering pace of growth seen in Q3. And, while we may not be willing to draw conclusions at this point, market participants are showing no such reservations. Within a matter of a few days, much of the recent run-up in longer-term interest rates (which we discussed last month) was reversed and, after seemingly having finally accepted the Federal Open Market Committee’s (FOMC) “higher for longer” premise, market participants are now expecting a more aggressive course of Fed funds rate cuts in 2024 than had been the case just a few weeks ago.
The FOMC will be taking notice not only of the recent declines in longer-term interest rates but also of the recent easing in overall financial conditions. Some committee members had implied that tighter financial conditions may effectively substitute for additional funds rate hikes, so it would follow that a meaningful easing in financial conditions puts further rate hikes back on the table. While we still see further rate hikes as unlikely, at the very least easing financial conditions would seem to push rate cuts further out into the future if inflation remains well above the FOMC’s target rate. With the economic data all over the map and the markets and the FOMC not on the same page, about the only thing we can confidently predict at this point is that equity prices and market interest rates will remain volatile in the weeks ahead.
Investment Strategy Update
Entering a Historically Strong Season Stretch for Stocks
Regions Multi-Asset Solutions & Highland Associates
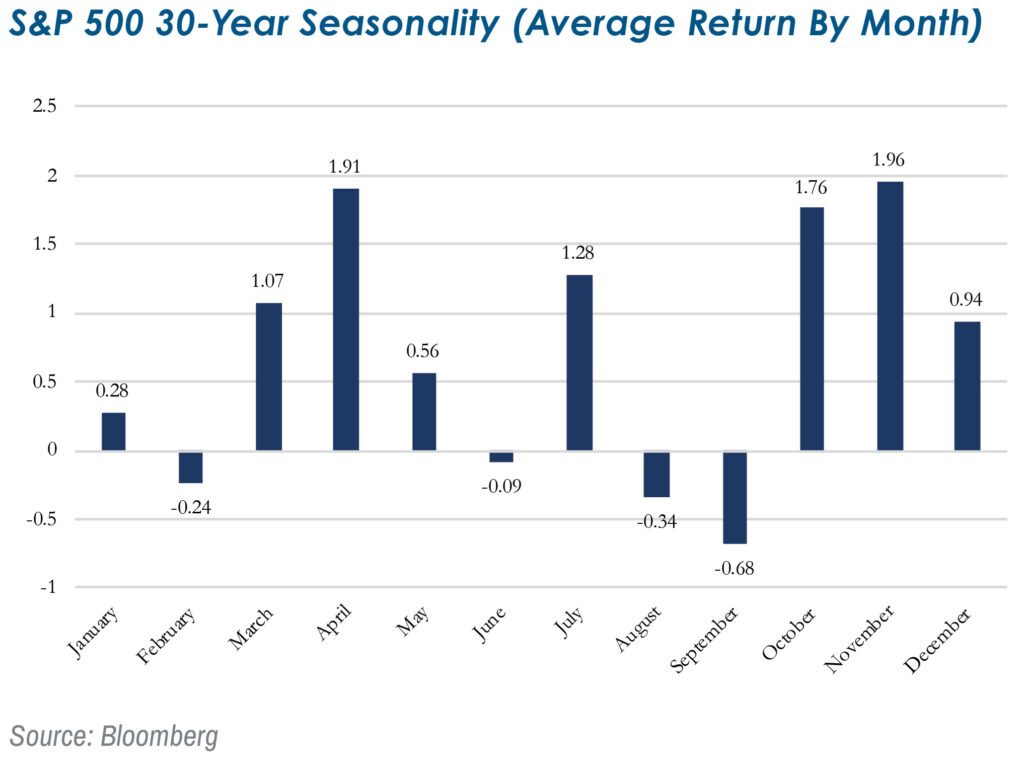
Over the prior 30 years, the November through January time frame has historically been a profitable stretch in the calendar for investors in the S&P 500. The stars appear to be aligning again for a positive finish as the sharp drop in Treasury yields at the start of November could provide a boost for investor sentiment after a challenging August through October period, which saw the S&P 500 lose 8.3% and the small-cap Russell 2000 decline by 16.8%. Stocks broadly entered November in oversold territory and bearish sentiment, evidenced by the latest American Association of Individual Investors (AAII) survey, which was at a level of pessimism not seen since last December. Interest rates stabilizing would be a tailwind for stocks and riskier bonds, broadly speaking, but mega-cap growth, specifically the “Magnificent 7,” would likely benefit the most as portfolio managers will be quick to add to positions in this year’s winners. Falling Treasury yields would also benefit consumer-oriented stocks in the discretionary and staples sectors, along with bond proxies such as real estate and utilities.
Small-Caps Aren’t Out of the Woods Yet, But Could Fare Better in ’24
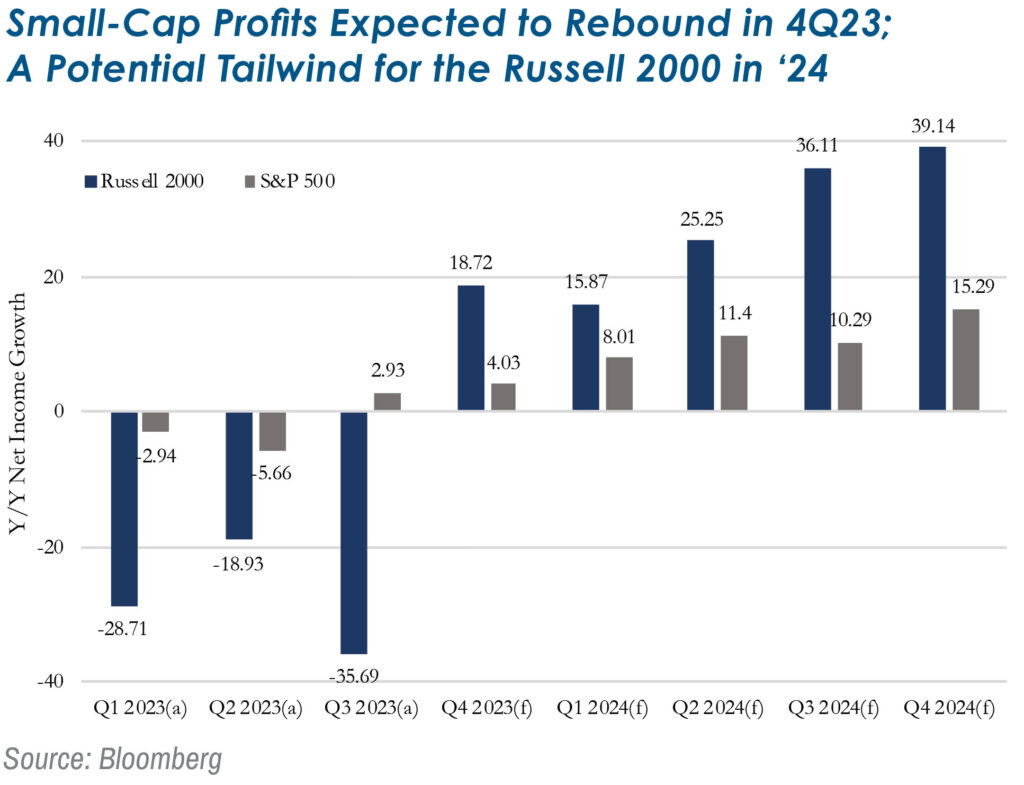
Small-cap stocks have borne the brunt of the rise in Treasury yields, as the Russell 2000 index fell 8.1% from September 20 through the end of October. So, if rising Treasury yields/interest rates are a headwind for small caps, then falling yields/rates should be a tailwind, right? The short answer is yes, but it’s not so clear cut. If yields are falling due to economic growth expectations moving lower, then that headwind would offset some of the benefit received by smaller companies from lower rates/funding costs. The fall in Treasury yields so far in November has been due, at least in part, to weaker manufacturing data and a cooler nonfarm payrolls report from October, with both pointing toward slowing economic growth into year-end.
This is a headwind for the Russell 2000, which skews toward economically sensitive sectors. It’s also notable that while Treasury yields have moved sharply lower to start the month, the 10-year yield, specifically, is now back to where it was in late-September, and yields across the curve remain elevated relative to recent history. With many companies expected to tap the capital markets in 2024 or 2025 as existing debt matures, borrowing costs and interest expense will rise, but to what degree remains to be seen. Small-cap valuations are cheap but justifiably so as headwinds from higher rates have yet to be realized. But we can’t ignore the forecasted increase in net income for the Russell 2000 over coming quarters.
A Mixed Outlook for Foreign Markets into Year-End
Outside the U.S., the eurozone and U.K. are likely to remain challenged from an economic perspective, but over the near-term much may hinge on the weather. A colder winter could lead to a spike in energy/electricity prices, which would put significant upward pressure on inflation and may force the European Central Bank (ECB) to further tighten monetary policy, tamping down economic growth. Valuations and dividend yields are appealing, but we don’t expect euro area or U.K. equities to outperform into year-end. Japan’s economic momentum remains impressive, however; should the Japanese yen strengthen materially as the Bank of Japan (BoJ) alters yield curve control and yields on Japanese Government Bonds (JGBs) rise, economic growth projections for next year may need to be ratcheted lower. China is also well worth watching into year-end as one of the year’s lagging areas could benefit as tax loss selling abates and portfolio managers look to load up on higher beta exposures to participate in a Santa Claus rally. As China goes, likely so go emerging markets, but the U.S. dollar weakening to start November is a most welcome tailwind for developing economies.
Cash vs. Bonds: Beware the Siren Song of Short-Term Rates
Elevated yields on cash and ultra short-term bonds have lured investors to the front of the Treasury curve in 2023, and the call to “get short” has grown louder in recent months as Treasury yields have risen sharply, leading to paper losses on longer duration bonds. The rise in long-term Treasury yields has led some investors to discard their strategic allocations to bonds in favor of cash, but that decision has trade-offs that must be considered. Yields on longer-term bonds are a far more prescriptive measure upon which to base future return expectations than are yields on shorter-term bonds, which often prove fleeting as interest rates change. Thus, it’s more likely that an investor in the Bloomberg Aggregate Bond index will experience a total return at least in line with the index’s current 5.3% yield over the next 7 to 10 years than it is that a holder of cash will experience a comparable rate of return, despite similar starting points for yields.
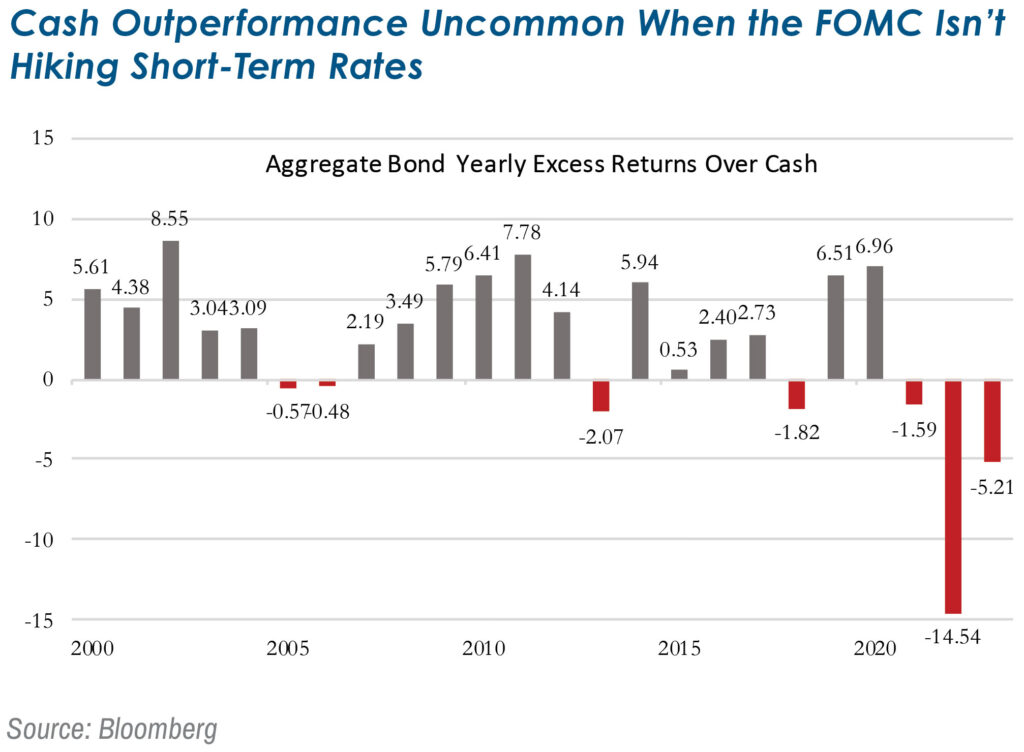
A vital consideration when holding cash is that investors are rarely compensated with a yield above inflation for holding risk-free assets, and while the current backdrop may seem like a “free lunch,” it isn’t likely to play out that way over coming quarters. As has been the case in past cycles when short-term yields were elevated, the Fed ultimately cuts when the economy weakens and/or inflationary pressures subside, and the market usually moves to price in that sequence of events early on, which is why peaks in long-term yields often occur prior to the first rate cut. If an investor waits for the first rate cut as a signal to buy longer-term bonds, they will almost certainly show up late to the party and likely miss out on a sizable gain as investors with deep pockets and long duration liabilities clamor to lock in higher rates before policy rates are cut and yields fall. The decision to hold cash in lieu of bonds in one’s investment portfolio is not to be taken lightly, even with cash yields over 5% at present, as investors must be willing to take on reinvestment risk with a potentially sizable opportunity cost to boot. An outsized cash position might make sense given an individual investor’s specific circumstances, spending needs, etc., but the pros and cons must be weighed and measured before going that route.
Carrying a portfolio duration that is too long versus one’s benchmark is preferable to being too short, as yields on long-term bonds will likely track short-term rates lower over the next year, but with longer duration bonds the total return benefit from such a move would be far more impressive. However, we don’t view duration management as a sustainable source of generating excess returns from fixed income, and very few active managers have proven to be consistently good at timing interest rate inflection points. This is why we recommend a portfolio duration profile in line with that of the Bloomberg Aggregate Bond index, relying instead on sector and security selection to drive excess return.
Highland Associates Cross Asset Views
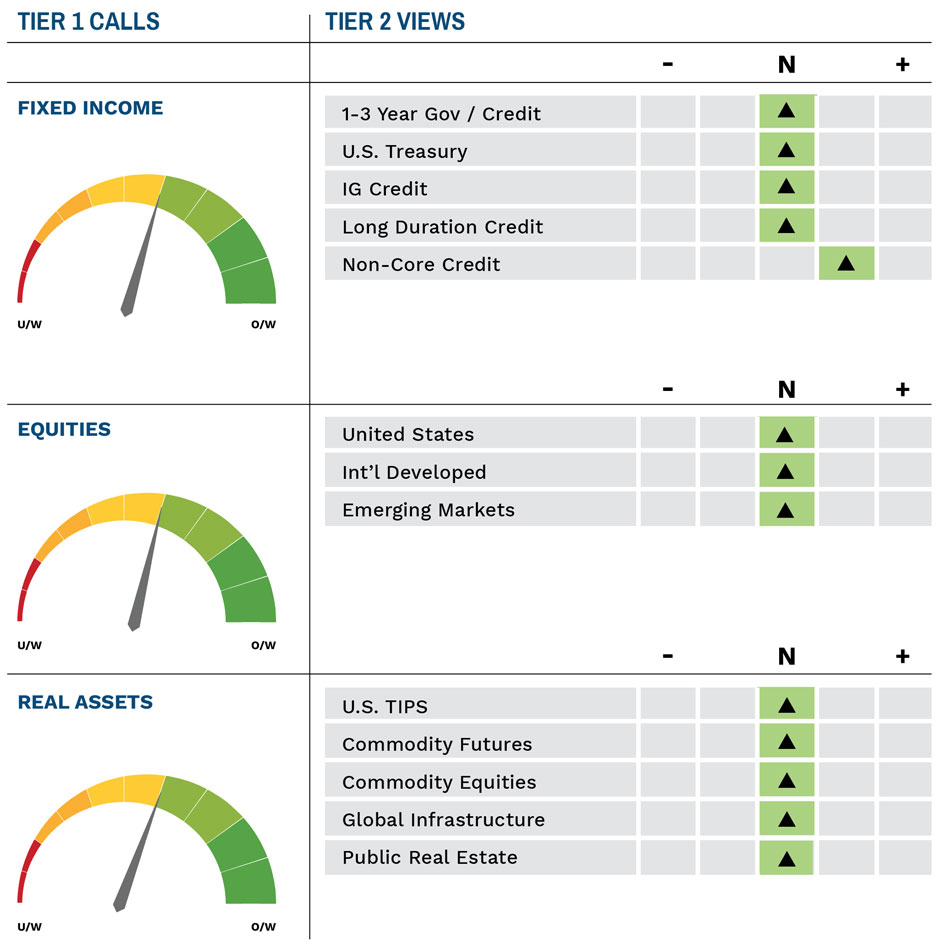
As of 11/13/2023
IMPORTANT DISCLOSURES: This publication has been prepared by the staff of Highland Associates, Inc. for distribution to, among others, Highland Associates, Inc. clients. Highland Associates is registered with the United States Security and Exchange Commission under the Investment Advisors Act of 1940. Highland Associates is a wholly owned subsidiary of Regions Bank, which in turn is a wholly owned subsidiary of Regions Financial Corporation. Research services are provided through Multi-Asset Solutions, a department of the Regions Asset Management business group within Regions Bank. The information and material contained herein is provided solely for general information purposes only. To the extent these materials reference Regions Bank data, such materials are not intended to be reflective or indicative of, and should not be relied upon as, the results of operations, financial conditions or performance of Regions Bank. Unless otherwise specifically stated, any views, opinions, analyses, estimates and strategies, as the case may be (“views”), expressed in this content are those of the respective authors and speakers named in those pieces and may differ from those of Regions Bank and/or other Regions Bank employees and affiliates. Views and estimates constitute our judgment as of the date of these materials, are often based on current market conditions, and are subject to change without notice. Any examples used are generic, hypothetical and for illustration purposes only. Any prices/quotes/statistics included have been obtained from sources believed to be reliable, but Highland Associates, Inc. does not warrant their completeness or accuracy. This information in no way constitutes research and should not be treated as such. The views expressed herein should not be construed as individual investment advice for any particular person or entity and are not intended as recommendations of particular securities, financial instruments, strategies or banking services for a particular person or entity. The names and marks of other companies or their services or products may be the trademarks of their owners and are used only to identify such companies or their services or products and not to indicate endorsement, sponsorship, or ownership by Regions or Highland Associates. Employees of Highland Associates, Inc., may have positions in securities or their derivatives that may be mentioned in this report. Additionally, Highland’s clients and companies affiliated with Highland Associates may hold positions in the mentioned companies in their portfolios or strategies. This material does not constitute an offer or an invitation by or on behalf of Highland Associates to any person or entity to buy or sell any security or financial instrument or engage in any banking service. Nothing in these materials constitutes investment, legal, accounting or tax advice. Non-deposit products including investments, securities, mutual funds, insurance products, crypto assets and annuities: Are Not FDIC-Insured I Are Not a Deposit I May Go Down in Value I Are Not Bank Guaranteed I Are Not Insured by Any Federal Government Agency I Are Not a Condition of Any Banking Activity.
Neither Regions Bank nor Regions Asset Management (collectively, “Regions”) are registered municipal advisors nor provide advice to municipal entities or obligated persons with respect to municipal financial products or the issuance of municipal securities (including regarding the structure, timing, terms and similar matters concerning municipal financial products or municipal securities issuances) or engage in the solicitation of municipal entities or obligated persons for such services. With respect to this presentation and any other information, materials or communications provided by Regions, (a) Regions is not recommending an action to any municipal entity or obligated person, (b) Regions is not acting as an advisor to any municipal entity or obligated person and does not owe a fiduciary duty pursuant to Section 15B of the Securities Exchange Act of 1934 to any municipal entity or obligated person with respect to such presentation, information, materials or communications, (c) Regions is acting for its own interests, and (d) you should discuss this presentation and any such other information, materials or communications with any and all internal and external advisors and experts that you deem appropriate before acting on this presentation or any such other information, materials or communications.
Source: Bloomberg Index Services Limited. BLOOMBERG® is a trademark and service mark of Bloomberg Finance L.P. and its affiliates (collectively “Bloomberg”). BARCLAYS® is a trademark and service mark of Barclays Bank Plc (collectively with its affiliates, “Barclays”), used under license. Bloomberg or Bloomberg’s licensors, including Barclays, own all proprietary rights in the Bloomberg Barclays Indices. Neither Bloomberg nor Barclays approves or endorses this material or guarantees the accuracy or completeness of any information herein, or makes any warranty, express or implied, as to the results to be obtained therefrom and, to the maximum extent allowed by law, neither shall have any liability or responsibility for injury or damages arising in connection therewith.