
Download Asset Allocation | May 2025
Stuck in the Middle with You
Economic Update
A rocky path and continued volatility
By Regions Economic Division
As global markets recover from April’s volatility, uncertainty casts a long shadow. The administration, still tending to the self-inflicted wounds of “Liberation Day,” has announced a pause on the most punitive tariffs on China and broadcasts new trade deals with other nations daily. Yet as U.S. indices swing from bear market territory to year-to-date gains, investors are wondering what it is I should do, as Stealers Wheel once sang. While headlines spark short-term rallies, broader macro expectations have remained darker since the year began.
Markets inch back toward all-time highs, but the foundation these gains are built upon looks increasingly fragile. Some deals stretch credulity when nations, such as Qatar, pledge to make U.S. purchases that rival their entire annual GDP. If proposed tariffs, even at stated floors, go back into effect, most expect a growth deceleration and renewed inflationary pressures. Economists got the feeling that something ain’t right with increased probabilities of recession and stagflation showing up in forecasts. With equity markets within reach of all-time highs, many companies have begun to pull earnings guidance. As optimism returns to markets, investors find themselves stuck in the middle. Is the worst over? Or has the end of the cycle just begun?
Many analysts and market participants have been on edge since the April 2 announcement of the “reciprocal” tariffs the U.S. would impose on its trading partners, which, as we noted last month, went beyond what many envisioned would be the worst-case outcome. The April 9 announcement that the most punitive of the tariffs announced on April 2 would be paused for 90 days to allow time for foreign nations to negotiate trade deals with the U.S. was greeted with a heavy sigh of relief. That relief was tempered by China not only being excluded from that pause but also facing a tariff rate of 145% on imports into the U.S., which, along with China retaliating by placing a tariff rate of 125% on imports from the U.S., has effectively frozen trade between the two nations.
Even if the most punitive of the tariffs announced on April 2 are avoided, it seems all but a given that tariff rates will be meaningfully higher than has been the case over the past several decades, as the “universal” tariff rate of 10% may be the new baseline rate onto which additional tariffs on specific products/nations may be layered. At the same time, there may be exceptions for specific products/industries that would lower effective tariff rates. In other words, the range of potential outcomes is unusually wide and, as we’ve seen, changes can come quickly and without notice, all of which leaves those who own or manage companies unsure of what kind of a world they should plan for. One manifestation of this is the number of companies that, even while reporting solid Q1 earnings, withdrew forward guidance on earnings. Many businesses have retreated into holding patterns, opting to defer decisions on capital spending and personnel.
This has also left many analysts and market participants at a loss as to where the economy may be heading. About as precise as we can be at this point is to say that there is an unusually wide range of potential economic outcomes. That said, even if the worst-case outcome is avoided, the near-term effects of higher tariff rates will be slower economic growth, higher prices, and upward pressure on the unemployment rate. Thus far, there are few clear signs of any of that in the economic data, but keep in mind that we are only now beginning to see the data for the month of April, and expectations are that data for subsequent months will show an economy, already slowing, sagging under the weight of higher tariffs.
There are places in the economic data in which the effects of higher tariffs, or the anticipation of higher tariffs, are visible. For instance, the first estimate from the U.S. Bureau of Economic Analysis (BEA) shows real GDP contracted at an annual rate of 0.3% in Q1 2025, which was actually a milder contraction than many had anticipated. Moreover, real private domestic demand – combined business and household spending adjusted for price changes – grew at an annual rate of 3.0% in Q1. We’d argue that the economy is neither as troubled as implied by the contraction in real GDP nor as robust as implied by the growth in real private domestic demand, but both metrics were heavily influenced by firms and households acting ahead of anticipated increases in tariffs.
The contraction in real GDP was more than entirely accounted for by a surge of imports – imports of goods grew at an annual rate of 50.9% in Q1 – which swamped modest growth in U.S. exports. The net result was a significantly wider U.S. trade deficit that knocked 4.83 percentage points off top-line real GDP growth, the largest deduction from trade in the history of the data. In short, manufacturers (inputs to production) and retailers (consumer goods) pulled orders of imported goods forward to avoid tariff-related price increases. Many of these imports went straight into inventories, and the significant build in inventories added 2.25 percentage points to top-line real GDP growth, which, by historical standards, is a notably large contribution from inventories.
At the same time, businesses stepped up purchases of computer and communications equipment in Q1, as reflected in annualized growth rates of 69.3% and 97.3%, respectively. These are two areas in which businesses pulled purchases forward in anticipation of higher tariffs. Although not apparent in the data for Q1 as a whole, consumers also pulled purchases forward, particularly purchases of consumer durable goods such as motor vehicles, appliances, furniture, and electronics. Spending on consumer durables rose at an annual rate of 3.2% in the month of March.
One caveat pertaining to the Q1 GDP data is that the build in business inventories, though substantial, seems smaller than would be consistent with the reported growth in imports. If we’re correct on that point, that will either be reflected in upward revisions to the Q1 inventory data or will be swept into the Q2 data. Either way, there will be payback for the sharp swings in imports and inventories reported in Q1, as well as for businesses and households pulling purchases forward. This will set up another stark dichotomy between real GDP and real private domestic demand in Q2, only with the former outperforming the latter next time around.
The April employment report contained mixed messages. Contrary to the hit from trade tensions many of us expected to see in the data, total nonfarm payrolls were reported to have risen by 177,000 jobs in April. At the same time, however, prior estimates of job growth for February and March were revised down by a net 58,000 jobs for the two-month period, more than negating the differential between expected and actual April job growth. We’ll also note that the not seasonally adjusted data show a smaller increase in nonfarm payrolls than is typical for the month of April, so the headline job growth was aided by friendly seasonal adjustment. That said, though the labor market has been cooling, it nonetheless remains resilient, and perhaps the most important indicator of that resilience is that the rate at which workers are being laid off remains below pre-pandemic norms. Moreover, the length of the average workweek has risen over the past two months, suggesting that firms may have indeed taken on more workers were it not for the uncertainty stemming from trade tensions.
One clear indication of the disruptions being caused by those trade tensions is that the ISM Manufacturing Index has slipped back below the 50.0% break between contraction and expansion. The ISM’s April survey shows significant softening of order books along with cuts in production and employment. Comments from survey respondents relayed by ISM indicate tariffs, and negotiations between firms and suppliers over how the burden of higher tariffs will be shared, are leading to delays in orders being placed and disrupting supply chains.
It is too soon for the impact of the higher tariffs already put in place to have turned up in measures of inflation on the consumer level, such as the Consumer Price Index or the PCE Deflator. We do, however, expect the effects to become visible once the April data are published and to become more visible in the data for subsequent months. While the likely result will be accelerating goods price inflation, it could be that faster deceleration in services price inflation, in part reflecting softening demand for discretionary services, will mitigate the effects on the overall inflation rate. While the Federal Open Market Committee (FOMC) would take some comfort if the increase in inflation stemming from higher tariffs is blunted, that this would reflect softening growth would give them pause, particularly if softening growth begins to push the unemployment rate higher.
As we write this, we are almost one-third of the way through the 90-day pause in the most punitive of the tariffs announced on April 2, and tariff rates between the U.S. and China remain prohibitively high. The path forward remains highly uncertain, and this is simply not an environment in which most firms are willing, let alone able, to make big decisions. If it is indeed true that sometimes the best thing to do is nothing, firms may remain in holding patterns for some time to come, which in and of itself would lead to a slowdown in economic growth. As such, the economic data over the next few months will likely continue to send mixed signals, and the financial markets will likely remain somewhat volatile.
Sources: U.S. Bureau of Economic Analysis; U.S. Bureau of Labor Statistics; Institute for Supply Management
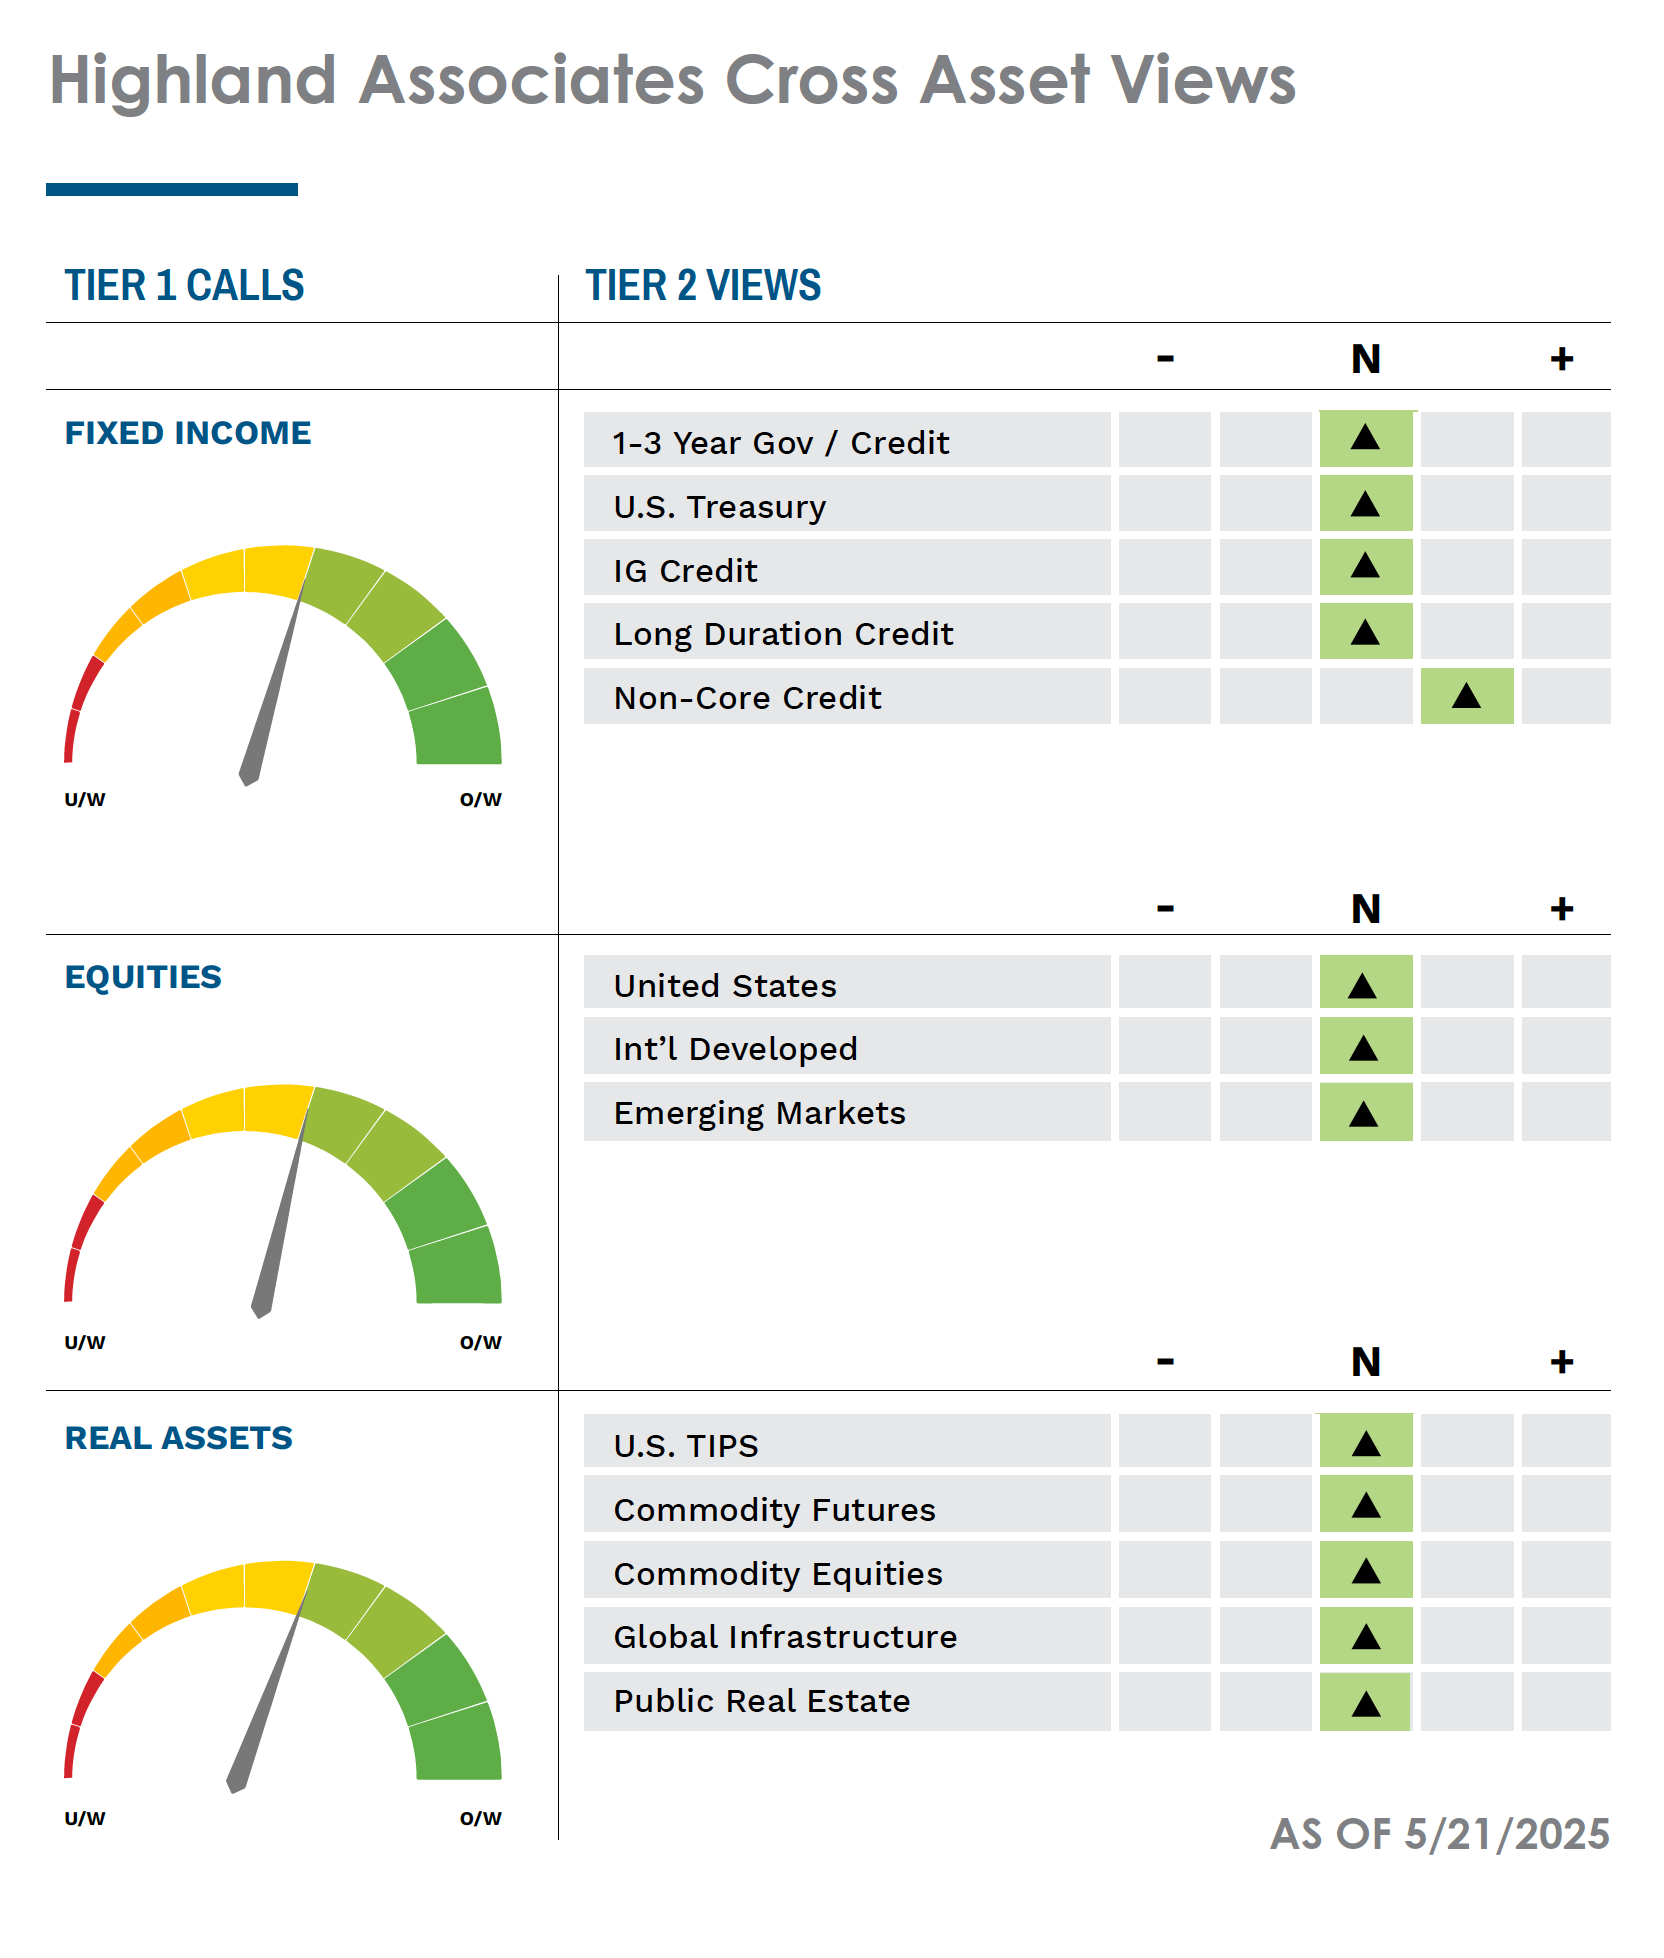
Investment Strategy Update
Regions Multi-Asset Solutions & Highland Associates
Bulls wrestle control away from the bears, for now. U.S. equities staged a comeback after the Trump administration announced a 90-day pause on “reciprocal” tariffs on April 9 to allow for time to negotiate with U.S. trading partners. After experiencing a rapid and unsettling 21% drop from an all-time high back on February 19, the S&P 500 found a bottom on April 7 and has since recouped the bulk of those losses and was down by less than 3% year-to-date as of May 2. After such a steep sell-off and equally impressive rebound, market volatility is a reasonable base case for May as investors digest the April rally and takeaways from earnings season, along with a seemingly endless stream of market-moving headlines surrounding how tariff/trade negotiations are going. There is plenty for both bulls and bears to latch onto to support their respective positions, and neither side is likely to cede ground to the other without a fight.
Those in the bearish camp can cite lofty valuations in the face of declining earnings estimates, overbought conditions with technical resistance just overhead, a stock rally based on the absence of bad tariff-related news, and the fact that economic pain has yet to be felt as reasons to believe the rebound is on borrowed time. The consensus estimates for S&P 500 earnings in 2025 moved lower in April and have now fallen to $265 from $273 at the start of the year. The $265 estimate still implies 7% earnings growth relative to 2024, down from more than 11% at the start of the year but a figure that will still be difficult to achieve should U.S. economic growth continue to slow. Notably, while 1Q25 estimates have moved higher as earnings have rolled in, estimates for 2Q, 3Q, and 4Q have each fallen by $2-$3, and with trade uncertainty continuing to dominate, additional downward revisions are likely.

Source: Bloomberg
From a technical perspective, the S&P 500 found itself in no-man’s-land in early May as the index traded above its 50-day moving average but below its 200-day moving average. While the 50-day moving average around 5,570 could provide a floor of support, the 200-day moving average of 5,745 is a level that could provide resistance on the upside as market participants often look to sell into strength in the run-up to key moving averages, particularly when overbought conditions are present. The 200-day moving average for the S&P 500 rests 2% below where the bellwether U.S. large-cap index started the year, and with the fear of regret often being a powerful driver of investor decision-making, getting “back to even,” or thereabouts, after the roller-coaster ride of the past four months may lead to some de-risking and lowering of equity allocations.
Lastly, investors cheered the pause on reciprocal tariffs on April 9 with the belief that the U.S. would start announcing agreements with its trading partners in short order. Deals have been slow to materialize, and even the agreement in principle with the U.K. announced on May 8 leaves a 10% “universal” tariff in place, and President Trump noted that a template of 10% is probably the lowest end of the tariff spectrum. Even after the deal with the U.K. was announced, market participants have very little to work with regarding the path forward for future deals and potential deal terms. It’s notable that the U.K. is one of the few countries with which the U.S. runs a trade surplus, making this the lowest of low-hanging fruit on the deal front. Deals with China, Japan, etc., will likely be more difficult to seal as the U.S. runs sizable trade deficits with these countries. Investors have so far been pacified by optimism that progress was being made. However, the longer deals are promised but not delivered, or if the terms fall short of the threshold for a U.S. win, the more likely investors are to ratchet lower expectations for the U.S. economy and the outlook for corporate profits. This may be the calm before the storm, and a flurry of deals could be announced to throw cold water on this narrative, but if deals are announced and turn into “buy the rumor, sell the news” events, bears could be emboldened to press downside bets.
For their part, the bulls will likely take comfort in the improvement in market breadth, sector leadership indicating improved risk appetite, and the market’s resilience in the face of tariff/trade uncertainty and disconcerting 1Q GDP data. At the end of April, more than 80% of S&P 500 constituents were trading above their 20-day moving average, which indicates powerful momentum behind the rebound. This is a good start, and a larger percentage of S&P 500 stocks trading above their longer-term moving averages would improve sentiment and call into question the view that the move higher in April is little more than a bear market rally likely to reverse course in the near-term. Should the S&P 500’s 200-day moving average, which the bears can cite as a key technical resistance level, give way, performance chasing could commence with hedge funds and trend-following strategies alike, increasing exposure to U.S. stocks.
Sector leadership behind the S&P 500’s April rebound is precisely what bulls would want to see as they try to wrestle control away from the bears. The information technology sector was the biggest winner from the April 7 bottom through month-end and was followed by materials, while communication services, consumer discretionary, and financials participated in the rally but performed roughly in line with the broader S&P 500. Conversely, defensive sectors that had outperformed in March and early April underperformed as consumer staples, healthcare, and utilities all lagged. The S&P 500’s leadership profile in the back half of the month is encouraging and evidence of improved risk appetite despite lackluster consumer sentiment readings stemming from continued tariff/trade uncertainty. All told, U.S. stocks have been surprisingly resilient up to this point, giving those positive on stocks reason to believe the rally can persist. But bears should be able to point toward a series of downbeat economic data points in the coming month(s) to support their position and test the willingness of bulls to continue to buy dips.
The U.S. dollar downtrend and positive earnings revisions remain tailwinds for international stocks. Valuations improved across foreign markets last month as international equities continued to under-promise and over-deliver. The MSCI ACWI-ex US index traded at 13.2 times forward earnings at month-end, down slightly from 13.4 times to start the year, despite an 8% year-to-date rally. From a geographic diversification perspective, international equities have played their diversification role well in the recent downturn, drawing down just 13.1% from their peak versus 21% for the S&P 500. After the dust settled, the MSCI ACWI-ex US index registered a 3.2% advance in April, with developed markets leading the charge as Australia, Germany, and Italy turned out gains of 5.3%, 6.5%, and 4.5%, respectively. The weakening of the U.S. Dollar Index (DXY) has played a role in the rebound abroad, as the DXY declined for the fourth consecutive month in April, notching its longest losing streak dating back to late 2022. There were signs the greenback was stabilizing and attempting to carve out a bottom in late April, but trade deals likely need to materialize soon for the dollar to stage any sort of a durable rally. When viewed through the lens of the U.S. dollar and currency market more broadly, there is reason to believe the four-month stretch of outperformance out of developed markets abroad could persist.
Emerging market currencies rallied versus the U.S. dollar last month as select economies outside of China were viewed as beneficiaries of the trade feud between Washington, D.C., and Beijing. Latin American equities were standout performers as cheap valuations in Mexico and Brazil drew in capital. The former rallied 12.6% in April as Mexico’s president announced the country would not retaliate against U.S. tariffs, leaving the door open for cooperation and a deal, while the latter gained 4.2% due to Brazil being insulated from tariffs and the potential to gain market share from U.S. exporters. Stronger emerging market currencies combined with a weaker dollar has historically been a favorable backdrop for the MSCI EM index, as dollar weakness lowers interest costs tied to U.S.-dollar-denominated debt and lowers commodity prices for emerging markets that are net importers of oil and industrial metals priced in USD. Prior to this year, the U.S. dollar last experienced significant downturns in 2017, 2020, and 2022. While emerging market stocks were hampered by higher U.S. rates in 2022, they outperformed domestic counterparts in the other two periods, with the 2017 parallel likely the closest fit to current state. A weak dollar backdrop, along with emerging markets expected to have the highest earnings growth of the four major equity sub-asset classes we cover, should entice investors, especially considering estimates have already been revised lower due to trade concerns.
Fixed income markets remain relatively unchanged. U.S. Treasuries rallied alongside stocks in the back half of April, with the Bloomberg Aggregate Bond index turning out a modest 0.4% monthly gain, outperforming the S&P 500’s -0.7% return in the process. The most sizable moves lower in yields took place in the belly of the curve between 2 and 7 years as tariff uncertainty and lackluster economic data led market participants to price in the prospect of more aggressive easing out of the FOMC, with Fed funds futures expecting 100 basis points of rate cuts between mid-July and mid-December. Bond investors have been placing bets that the FOMC will be forced to respond to weakness in the full employment component of its dual mandate in the coming months. However, while market participants have been eager to buy into the idea the U.S. economy is teetering on the brink of stagflation, they have so far chosen to focus on the “stag” while ignoring the “flation.” While we agree with the premise that slowing economic growth and weakness in the labor market will ultimately force the Fed’s hand in the back half of this year, with the preliminary 1Q GDP Price Index and Core PCE Price Index readings coming in at 3.7% and 3.5%, respectively, and nonfarm payrolls surprising to the upside in April, the FOMC likely won’t have the appetite to move as aggressively as market participants appear to expect in the near term.
We expect U.S. Treasuries to continue to play a valuable role as a volatility dampener in portfolios, but after the drop in yields in April, most tenors are again approaching fair value, thus leaving little downside for yields in the near term. However, upside for yields may also be limited as the Fed scales back quantitative tightening, thus increasing demand for Treasuries at the margin, evidenced by auction results in early May in which the Fed was an active buyer/participant. These crosscurrents lead us to expect Treasury yields to remain volatile, with buyers continuing to step in at key moving averages as they have in recent months. For the 10-year, specifically, we look to 4.15% on the low side and 4.50% on the high side as levels worth watching, as a breakdown could imply a recession is becoming the base case, and a break above that growth means concerns are being replaced by inflation fears. An active approach to investing in fixed income should be rewarded with managers capable of allocating portfolios across Treasuries, asset-backed securities, and investment-grade corporate bonds, while maintaining something close to a neutral duration profile should see opportunities in the coming months.
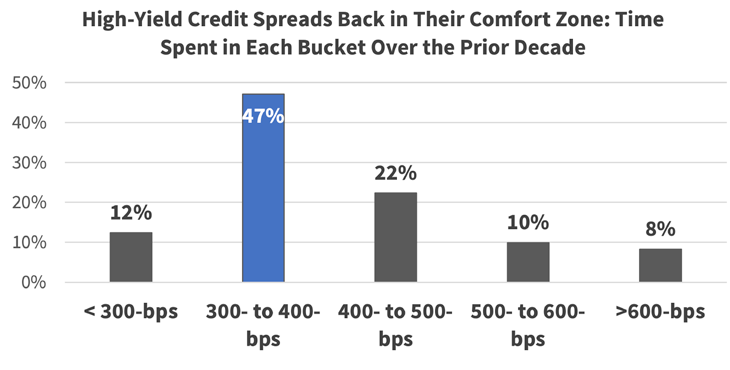
The case for below-investment-grade credit remains despite economic growth concerns. Credit markets endured one of the sharpest sell-offs of the past decade in April, with the option-adjusted spread on the Bloomberg U.S. Corporate High Yield index rising from a low of 334 basis points over the U.S. Treasury curve to a high of 453 basis points in just four trading days. The move wider in credit spreads/cheapening of valuations pulled the index down 3.75% from its March peak on a total return basis, as higher absolute yields did help mitigate drawdown. From a yield standpoint, the U.S. Corporate High Yield index made a new 52-week high during the month as it registered a yield-to-worst of 8.67%, a level last seen in late 2023. Tariff-driven unrest was evident in corporate credit as bond issuance in the lower-quality CCC segment ground to a halt mid-month, with April high-yield supply of just $8.6B in total, the lowest April volume on record according to Bloomberg. If the economic situation deteriorates meaningfully, there is a possibility that declining interest rates could offset some losses for high-yield bonds. Bank loans or floating rate structured credit may not be so insulated.
Source: Bloomberg
A lack of new issuance led to a surge in demand for existing issues and spreads compressed quickly as risk appetite returned after the 90-day tariff delay on reciprocal tariffs was instituted on April 9. The rally that ensued over the last three weeks of the month allowed the U.S. Corporate High Yield index to recoup losses and turn out a flat month. Cheaper valuations after the sell-off along with the velocity of the subsequent recovery in the asset class have us looking more favorably on credit markets after growing wary earlier this year as we felt valuations in the most expensive decile over the past decade didn’t adequately reflect risks. High-yield valuations are closer to fair in early May, with the credit or option-adjusted spread on the high-yield index at 384 basis points to start the month and the index yield-to-worst at 7.9%, both above their respective 10-year median. The blend of cheaper valuations and unwavering demand leads us to a favorable base case for credit over coming quarters, as investors are being well compensated to hold their ground in high yield. That said, active selection is vital, as more economically sensitive segments, particularly energy, could weaken further.
IMPORTANT DISCLOSURES: This publication has been prepared by the staff of Highland Associates, Inc. for distribution to, among others, Highland Associates, Inc. clients. Highland Associates is registered with the United States Security and Exchange Commission under the Investment Advisors Act of 1940. Highland Associates is a wholly owned subsidiary of Regions Bank, which in turn is a wholly owned subsidiary of Regions Financial Corporation. Research services are provided through Multi-Asset Solutions, a department of the Regions Asset Management business group within Regions Bank. The information and material contained herein is provided solely for general information purposes only. To the extent these materials reference Regions Bank data, such materials are not intended to be reflective or indicative of, and should not be relied upon as, the results of operations, financial conditions or performance of Regions Bank. Unless otherwise specifically stated, any views, opinions, analyses, estimates and strategies, as the case may be (“views”), expressed in this content are those of the respective authors and speakers named in those pieces and may differ from those of Regions Bank and/or other Regions Bank employees and affiliates. Views and estimates constitute our judgment as of the date of these materials, are often based on current market conditions, and are subject to change without notice. Any examples used are generic, hypothetical and for illustration purposes only. Any prices/quotes/statistics included have been obtained from sources believed to be reliable, but Highland Associates, Inc. does not warrant their completeness or accuracy. This information in no way constitutes research and should not be treated as such. The views expressed herein should not be construed as individual investment advice for any particular person or entity and are not intended as recommendations of particular securities, financial instruments, strategies or banking services for a particular person or entity. The names and marks of other companies or their services or products may be the trademarks of their owners and are used only to identify such companies or their services or products and not to indicate endorsement, sponsorship, or ownership by Regions or Highland Associates. Employees of Highland Associates, Inc., may have positions in securities or their derivatives that may be mentioned in this report. Additionally, Highland’s clients and companies affiliated with Highland Associates may hold positions in the mentioned companies in their portfolios or strategies. This material does not constitute an offer or an invitation by or on behalf of Highland Associates to any person or entity to buy or sell any security or financial instrument or engage in any banking service. Nothing in these materials constitutes investment, legal, accounting or tax advice. Non-deposit products including investments, securities, mutual funds, insurance products, crypto assets and annuities: Are Not FDIC-Insured I Are Not a Deposit I May Go Down in Value I Are Not Bank Guaranteed I Are Not Insured by Any Federal Government Agency I Are Not a Condition of Any Banking Activity.
Neither Regions Bank nor Regions Asset Management (collectively, “Regions”) are registered municipal advisors nor provide advice to municipal entities or obligated persons with respect to municipal financial products or the issuance of municipal securities (including regarding the structure, timing, terms and similar matters concerning municipal financial products or municipal securities issuances) or engage in the solicitation of municipal entities or obligated persons for such services. With respect to this presentation and any other information, materials or communications provided by Regions, (a) Regions is not recommending an action to any municipal entity or obligated person, (b) Regions is not acting as an advisor to any municipal entity or obligated person and does not owe a fiduciary duty pursuant to Section 15B of the Securities Exchange Act of 1934 to any municipal entity or obligated person with respect to such presentation, information, materials or communications, (c) Regions is acting for its own interests, and (d) you should discuss this presentation and any such other information, materials or communications with any and all internal and external advisors and experts that you deem appropriate before acting on this presentation or any such other information, materials or communications.
Source: Bloomberg Index Services Limited. BLOOMBERG® is a trademark and service mark of Bloomberg Finance L.P. and its affiliates (collectively “Bloomberg”). BARCLAYS® is a trademark and service mark of Barclays Bank Plc (collectively with its affiliates, “Barclays”), used under license. Bloomberg or Bloomberg’s licensors, including Barclays, own all proprietary rights in the Bloomberg Barclays Indices. Neither Bloomberg nor Barclays approves or endorses this material or guarantees the accuracy or completeness of any information herein, or makes any warranty, express or implied, as to the results to be obtained therefrom and, to the maximum extent allowed by law, neither shall have any liability or responsibility for injury or damages arising in connection therewith.