
Download Asset Allocation | May 2024
Summer Breeze
Economic Update
Growth Data (Seems To) Take a Softer Tone
By Regions Economic Division
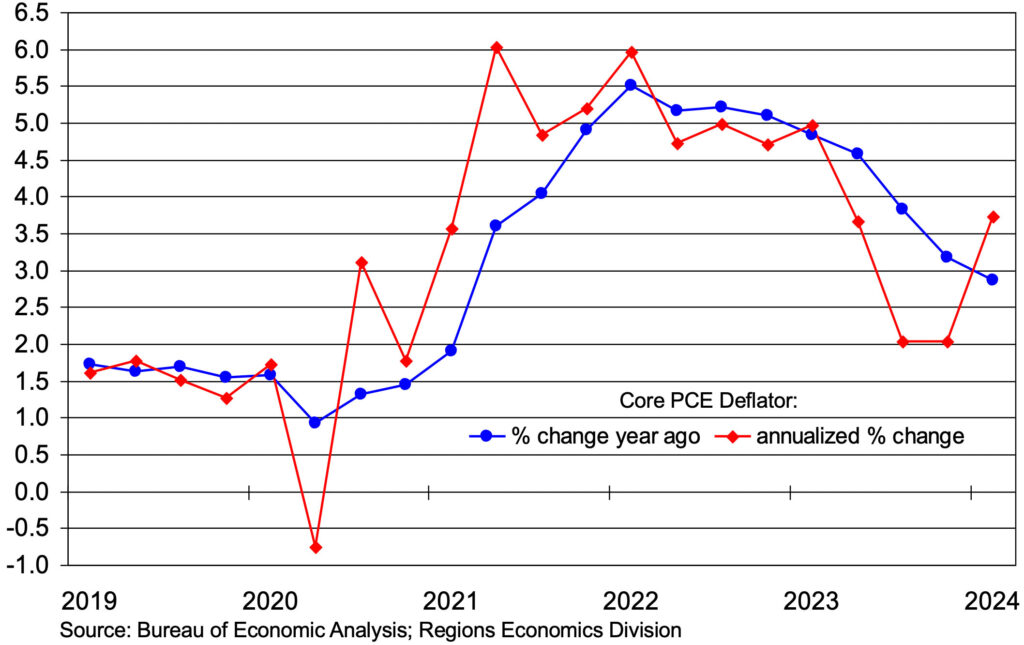
The initial estimate from the Bureau of Economic Analysis (BEA) showed real GDP growth of 1.6% in Q1, well below expectations of growth closer to 3.0%. At the same time, the price data in the GDP report showed the core PCE Deflator, the gauge of inflation followed most closely by the FOMC, rose at an annualized rate of 3.7% in Q1. Suffice it to say that the day on which the report on Q1 GDP was released was not a particularly good day in the markets, with equity prices down sharply and yields on fixed-income securities shooting higher. The growth details of the report were seen as negative for equities, while the inflation details fed into the narrative that the FOMC would be on hold for longer, perhaps much longer, than many market participants had previously anticipated. On the whole, the report on Q1 GDP triggered fears that the U.S. economy was doomed to a period of stagflation, i.e., stagnant growth and high inflation.
It will come as no surprise to our regular readers that our reaction to the report on Q1 GDP was, let’s say, a bit more tempered. It is often the case that inventories and trade, the two most inherently volatile components of GDP, team up to impact GDP growth in a manner at odds with underlying economic conditions, which we believe to be the case with the Q1 data. A slower pace of inventory accumulation in the nonfarm business sector and a sharply wider trade deficit combined to knock 1.2% off Q1 real GDP growth. In contrast, real private domestic demand, or, combined household and business spending adjusted for inflation, grew at an annual rate of 3.1% in Q1, a third straight quarter of growth at or above 3.0%.
Nonfarm business inventories increased in Q1, but that they did so at a slower pace than in Q4 as 2023 acted as a drag on Q1 real GDP growth. It is, however, difficult to draw any firm conclusions as to what the pace of inventory accumulation says about the broader economy given that the severe distortions to both production and sales wrought by the pandemic and the policy response to it have yet to fully resolve. Under GDP accounting conventions, a wider trade deficit acts as a deduction from real GDP growth. What is almost always overlooked, however, is that in any given quarter roughly one-half of all goods imported into the U.S. are either raw materials, intermediate goods, or capital goods used by firms in the U.S. to produce final goods and, as such, are supportive of future growth. The GDP math notwithstanding, it’s hard to make a plausible case that this is a negative for the U.S. economy.
We always, for better or worse, place far more emphasis on patterns in real private domestic demand than on patterns in real GDP to help us assess the state of the economy. As such, we’d be much more concerned about the state of the economy had the miss on Q1 real GDP growth been caused by shortfalls in the business and residential fixed investment components of private domestic demand, each of which was a bit stronger in Q1 than we expected. That said, the GDP data are backward looking given that they come with a lag, and thus far the initial data releases for the month of April have been on the soft side.
For instance, the Institute for Supply Management’s (ISM) Manufacturing Index and Non-Manufacturing Index each slipped below the 50.0% breakeven line between contraction and expansion in April. As we often point out, however, the manner in which the ISM’s diffusion indexes are calculated can lead to the headline index being out of alignment with the firm-level and industry-level details of the data. We believe this to be the case with the April data. The ISM’s surveys query firms on whether metrics such as output, employment, and new orders increased, decreased, or stayed the same compared to the prior month. Aside from seismic events, say, a global financial crisis or a global pandemic, clear majorities of firms report no change in these metrics from one month to the next. So, just as life happens on the margins (economist humor!), so too do the changes in the ISM’s diffusion indexes. For instance, in the April survey of the manufacturing sector, sixty-three percent of firms reported no change in orders from March, and while more of the remaining firms said orders rose than said orders fell, that gap was smaller than was the case in March, yielding a decline in the new order index that, in turn, weighed on the headline index.
We go into this detail here not only to help explain how we routinely process the economic data but to also illustrate a point we often make, which is that for any given data release, the details are more important than the headline numbers. The April employment report is another illustration of that point. Total nonfarm payrolls rose by 175,000 jobs in April, well short of expectations. Additionally, average hourly earnings rose by just 0.2%, yielding a year-on-year increase of 3.9%, the smallest such increase since June 2021, while the unemployment rate rose to 3.9%. The April employment report was roundly cheered by market participants, as the appearance of softening labor market conditions inspired hope that the FOMC would be free to start cutting the Fed funds rate this year after all, in stark contrast to the mood in the markets in the wake of the Q1 GDP report.
In keeping with our theme here, appearances can be, and often are, deceiving. While we’ve for months pointed to signs of a cooling labor market, we think the April employment report meaningfully overstates the degree to which that is the case. The main culprit, at least in our view, is the calendar. Specifically, the survey period for the Bureau of Labor Statistics’ (BLS) April establishment survey ended prior to the middle of the month, which historically has held down response rates to the establishment survey and biased estimates of nonfarm employment, hours, and earnings lower. The initial response rate to the April establishment survey was the third lowest since the onset of the pandemic, and the increase in nonfarm employment shown in the not seasonally adjusted data was much smaller than the typical April increase, meaning the estimate of seasonally adjusted job growth was biased lower. That, in turn, flowed through to estimates of hours worked and average hourly earnings.
So, while the headlines on the data releases for the month of April seen to date suggest a marked slowing in the pace of economic activity, the details of the various releases don’t necessarily back that up. Time will tell whether our take is way off base or on the mark. But, even if the pace of growth is slowing, the FOMC won’t be moved, nor will the Fed funds rate, unless and until the inflation data tell the same story. Circling back to the ISM’s April surveys, in both the manufacturing and services sector there was further evidence of broadly based upward pressure on prices for non-labor inputs, which in and of itself is at odds with the narrative of slowing growth, let alone contraction.
While we think a large part of the market’s dismay over the price data in the report on Q1 GDP is the manner in which the data are presented, i.e., annualized rates of change from the prior quarter which, in the case of the core PCE Deflator, we think overstates the case. To be sure, the monthly data show progress in pushing inflation lower has stalled, and the year-on-year increase of 2.8% in Q1 is too high for the FOMC’s comfort. In that sense, while the markets’ collective hopes seem to rise and fall with each individual data release, we don’t think the data for the month of April seen thus far have changed the thinking within the FOMC one bit, leaving the Committee a long way from seriously considering Fed funds rate cuts.
Neither Is Good, But Which Is The More Reliable Guide?
Investment Strategy Update
Stocks: Potential Tailwinds Building into the Summer
Regions Multi-Asset Solutions & Highland Associates
On the heels of the FOMC’s meeting in early May, both stocks and bonds rallied as Chair Jerome Powell talked down the possibility of the Committee’s next move being a hike, but what really provided a jolt for the bulls was the FOMC’s decision to taper the pace of balance sheet runoff, or quantitative tightening. Starting in June, $25B per month of Treasury bonds will be allowed to roll off the Fed’s balance sheet, down from the current pace of $60B per month. This implies the FOMC will be buying $105B more in U.S. Treasury issuance starting in the third quarter than it otherwise would have. This announcement put significant downward pressure on U.S. Treasury yields as the market interpreted this move as the ‘Fed put’ being alive and well. The Fed’s balance sheet shrinking at a more gradual pace beginning in 3Q24 is a positive from a liquidity perspective, as is the U.S. Treasury’s decision to focus the lion’s share of issuance in short-term bills as opposed to notes or bonds. These two variables combined are expected to boost liquidity on a net basis by between $250B and $300B between now and the end of the third quarter.
Bonds: Credit Risk Still Preferable to Interest Rate Risk
April was a reminder that credit is still king when inflation concerns are top of mind for investors. While the investment grade (IG) only Bloomberg Corporate Bond index declined 2.5%, the Bloomberg U.S. Corporate High Yield index fell 0.9% during the month, a performance difference driven primarily by the IG corporate index’s greater sensitivity (longer duration) to rising interest rates. With yields on long-term Treasury bonds moving sharply higher into the back-half of April, both longer duration Treasuries and investment grade corporates were beginning to look more attractively priced as investors were appropriately compensated for taking interest rate risk. However, much of that rise in yields has now reversed, and investment grade bonds, broadly speaking, now appear fairly valued.
The Bloomberg U.S. Corporate High Yield index boasts a 7.8% yield-to-worst, down modestly from its peak of 8.3% in mid-April, but well below 9.5% reached at the end of last October. With credit spreads extremely tight relative to historical levels, we can’t characterize high yield as a slam dunk at this point. But given our view that the U.S. economy will remain resilient, and defaults low throughout the balance of the year, we remain constructive on the sector. With that said, lofty valuations for lower quality corporate bonds continue to suggest a selective, active approach to credit is warranted.
Navigating Potential Landmines in Private Real Estate
While Industrial and Multifamily assets have at times been relative bright spots in this recent downturn, we are watching supply data closely as significant new developments reach completion over the next twelve months. According to Apartments.com, 9 of the 10 cities with the highest Multifamily vacancy rates are in the Sunbelt region, which is where the highest number of new property deliveries is expected to take place. Average vacancy rates in these ten cities are 11%.
The sources of permanent financing for Multifamily assets typically originate from Fannie Mae and Freddie Mac, Life insurance companies, banks, and CMBS. Occupancy levels must remain above 90% to obtain and maintain permanent financing from Fannie Mae and Freddie Mac. Life insurance companies, banks, and CMBS typically have an occupancy requirement of 85% to obtain and maintain permanent financing. With vacancy rates at or above these levels in many cities, financing is one risk we are watching closely.
Like Multifamily, new supply within the Industrial sector could also continue to put downward pressure on rents and upward pressure on vacancy rates. The good news for Industrial is that at the peak, demand vacancy rates were 2% and are now closer to 5%. Expectations today are that new supply will increase the vacancy rate to roughly 6.5%, which is slightly below the long-term average. New construction starts is below the 10-year average making the likelihood of vacancy rates climbing significantly less probable and less of a threat to a supply imbalance.
Development projects utilize construction financing and value-add projects typically utilize bridge financing, which are typically both floating rate, making both financing options susceptible to interest rate risk. Once a project is complete, the owner either sells the property to a new owner who finances the property with a new loan, typically a permanent loan, or refinances the property with a permanent loan. Typically, lenders require borrowers to buy interest rate caps, per the debt covenants, which caps the interest rate once the floating rate reaches a specific level. As interest rates rise, the cost of an interest rate cap increases which increases the cost of financing, eroding profits on a project assuming all things equal. The average term for an interest rate cap is 2-3 years, making it difficult for borrowers when the project is extended. Many interest rate caps or other types of interest rate hedges will be expiring in the next 12 months which could be costly for the borrowers if they are unable to refinance the loan to fixed rate debt or sell the property. With new supply entering the market, it could be difficult for the properties to get fully leased up, which could force the borrower to extend the debt and purchase another interest rate cap or another type of interest rate hedge, all of which will be expensive.
Private real estate funds, both drawdown and evergreen structure, are having to create liquidity for investors, leading many funds to sell interests in high quality assets at an inopportune time. We are having discussions with some funds about purchasing shares at discounts to NAV, as contractual liquidity promises create forced selling. This is an attractive proposition for patient, long-term investors, as discounts create another source of return and cushion against potential future volatility. In this environment, we are favoring funds that are positioned well from an asset class perspective (i.e., little to no Office) and are starting to build cash reserves to deploy at the right time. If we can buy interests in these funds at a discount, even better.
Fundraising Struggles in Private Equity
A lot has been made of recent fundraising struggles in the private markets, where fundraising and activity remain materially below record levels seen in 2021 and 2022. According to PitchBook’s 2023 Global Private Market Fundraising Report, total private market fundraising in 2023 was $1.17T, the lowest amount raised since 2016. This represents a 20.5% decline versus 2022 levels, a more than 30% decline when compared to 2021’s record fundraising levels, and an 18% decline compared to the trailing five-year average. A deeper look at the data reveals that this fundraising pain has not been felt equally, with noticeable differences seen within asset classes, sizes, and geographies. Private Equity was down only 1.1% YoY and flat against its five-year average whereas Venture Capital saw a 47.3% YOY decline and 41% dip against its five-year fundraising average. From a geographic point of view, North America saw a 20% YoY dip in fundraising while Europe and Asia dropped by over 40% and 60%, respectively. Interestingly when looking at size there is a clear outlier, funds between $250MM-$1B saw a 31.3% dip in total funds raised in 2023 when compared to their five-year average, funds $1-5B saw a 24.6% decrease. But funds $5B+ saw a 5% increase, and have grown every year since 2020, while every other size bucket has decreased each year.
These figures are representative of closed end draw down funds only and do not take into consideration the impact of the recent surge in evergreen vehicles. Evergreen vehicles have become more popular in recent years. The Evergreen/closed end fund ratio across all private markets was approximately 8% as of year-end 2023, though these vehicles are heavily skewed to Real Assets and Real Estate where the ratio is 16.9% and 37.2%, respectively. Across Private Equity, Debt and Venture Capital which account for over 84% of all private capital they are a low single digit percentage. With that in mind the rise of evergreen vehicles is not responsible for the slowdown in closed end drawdown fundraising though they could pose a longer- term challenge to traditional private capital vehicles.
If not the rise of evergreens, then what is to blame for the eroding and changing fundraising environment? There are numerous factors at play driving the decline and shift we have seen in recent years. Some are macroeconomic such as higher interest rates, some LP specific and others a feature of how private markets operate. Notably high dry powder and low distributed capital. While funds are raised in a given vintage year, they are often called and deployed over the course of several years, during what is known as a fund’s investment period. Dry Powder, which is uninvested committed capital, sits at $3.9T as of 06/30/2023, matching the record high set at year end 2022. This overhang is driven by several factors including, the hyperactive fundraising cycles of the early 2020s, since 2019 the median step fund in fund size from the previous fund for a General Partner has been 40.8%, meaningfully above the 25.5% average seen from 2009-2019. The average fund in 2023 was 40% larger than in 2022 and 57% larger than in 2020, this has been driven mainly by the proliferation of funds larger than $5B. These funds account for 1.6% of all funds by fund count, double what they did in 2020, and nearly 40% of all private capital raised in 2023, up from 24.9% in 2020 and 20.3% in 2016. If you add in funds between $1-5B, which account for 7.6% of all private capital funds raised in 2023 and 31.7% of all capital raised you have in effect 9% of the funds raising 71% of the capital.
This rapid increase in fund size has coincided with a shortening fundraising life cycle. In a PitchBook Research Center study as of June 2023 it was noted that a decade ago the median time between funds in a fund family was 3.3 years, that number dropped all the way to 2.2 years by mid-2022. This environment of rapidly increasing fund sizes and fund raises has produced negative net cash flows for LPs every year since 2018. Meaning the private allocations have outpaced distributions. Simply put funds are raising more capital than they can invest. This has left many LP’s unable or unwilling to commit more capital without seeing realizations and distributions increase.
These upper market and mega funds are disproportionately responsible for the dry powder and negative cash flows. Since 2020 $1B+ funds accounted for 64% of all capital raised but currently are responsible for 69% of outstanding Dry Powder. Meanwhile Lower Middle Market focused funds, which are where we have for some time seen the most value, sized $250MM-$1B have accounted for 23% of capital raised but only 21% of dry powder. While these may seem like small differences it translates to tens of billions of dollars and illustrates that the lower ends of the market have continued to operate more smoothly than the larger end has. We remain convicted that smaller funds, investing in the lower middle market is the most attractive segment.
As of 05/13/2024
IMPORTANT DISCLOSURES: This publication has been prepared by the staff of Highland Associates, Inc. for distribution to, among others, Highland Associates, Inc. clients. Highland Associates is registered with the United States Security and Exchange Commission under the Investment Advisors Act of 1940. Highland Associates is a wholly owned subsidiary of Regions Bank, which in turn is a wholly owned subsidiary of Regions Financial Corporation. Research services are provided through Multi-Asset Solutions, a department of the Regions Asset Management business group within Regions Bank. The information and material contained herein is provided solely for general information purposes only. To the extent these materials reference Regions Bank data, such materials are not intended to be reflective or indicative of, and should not be relied upon as, the results of operations, financial conditions or performance of Regions Bank. Unless otherwise specifically stated, any views, opinions, analyses, estimates and strategies, as the case may be (“views”), expressed in this content are those of the respective authors and speakers named in those pieces and may differ from those of Regions Bank and/or other Regions Bank employees and affiliates. Views and estimates constitute our judgment as of the date of these materials, are often based on current market conditions, and are subject to change without notice. Any examples used are generic, hypothetical and for illustration purposes only. Any prices/quotes/statistics included have been obtained from sources believed to be reliable, but Highland Associates, Inc. does not warrant their completeness or accuracy. This information in no way constitutes research and should not be treated as such. The views expressed herein should not be construed as individual investment advice for any particular person or entity and are not intended as recommendations of particular securities, financial instruments, strategies or banking services for a particular person or entity. The names and marks of other companies or their services or products may be the trademarks of their owners and are used only to identify such companies or their services or products and not to indicate endorsement, sponsorship, or ownership by Regions or Highland Associates. Employees of Highland Associates, Inc., may have positions in securities or their derivatives that may be mentioned in this report. Additionally, Highland’s clients and companies affiliated with Highland Associates may hold positions in the mentioned companies in their portfolios or strategies. This material does not constitute an offer or an invitation by or on behalf of Highland Associates to any person or entity to buy or sell any security or financial instrument or engage in any banking service. Nothing in these materials constitutes investment, legal, accounting or tax advice. Non-deposit products including investments, securities, mutual funds, insurance products, crypto assets and annuities: Are Not FDIC-Insured I Are Not a Deposit I May Go Down in Value I Are Not Bank Guaranteed I Are Not Insured by Any Federal Government Agency I Are Not a Condition of Any Banking Activity.
Neither Regions Bank nor Regions Asset Management (collectively, “Regions”) are registered municipal advisors nor provide advice to municipal entities or obligated persons with respect to municipal financial products or the issuance of municipal securities (including regarding the structure, timing, terms and similar matters concerning municipal financial products or municipal securities issuances) or engage in the solicitation of municipal entities or obligated persons for such services. With respect to this presentation and any other information, materials or communications provided by Regions, (a) Regions is not recommending an action to any municipal entity or obligated person, (b) Regions is not acting as an advisor to any municipal entity or obligated person and does not owe a fiduciary duty pursuant to Section 15B of the Securities Exchange Act of 1934 to any municipal entity or obligated person with respect to such presentation, information, materials or communications, (c) Regions is acting for its own interests, and (d) you should discuss this presentation and any such other information, materials or communications with any and all internal and external advisors and experts that you deem appropriate before acting on this presentation or any such other information, materials or communications.
Source: Bloomberg Index Services Limited. BLOOMBERG® is a trademark and service mark of Bloomberg Finance L.P. and its affiliates (collectively “Bloomberg”). BARCLAYS® is a trademark and service mark of Barclays Bank Plc (collectively with its affiliates, “Barclays”), used under license. Bloomberg or Bloomberg’s licensors, including Barclays, own all proprietary rights in the Bloomberg Barclays Indices. Neither Bloomberg nor Barclays approves or endorses this material or guarantees the accuracy or completeness of any information herein, or makes any warranty, express or implied, as to the results to be obtained therefrom and, to the maximum extent allowed by law, neither shall have any liability or responsibility for injury or damages arising in connection therewith.