
Download Asset Allocation | May 2022
After reviewing the economic and market environment, Highland offers the following comments on the current landscape:
Economic Update
No, it actually isn’t—“it” being the start of the recession that many have deemed inevitable. As we noted last month, Q1 2022 GDP was destined for weakness, at least under GDP accounting conventions, with inventories and net exports teaming up to, well, do a number on real GDP growth. In an environment in which nerves were already on edge, a weak headline print on the report on Q1 GDP was bound to play right into those fears. As it turns out, that headline print was even weaker than expected, with real GDP reported to have contracted at an annualized rate of 1.4%. Those already predisposed to do so took that headline print and ran with it, advancing their narrative of an all but inevitable recession. The rest of us, however, found little to fret over in the report on Q1 GDP, the 8.0% annualized increase in the GDP Price Index being a glaring exception. In short, the contraction in real GDP in Q1 said more about GDP accounting than it did about the underlying health of the economy.
For instance, on an annualized basis, inflation-adjusted nonfarm business inventories increased by $185.3 billion in Q1. While that was a larger inventory build than we anticipated, it actually took 0.75 percentage points off the quarterly change in real GDP. Under GDP accounting conventions, the change in inventories from one quarter to the next enters into the calculation of the level of GDP, but it is the change in the change in inventories that matters in the calculation of the rate of change in GDP. As such, since the increase in nonfarm business inventories in Q1 was smaller than the annualized increase of $212.8 billion in Q4 2021, inventories went down as a deduction from the quarterly change in real GDP in Q1.
The hit from trade was even larger, with a substantially wider trade deficit deducting 3.20 percentage points from the quarterly change in real GDP in Q1. Global trade flows have been significantly distorted by supply chain and logistics constraints since the onset of the pandemic, which has wreaked havoc on the timing of exports and imports being booked. More fundamentally, the wider trade deficit reflects the U.S. economy being further along in its expansion than most of its foreign counterparts.
Though they combined to knock 3.95 percentage points off the quarterly change in real GDP in Q1, neither the smaller inventory build nor the wider trade deficit says anything meaningful about the underlying health of the U.S. economy. To us, the story isn’t that the build in nonfarm business inventories was smaller in Q1 2022 than in Q4 2021, but rather that, despite persistent supply chain and logistics bottlenecks, we’ve seen two straight quarters of rapid growth in business inventories. As for the wider trade deficit, one thing that largely escapes notice is that just over half of imports into the U.S. are either raw materials, intermediate goods, or capital equipment used by firms located in the U.S. to produce final goods. Under GDP accounting conventions, however, these imports are treated as a deduction from GDP while in reality they are a complement to domestic production.
Largely overlooked in the Q1 GDP data was that combined household and business spending grew at an annual rate of 3.7% after adjusting for inflation. Real business fixed investment rose at an annual rate of 9.2%, powered higher by outlays on equipment, machinery, and intellectual property products (research and development and software). Business investment should remain a key support for real GDP growth, driven by replacement investment, investment in automation and technology, and continued strong spending on intellectual property products. Keep in mind that, in addition to supporting contemporary real GDP growth, business investment lays the foundation for faster longer-term growth by expanding the economy’s productive capacity.
Saying the headline print on the report on Q1 real GDP is misleadingly weak is not the same as saying all is well with the U.S. economy. As measured by the Consumer Price Index, inflation hit 8.5% in March and 8.3% in April. While the labor market remains solid, with another 428,000 nonfarm jobs added in April, labor supply constraints remain a hindrance to even stronger job growth while fueling rapid wage growth, some portion of which is being passed along by firms in the form of higher output prices. As for non-labor inputs, the Institute for Supply Management’s monthly surveys of the manufacturing and services sectors show input price pressures remain intense. At the same time, the latest round of shutdowns in China has further disrupted global supply chains, which could mean that goods price inflation will be higher and more persistent than had been anticipated. Finally, higher mortgage interest rates pose a threat to single family construction and sales, particularly in conjunction with the lofty pace of house price appreciation over the past several quarters.
Against the backdrop of elevated inflation and notably tight labor market conditions, the FOMC raised the Fed funds rate by 50 basis points at their May meeting, and in his post-meeting press conference, Federal Reserve Chairman Powell stated that likesized hikes will be “on the table for the next couple of meetings.” At the same time, Chairman Powell noted that 75-basis-point hikes are “not something the committee is actively considering,” which, while not ruling out such moves, does set the bar for them considerably higher. Rather than taking comfort from this, market participants seem concerned that the FOMC may not be moving fast enough to get back to a more neutral policy stance.
Lurking as a wild card in the discussion of how far the FOMC will go in the current cycle, and how fast they will get there, is the Fed’s balance sheet. At the conclusion of their May meeting, the FOMC announced the Fed’s balance sheet will begin winding down on June 1, at a rate of $47.5 billion for the first three months and at a monthly rate of $95.0 billion thereafter. While the FOMC may hope that the balance sheet winding down will be little more than “background noise,” the reality could be less benign. Running down the Fed’s balance sheet could put upward pressure on interest rates and could add another degree of volatility in already volatile fixed income markets. To the extent either, let alone both, prove to be the case, the real economy will not be immune from the fallout.
Sources: Regions Economic Division; Bureau of Economic Analysis; Bureau of Labor Statistics; Institute for Supply Management
Investment Strategy Update
As we’ve written about in recent months, the fundamental and market-based data we most closely monitor as part of our Highland Diffusion Index framework are turning mixed as the Russia-Ukraine war, China’s zero-COVID policy, and changes in Federal Reserve policy impact each in different ways. Specifically, market measures like credit spreads, momentum, and sentiment-driven factors are currently signaling far more weakness than what is being observed in economic and employment data. Q1 marked just the third time ever, and the first time in more than 40 years, that the S&P 500 and the Barclays Aggregate declined at least 3% in a single quarter. The common culprit for both is interest rates, with higher, longer-duration growth equities bearing the brunt of the pain. Capital markets are recognizing a change in many regimes – including interest rates, inflation, and geopolitical – and volatility is likely to remain heightened until the current uncertainty and wide range of outcomes is resolved with some level of confidence.
We understand how uncomfortable market corrections can be for investors. But it’s helpful to remember that intra-year declines are quite normal. In each case, equity markets were set up for attractive returns going forward. Staying invested can significantly boost long term returns.
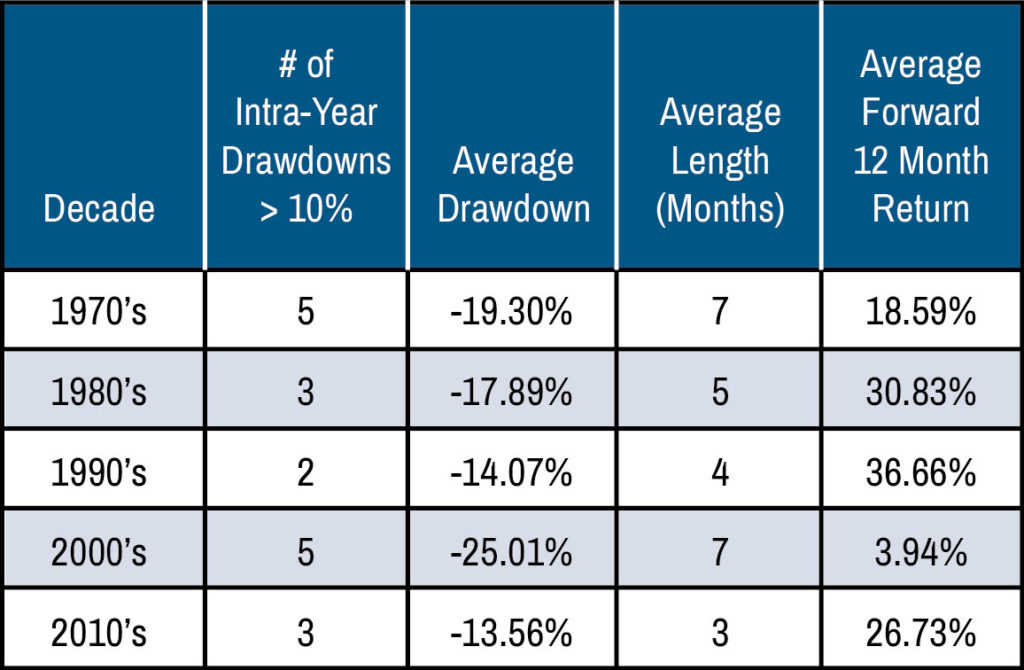
Sources: Bloomberg
Investors’ most recent experience was in March of 2020, where the equity markets declined -19.6% and posted a forward 12M return of 56.35%.
Importantly, remaining invested does not mean investors can’t be tactical. We’ve discussed many of our favored asset classes in recent Asset Allocation Notes. These include commodities and natural resource equities, real estate, U.S. value equities, and alternative fixed income assets. All of these have held up well year-to-date and in many cases are positive. Highland will continue to closely monitor changes to the outlook and position portfolios accordingly.
Fixed Income Update
Traditionally, bonds have served the role as a safe-haven asset class, protecting investors during periods of equity market volatility. This has not been the case so far in 2022. The Bloomberg U.S. Aggregate Index is down nearly 10% through April as rate hikes and inflation concerns take their toll. With only four negative calendar years since 1980, this is a big move.
In recent years Highland has recommended clients maintain allocations to traditional fixed income assets at their lowest bound and seek alternatives. With yields at historical lows and the threat of rising rates leading to negative returns at some point (bond yield and bond prices move in opposite directions), we sought assets that could provide higher total returns but also serve a safe-haven role. Relative value, macro, and credit are some of the strategies we’ve been invested in this year that have held up well relative to traditional asset classes and even produced positive absolute returns in many cases.
Relative value strategies are typically trading strategies that hedge out traditional risk factors like beta and duration and seek to capture the inefficiencies in pricing between similar or even related assets. Some relative value strategies profit in times of volatility. A mix of relative value strategies including equity, rates, F/X, agency mortgage derivative, and volatility relative value strategies have been positive year-to-date. Macro strategies are also uncorrelated, and Highland has historically preferred to use macro managers that are negatively correlated to risk factors in traditional asset classes. This means that macro strategies often have a modest return profile, but in environments such as these they can really shine. Macro is one of the best performing strategies this year. We utilize both discretionary and systematic macro strategies, which have been short interest rates in the front of the curve, albeit for different reasons. Lastly, short duration asset-backed and corporate credit strategies remain a core position. This can come in the form of long/short credit, structured credit, or a variety of more esoteric credit strategies. While credit by nature has some of the same risk factors (duration and credit spread risk) that drive fixed income returns, the mix is different and often hedged. It is the most highly correlated to fixed income; however, with high single digit yields, it has held up notably better than core bonds.
Few professional investors working today can remember a time when inflation posed any real concern. However, in the late 1960s, 1970s, and early 1980s, it caused as much concern around rising interest rates and bond market volatility as we see today. The value of a non-correlating pool of assets is more evident when investors are crowding out of rather than into risk assets. In a benign environment, when everything seems to be performing well, some investors rightly wonder why they should pay higher fees or sacrifice liquidity. However, if history is any guide, environments like this can persist for decades or subside after a few quarters. With all the variability and uncertainty, having some non-correlating fixed income alternatives in a portfolio is prudent.
Highland Associates Cross Asset Views
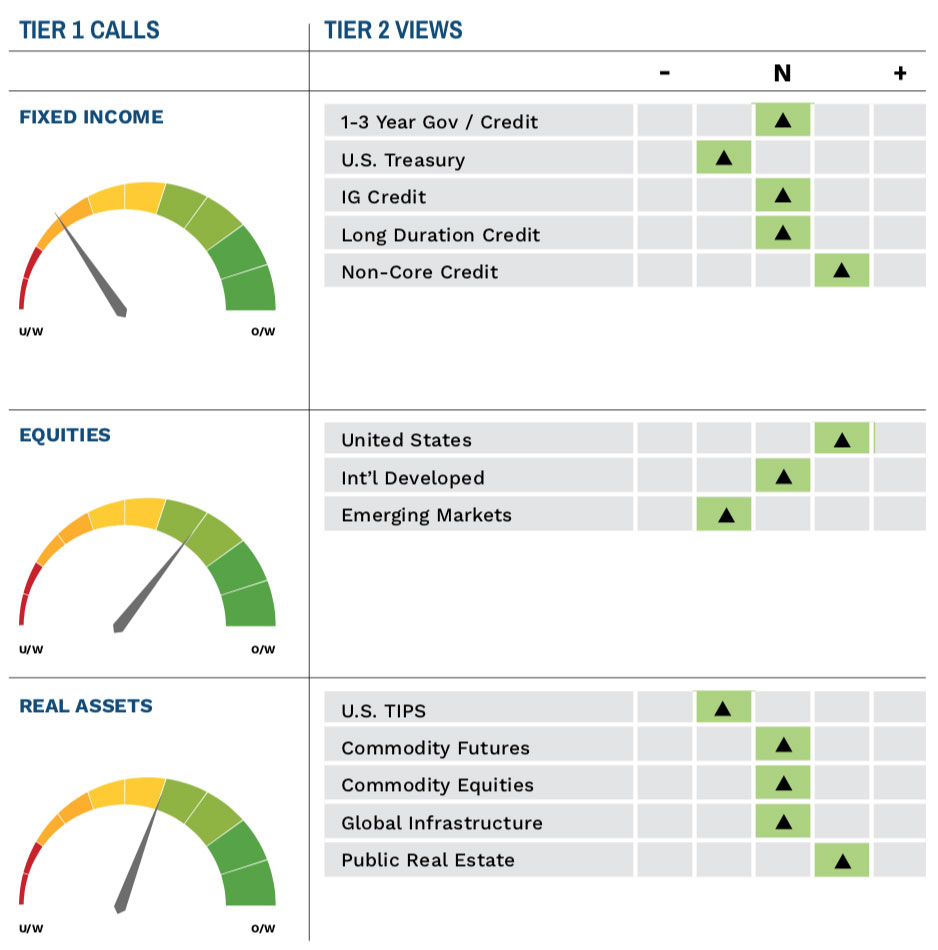
As of 5/16/2022
IMPORTANT DISCLOSURES: This publication has been prepared by the staff of Highland Associates, Inc. for distribution to, among others, Highland Associates, Inc. clients. Highland Associates is registered with the United States Security and Exchange Commission under the Investment Advisors Act of 1940. Highland Associates is a wholly owned subsidiary of Regions Bank, which in turn is a wholly owned subsidiary of Regions Financial Corporation. Research services are provided through Multi-Asset Solutions, a department of the Regions Asset Management business group within Regions Bank. The information and material contained herein is provided solely for general information purposes only. To the extent these materials reference Regions Bank data, such materials are not intended to be reflective or indicative of, and should not be relied upon as, the results of operations, financial conditions or performance of Regions Bank. Unless otherwise specifically stated, any views, opinions, analyses, estimates and strategies, as the case may be (“views”), expressed in this content are those of the respective authors and speakers named in those pieces and may differ from those of Regions Bank and/or other Regions Bank employees and affiliates. Views and estimates constitute our judgment as of the date of these materials, are often based on current market conditions, and are subject to change without notice. Any examples used are generic, hypothetical and for illustration purposes only. Any prices/quotes/statistics included have been obtained from sources believed to be reliable, but Highland Associates, Inc. does not warrant their completeness or accuracy. This information in no way constitutes research and should not be treated as such. The views expressed herein should not be construed as individual investment advice for any particular person or entity and are not intended as recommendations of particular securities, financial instruments, strategies or banking services for a particular person or entity. The names and marks of other companies or their services or products may be the trademarks of their owners and are used only to identify such companies or their services or products and not to indicate endorsement, sponsorship, or ownership by Regions or Highland Associates. Employees of Highland Associates, Inc., may have positions in securities or their derivatives that may be mentioned in this report. Additionally, Highland’s clients and companies affiliated with Highland Associates may hold positions in the mentioned companies in their portfolios or strategies. This material does not constitute an offer or an invitation by or on behalf of Highland Associates to any person or entity to buy or sell any security or financial instrument or engage in any banking service. Nothing in these materials constitutes investment, legal, accounting or tax advice. Non-deposit products including investments, securities, mutual funds, insurance products, crypto assets and annuities: Are Not FDIC-Insured I Are Not a Deposit I May Go Down in Value I Are Not Bank Guaranteed I Are Not Insured by Any Federal Government Agency I Are Not a Condition of Any Banking Activity.
Neither Regions Bank nor Regions Asset Management (collectively, “Regions”) are registered municipal advisors nor provide advice to municipal entities or obligated persons with respect to municipal financial products or the issuance of municipal securities (including regarding the structure, timing, terms and similar matters concerning municipal financial products or municipal securities issuances) or engage in the solicitation of municipal entities or obligated persons for such services. With respect to this presentation and any other information, materials or communications provided by Regions, (a) Regions is not recommending an action to any municipal entity or obligated person, (b) Regions is not acting as an advisor to any municipal entity or obligated person and does not owe a fiduciary duty pursuant to Section 15B of the Securities Exchange Act of 1934 to any municipal entity or obligated person with respect to such presentation, information, materials or communications, (c) Regions is acting for its own interests, and (d) you should discuss this presentation and any such other information, materials or communications with any and all internal and external advisors and experts that you deem appropriate before acting on this presentation or any such other information, materials or communications.
Source: Bloomberg Index Services Limited. BLOOMBERG® is a trademark and service mark of Bloomberg Finance L.P. and its affiliates (collectively “Bloomberg”). BARCLAYS® is a trademark and service mark of Barclays Bank Plc (collectively with its affiliates, “Barclays”), used under license. Bloomberg or Bloomberg’s licensors, including Barclays, own all proprietary rights in the Bloomberg Barclays Indices. Neither Bloomberg nor Barclays approves or endorses this material or guarantees the accuracy or completeness of any information herein, or makes any warranty, express or implied, as to the results to be obtained therefrom and, to the maximum extent allowed by law, neither shall have any liability or responsibility for injury or damages arising in connection therewith.