
Download Asset Allocation | March 2025
Another Brick in the Wall
Economic Update
Uncertainty around policy and continued volatility
By Regions Economic Division
As March unfolds, an escalating trade war and deep fiscal austerity measures have dominated headlines. Less than a month from an all-time high in the S&P 500, U.S. equity indices have now entered correction territory. The newly established Department of Government Efficiency (DOGE) has taken aim at government jobs and transfer payments. DOGE has implied what the band Pink Floyd once sang – We don’t need no education – with steep cuts to contracts and jobs in the U.S. Department of Education, and new agencies are targeted daily. Programs like Medicare and Medicaid have been placed in the crosshairs, threatening to curtail access to healthcare for millions of elderly and low- income citizens. The potential impact for major healthcare providers is also immense, with some set to experience double- digit percentage declines in revenue.
New tariffs are announced daily against some of our largest trading partners, and many of our trading partners have retaliated with tariffs on U.S. goods. In turn, the U.S. stacks new tariffs, like bricks in a wall, on top of previously announced tariffs. As stocks slide and confidence wanes, investors question: Does this volatility create a buying opportunity, or are the last few weeks a preview of more chaos to come? Historically, adding risk after market corrections works more often than not, but tariffs and fiscal austerity have been associated with several prolonged periods of economic weakness throughout history. Investors, and the world, wait to see if perceptions about tariffs and spending cuts become a stagflationary reality.
Over the past few months, we’ve cautioned that an uncertain and rapidly changing policy environment could weigh on economic activity and lead to heightened volatility in the financial markets. The past few weeks have been a prime example of what we had in mind when we first began raising these concerns. To be sure, the U.S. economy continues to push forward, but the path forward has become much rockier and far less clear. While at present our base case is that the economy will continue to expand, we now anticipate slower real GDP growth and higher inflation than we expected coming into 2025, and we consider the risks to our baseline forecast to be weighted to the downside. That is, we think, also the signal being sent in the financial markets, with sharp declines in yields on U.S. Treasury securities and significant declines in equity prices signaling more concern over the prospect of flagging growth outlook than the prospect of higher inflation amid wavering consumer and business confidence.
Consumers’ moods have meaningfully soured thus far in 2025, which is visible in both The Conference Board and the University of Michigan survey data. On top of the stress being caused by cumulative price increases over the past few years, consumers are now increasingly worried that higher tariffs will lead to further price increases. Uncertainty over tariffs, particularly given the on/off nature seen over the past several weeks, is impacting business decisions on purchases of raw materials and intermediate goods, capital spending, and hiring. To that point, the Institute for Supply Management’s (ISM) February survey of the manufacturing sector shows some firms putting off placing orders due to uncertainty over tariffs, while others report input prices already rising in anticipation of tariffs. Moreover, the speed and scope of cuts in federal government employment and spending are contributing to a sense of unease among both consumers and businesses, particularly given the potential spillover into the private sector in areas such as education and healthcare. The ISM’s February survey of the services sector conveys concerns along these lines.
Many are quick to dismiss confidence surveys and the ISM surveys as “soft” data that does not necessarily impact the “hard” data, such as consumer spending, business investment, and nonfarm job growth. Market participants may have been inclined to do the same with the most recent batch of survey data had that survey data not coincided with a run of hard data coming in below expectations. For instance, we noted last month that January’s gain in nonfarm employment came in handily below expectations, sparking concern over the labor market and the broader economy despite the details of the January employment report being stronger than implied by the headline job growth print. The January employment report, however, was followed by reports showing sharp declines in retail sales and residential construction in January, while at the same time January’s 0.5% increase in the Consumer Price Index (CPI) – with no help from tariff-related price increases – triggered fears that inflation was reigniting.
While we’ll admit to having been somewhat flustered by the wave of disappointing data, our task is, as always, to dig beneath the headline numbers and decipher the message in the details. Along those lines, we think the following points are worth making. First, atypically harsh winter weather across much of the U.S. in January clearly had an impact on the economy. Yes, there is a winter every year and, sure, it’s always cold in the winter, but the key words in the above sentence are “atypically harsh,” as evidenced by significant snowfall across much of the South. The impact of January’s atypically harsh winter weather is clear in the data on nonfarm employment and hours worked, residential construction, industrial production, and consumer spending.
We’ll also note that, for many data series, seasonal adjustment was much less generous this January than has been the case over the past several years. To some extent, this could reflect seasonal adjustment catching up to significant, pandemic-triggered disruptions in what for many years had been stable seasonal patterns. For instance, the not seasonally adjusted data show this January’s declines in nonfarm employment and control retail sales to be right in line with typical January declines, but in each case less favorable seasonal adjustment contributed to a softer headline print than would have been shown had last January’s seasonal factors been applied. In other words, less generous seasonal adjustment impacted perceptions of much of the January data.
Finally, recall that consumer spending, particularly on consumer durable goods, was notably strong over the final few months of 2024. There is evidence, including from the University of Michigan’s surveys, that consumers were pulling purchases of big-ticket items, including motor vehicles, forward into 2024 to avoid tariff-related price increases in 2025. Additionally, late 2024/early 2025 data on inventory accumulation, factory orders, and trade flows have been impacted by firms attempting to front- run higher tariffs. To the extent consumers and businesses were engaging in such behavior, there will naturally be payback, and we think we’re starting to see some of that in the recent data releases.
To be clear, this is not us trying to explain away a run of subpar economic data and make a case that all is well with the U.S. economy but is instead simply our usual attempt to put the data into proper context. After all, how one feels about the economy should be determined by what is actually happening in the economy and not by, say, the size of a seasonal adjustment factor. Be that as it may, while we did not find anything particularly amiss in the unadjusted January data, we are nonetheless increasingly concerned over what we perceive to be mounting downside risks. Some of these downside risks were ones we had flagged coming into this year, but which now seem more threatening, while others have emerged more recently.
As an example of the former, coming into this year we highlighted the risk that, should they perceive that demand for their goods/services is eroding, firms may be more inclined to let workers go, particularly to the extent that softening labor market conditions lessen the rationale for firms to engage in the labor hoarding behavior that we and many others have argued has been practiced in the post-pandemic years. Though we remain concerned over the prospect of an adverse labor supply shock stemming from immigration reform, we now see weakening demand for labor to be the more pressing downside risk to the labor market. This is one reason not to dismiss reports of flagging business confidence out of hand.
As for newly emerging downside risks, sharp cutbacks in federal government employment and, potentially, research and grant funding are hitting, rather abruptly, at a time when the economy is already slowing, and we do not yet have a way to gauge the potential spillover into private sector activity. However, the prospect of a few hundred thousand workers being displaced in an already cooling labor market could easily push the unemployment rate higher than we had been anticipating. Additionally, recent sharp declines in equity prices and what in many markets are softening house prices raise the potential of negative wealth effects leading to cuts in discretionary consumer spending, which could be significant given the degree to which higher income/net worth consumers have been driving overall consumer spending.
The path ahead for the U.S. economy looks much rockier than it did coming into this year. Yet another round of atypically harsh winter weather left a mark on the February employment report and will likely do the same with the data on residential construction and retail sales. Another round of disappointing data won’t make anyone feel any better about the growth outlook and, looking ahead, the March employment report will be the first to show meaningful impacts from cuts in the federal government workforce. It is not difficult to envision a negative feedback loop in which disappointing “hard” data further depresses business and consumer confidence, which in turn blows back on consumer spending and business investment/ hiring. These conditions could prevail until there is more clarity on the policy front.
Sources: U.S. Bureau of Economic Analysis, U.S. Bureau of Labor Statistics, U.S. Census Bureau, The Conference Board, University of Michigan Surveys of Consumers, Institute for Supply Management
Investment Strategy Update
Regions Multi-Asset Solutions & Highland Associates
The S&P 500 and small-cap Russell 2000 index closed out February with monthly losses of 1.3% and 5.3%, respectively, as sagging consumer confidence contributed to fears of a “growth scare,” or perhaps something worse, lying in wait. It became apparent as February ended that consumers, corporations, and investors are growing increasingly skittish and taking on a more defensive posture by building up savings/cash while reducing spending/investment in the face of rising geopolitical angst, government layoffs, and ongoing trade uncertainty. With consumer spending accounting for roughly two-thirds of GDP, households tightening purse strings in preparation of higher prices from tariffs would likely tamp down earnings growth in the coming quarters. And with corporations unwilling to invest or engage in mergers and acquisitions due to a lack of clarity on the trade and regulatory fronts, business spending can’t be relied upon to pick up the slack for a more cautious U.S. consumer. At the same time, rapid-fire cutbacks in federal government employment and spending added another layer of uncertainty for households and businesses to contend with, in part because the effects of these cutbacks will spill over into the private sector.
Shaky investor sentiment was evident in the American Association of Individual Investors (AAII) weekly investor survey. Pessimism ruled the day, with 60.6% of respondents “bearish” on stocks over the next six months in the February 26 poll. The percentage of bearish respondents is almost twice the historical average of 31% and was last higher on September 29, 2022. Interestingly, that level of bearishness in the September 2022 survey proved to be an opportune time to buy, as the S&P 500 rallied 5.5% in the three months to follow and 17.7% in the next year. While we would love it if history repeated and the S&P 500 turned out similar returns in the next 3 and 12 months, other guideposts, specifically the muted response out of the CBOE Volatility Index (VIX) and defensive leadership profile, lead us to believe that peak pessimism and additional downside in U.S. stocks may still lie ahead.
VIX measures 30-day implied S&P 500 volatility and is calculated based on demand for 10% out-of-the-money puts, or options that rise in price as stock prices fall, relative to 10% out-of-the-money calls, or bets that stocks will move higher. A VIX reading of 20 or less is indicative of limited demand for hedges against a market drawdown and has been quite common in recent years as pullbacks have been shallow and short-lived. A spike in the VIX tends to coincide with a selling crescendo or sentiment “flush,” which can correspond with market bottoms. VIX entered March below 20, a potential sign of complacency surrounding whether tariffs would be levied or not. A VIX spike to 30 or above, a level last seen in August 2024, would be more indicative of peak pessimism and give us comfort that a market bottom is close, if not in place. VIX was hovering in the mid-20s in early March as tariffs went into effect on Canada, China, and Mexico, so we are likely closer to a level where those needing to de- risk have already done so. That said, it would be unusual to see the market bottom with so few S&P 500 constituents trading below their short-term moving averages.
Market breadth didn’t signal a rush to the exits at month- end as more than 50% of S&P 500 constituents remained above their 10-, 50-, and 200-day moving averages. U.S. indices still pulled back despite decent participation, shining a light on concentration risk as the Magnificent 7 are still dictating the direction of travel. An equally weighted basket of the S&P 500 stocks fell 8.5% in February, making it a tough ask for the remaining 493 names to offset such a sizable drop. In March, all of the Mag 7 were down 10% or more from their all-time high, and most were trading in oversold territory based on relative strength indicators (RSI). This backdrop could bring about a near-term bounce, but near-term upside could be limited as prior support levels may now become upside resistance. The S&P 500 tested support at its 200-day moving average around 5,730 in early March, but support failed. In the area below the 200- day average, intraday and daily volatility can be high.
A Pronounced Leadership Shift to Start the Year

Source: Bloomberg
Sector leadership struck a risk-off tone in February due to economic and policy uncertainty, with consumer staples (+5.7%), healthcare (+1.3%), and utilities (+1.1%) each outperforming the S&P 500 during the month. But the energy (+3.2%), financial services (+1.2%), and real estate (+4.1%) sectors – all economically sensitive to some degree – outperformed the S&P 500 as well, confounding investors positioning for an economic slowdown. The sector leadership profile has shifted in a decidedly defensive direction in March, as energy and financial services succumbed to selling pressure and have given back February’s gains plus some. With quarterly earnings season behind us, the path taken by U.S. stocks will be beholden to headlines and the macro backdrop, a potentially disconcerting combination. With few positive catalysts to speak of outside of an unlikely about-face on tariffs, economic surprises are likely to skew to the downside. However, the seasonal backdrop has historically turned more supportive for U.S. stocks in mid-March through May, and with the S&P 500 now oversold, a bounce should be expected. It’s just a matter of whether that bounce happens now or from a lower level.
Earnings Growth Estimates Likely to Follow Economic Surprises Lower
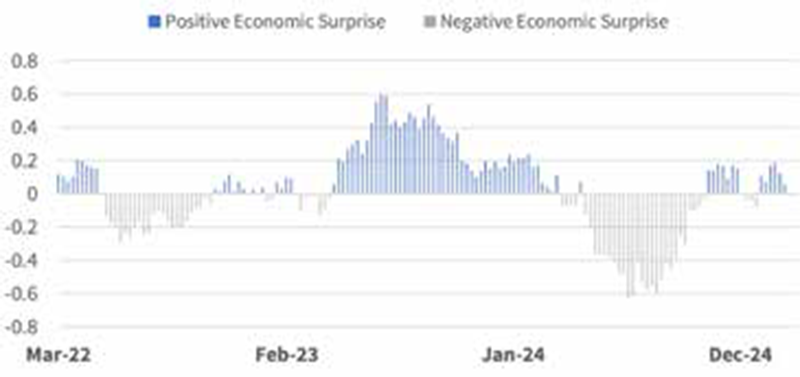
Source: Bloomberg
Developed markets abroad outperform as accommodative monetary policy and the prospect of fiscal support drive capital inflows. The MSCI Europe Index advanced 3.2% in February, outpacing both the S&P 500 and MSCI EAFE by a sizable margin, and strength out of euro zone country indices continued into early March as investors sought relative safety as U.S. tariffs on Canada, China, and Mexico went into effect. Accommodative monetary policies have buoyed economic growth estimates for the EU and U.K. early in the new year, and the European Central Bank (ECB) again cut key policy rates in early February, leading market participants to believe that additional support was possible, if not likely, in the coming quarters. Hopes for easier monetary policy pulled capital into euro area stocks in January/February, but the most impactful and unexpected shift spurring economic optimism across the pond could come on the fiscal front.
In early March, in a surprising move, Germany voiced a willingness to step up spending on manufacturing and military capabilities, possibly signaling the beginning of the end for a nearly century-long period of fiscal austerity. This could be a watershed moment for euro area economic growth, but skepticism remains warranted as there have been no actions taken yet, and when the rubber meets the road, some euro area countries could balk at what is proposed, limiting the size and impact of any fiscal support. Sovereign bond yields across the euro area rose on the prospect of more debt needing to be issued, and the euro currency rallied versus the U.S. dollar, touching 1.08€ to $1, a level last seen in November prior to the U.S. presidential election and a sign of capital being repatriated and moving out of the U.S. in favor of Europe.
The German DAX garnered headlines after touching all-time highs on its way to a 21.9% return in the first two months of 2025, overshadowing peripheral European country indices such as Italy, Greece, and Spain, which have all rallied 18% or more in U.S. dollar terms year-to-date. Over the trailing three years, Italy, Greece, and Spain have quietly bested the S&P 500 – who had that on their bingo card? From a valuation perspective, developed markets abroad remain relatively attractive, with the MSCI EAFE trading at 15 times estimated next 12 months’ earnings, which compares favorably to the S&P 500’s loftier valuation of 21.5. Perhaps most notably, even amid signs the U.S. economy is slowing, there is little hope for less restrictive monetary policy in the near-term, but policymakers in Europe appear willing to ease policy to support economic growth despite sticky inflation, and movement on the fiscal front would be the cherry on top for investors in the euro area.
Core investment-grade bonds have performed quite well up to this point in 2025, with the Bloomberg Aggregate Bond Index higher by 2.7% year-to-date through February, followed closely by the Bloomberg U.S. Corporate Index, which has rallied a respectable 2.6%. Fears of an economic slowdown have put a bid under high-quality bonds, and Treasury yields across the curve have fallen to start the year, retracing much of the upward move made throughout the fourth quarter of 2024.
In President Trump’s first term, he consistently cited and tied his “wins” to the stock market’s gains. However, both the President and Treasury Secretary Scott Bessent were noticeably silent as stock prices fell in the back-half of February and into March, and the administration appears to care more about the Treasury market this time around. The pair have repeatedly voiced their willingness to see Treasury yields, specifically the 10-year yield, fall to unlock or thaw the housing market, where a combination of high prices and higher interest rates have effectively shut out new buyers. Some near-term economic pain is perhaps the only path to achieving this aim, as it would lower consumption/demand and force investors into safe- haven U.S. Treasuries, pushing yields/rates lower and weakening the U.S. dollar. February’s softer economic data could be viewed by the administration as a means to an end, and if some degree of economic pain is going to be tolerated, then economic surprises are more likely to be to the downside in the coming quarters. Thus, we see little reason to reduce exposure to Treasuries with this backdrop in place. Investment-grade corporates, on the other hand, which have also benefited from falling Treasury yields, hold less appeal as credit spreads are still tight by historical standards and potentially fail to adequately compensate investors for taking credit risk into an economic slowdown.
Some signs of caution coming from credit. Credit spreads widened in the back-half of February as tariff rhetoric ramped up, consumer confidence flagged, and investors were presented with more signs of cooling in the labor market. However, while valuations for investment-grade corporate bonds have cheapened only modestly up to this point, the drawdown in riskier higher-yielding corporate bonds (HY) has been deeper with the spread over the U.S. Treasury curve for the Bloomberg U.S. Corporate High Yield Index now 50 basis points above its mid-February low. Higher yields appeared to initially draw investor capital back into these bonds in early March, reversing some of the widening in spreads last month, but the sell-off appeared to pick up steam mid-month as the S&P 500 approached a nearly 10% peak-to-trough decline. Fears of a U.S. economic slowdown could persist and weigh on consumer spending, business investment, and hiring in the coming months, potentially leading to downward revisions to earnings estimates. This backdrop would likely force credit spreads wider and weigh on valuations for lower-quality corporate bonds, but active managers could be best positioned to sift through the wreckage and take advantage of further weakness in this segment of the bond market.
Elevated Volatility Forcing Credit Spreads Wider – More to Come?
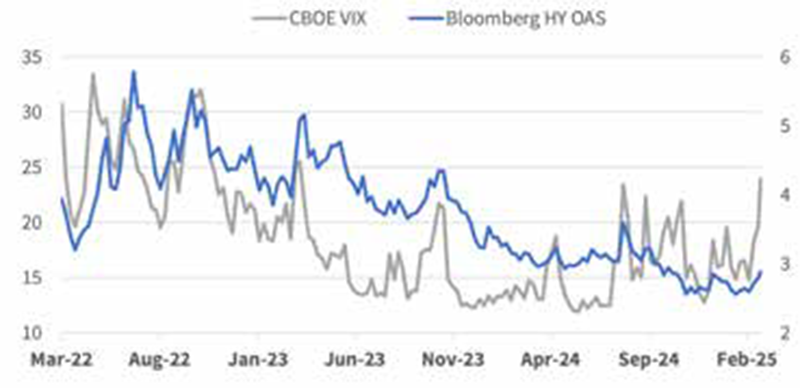
Source: Bloomberg
U.S. dollar-hedged developed market sovereign bonds currently offer U.S. investors a higher yield relative to U.S. Treasuries, broadly speaking, and the credit profile is similar to that of many domestic investment-grade issues. We have been under- allocated to developed market sovereigns in recent years as yields were unappealing on both an absolute or relative basis versus U.S. Treasuries, and the U.S. dollar’s strength versus the euro, yen, and British pound in the post-COVID environment has been a headwind for upside from exposure to foreign bonds. But this dynamic has shifted in recent quarters, and yields on developed market sovereigns are more attractive; and should the U.S. dollar continue to slide on economic growth concerns, U.S.-based investors would benefit from diversification via exposure to assets tied to foreign markets and currencies and, of course, emerging markets.
Despite challenges and uncertainty, February ended with an economic score that remained risk-on. There were some notable declines in the strength of market-based indicators during the month. The strength of the yield curve and credit spread scores declined, but unless March gets notably worse, equity momentum scores may not change this month. The positive catalysts highlighted in February have not come to fruition. Some political strategists believe that the administration has a mix of policies that may cause short-term pain but could be beneficial long term and some policies that will be immediately beneficial. In the first seven weeks of the administration, most policy announcements have caused investors and markets to recoil. While these policies may have long-term benefits, investors are all presently enduring a less enjoyable short-term impact. Like children at dinner, we are forced to eat our meat in anticipation of pudding. Hopefully, the immediately beneficial policies are near, and the long-term benefits to the economy deliver as promised. As expected, the Fed remained on hold but did revise their growth forecast lower and their inflation expectation higher for the year.
IMPORTANT DISCLOSURES: This publication has been prepared by the staff of Highland Associates, Inc. for distribution to, among others, Highland Associates, Inc. clients. Highland Associates is registered with the United States Security and Exchange Commission under the Investment Advisors Act of 1940. Highland Associates is a wholly owned subsidiary of Regions Bank, which in turn is a wholly owned subsidiary of Regions Financial Corporation. Research services are provided through Multi-Asset Solutions, a department of the Regions Asset Management business group within Regions Bank. The information and material contained herein is provided solely for general information purposes only. To the extent these materials reference Regions Bank data, such materials are not intended to be reflective or indicative of, and should not be relied upon as, the results of operations, financial conditions or performance of Regions Bank. Unless otherwise specifically stated, any views, opinions, analyses, estimates and strategies, as the case may be (“views”), expressed in this content are those of the respective authors and speakers named in those pieces and may differ from those of Regions Bank and/or other Regions Bank employees and affiliates. Views and estimates constitute our judgment as of the date of these materials, are often based on current market conditions, and are subject to change without notice. Any examples used are generic, hypothetical and for illustration purposes only. Any prices/quotes/statistics included have been obtained from sources believed to be reliable, but Highland Associates, Inc. does not warrant their completeness or accuracy. This information in no way constitutes research and should not be treated as such. The views expressed herein should not be construed as individual investment advice for any particular person or entity and are not intended as recommendations of particular securities, financial instruments, strategies or banking services for a particular person or entity. The names and marks of other companies or their services or products may be the trademarks of their owners and are used only to identify such companies or their services or products and not to indicate endorsement, sponsorship, or ownership by Regions or Highland Associates. Employees of Highland Associates, Inc., may have positions in securities or their derivatives that may be mentioned in this report. Additionally, Highland’s clients and companies affiliated with Highland Associates may hold positions in the mentioned companies in their portfolios or strategies. This material does not constitute an offer or an invitation by or on behalf of Highland Associates to any person or entity to buy or sell any security or financial instrument or engage in any banking service. Nothing in these materials constitutes investment, legal, accounting or tax advice. Non-deposit products including investments, securities, mutual funds, insurance products, crypto assets and annuities: Are Not FDIC-Insured I Are Not a Deposit I May Go Down in Value I Are Not Bank Guaranteed I Are Not Insured by Any Federal Government Agency I Are Not a Condition of Any Banking Activity.
Neither Regions Bank nor Regions Asset Management (collectively, “Regions”) are registered municipal advisors nor provide advice to municipal entities or obligated persons with respect to municipal financial products or the issuance of municipal securities (including regarding the structure, timing, terms and similar matters concerning municipal financial products or municipal securities issuances) or engage in the solicitation of municipal entities or obligated persons for such services. With respect to this presentation and any other information, materials or communications provided by Regions, (a) Regions is not recommending an action to any municipal entity or obligated person, (b) Regions is not acting as an advisor to any municipal entity or obligated person and does not owe a fiduciary duty pursuant to Section 15B of the Securities Exchange Act of 1934 to any municipal entity or obligated person with respect to such presentation, information, materials or communications, (c) Regions is acting for its own interests, and (d) you should discuss this presentation and any such other information, materials or communications with any and all internal and external advisors and experts that you deem appropriate before acting on this presentation or any such other information, materials or communications.
Source: Bloomberg Index Services Limited. BLOOMBERG® is a trademark and service mark of Bloomberg Finance L.P. and its affiliates (collectively “Bloomberg”). BARCLAYS® is a trademark and service mark of Barclays Bank Plc (collectively with its affiliates, “Barclays”), used under license. Bloomberg or Bloomberg’s licensors, including Barclays, own all proprietary rights in the Bloomberg Barclays Indices. Neither Bloomberg nor Barclays approves or endorses this material or guarantees the accuracy or completeness of any information herein, or makes any warranty, express or implied, as to the results to be obtained therefrom and, to the maximum extent allowed by law, neither shall have any liability or responsibility for injury or damages arising in connection therewith.