
Download Asset Allocation | March 2024
Just Breathe
Economic Update
On the Way, Just Not in a Hurry
By Regions Economic Division
Federal Open Market Committee (FOMC) members have made it clear that while they expect to begin cutting the Fed funds rate at some point in 2024, they are in no hurry to do so. Chair Powell recently reiterated that point in his semiannual monetary policy testimony to Congress, and though he did concede that the committee was “not that far from” the point at which they will begin cutting the funds rate, “not that far” is of course relative to the length of the journey one is on. In terms of getting inflation back to the FOMC’s 2.0% rate, that journey has been a long one, and while it may seem the end is in sight, the path along this last leg of the journey is proving to be rocky. Moreover, rather than having brightened the way for the FOMC, the recent economic data have acted more as a thick fog for the FOMC to make their way through. There is a difference between thinking you’re on the right path and being sure you’re on the right path, and until the FOMC feels surer than they do right now, they will continue to tread carefully, seeing less danger in moving too slowly than in moving too quickly.
That the labor market data have been all over the map isn’t making the FOMC’s job any easier. The February employment report showed total nonfarm payrolls rose by 275,000 jobs, but at the same time showed the unemployment rate rose to 3.9%, the highest rate since January 2022. While the gains in nonfarm payrolls may seem impressive, the February employment report also showed that prior estimates of job growth in December and January were revised down by a net 167,000 jobs for the two-month period, an unusually large revision. Moreover, this continues a somewhat unsettling pattern of downward revisions to the initial estimates of job growth. Except for December 2023, the initial estimate of private sector job growth has been revised lower in each of the past 13 months, in most cases significantly so.
The main culprit has been the notably low response rates to the establishment survey conducted each month by the U.S. Bureau of Labor Statistics (BLS), which is used to derive estimates of nonfarm employment, hours, and earnings. These low response rates leave bigger gaps for BLS to fill in with their own estimates, and as more source data become available over subsequent months, BLS revises their estimates. We expect that, for this same reason, the initial estimate of February job growth will also be revised lower. As for February’s increase in the unemployment rate, that increase is more than entirely accounted for by a reported decline in employment among those aged 16 to 24 – down by 466,000 in February – while employment among the “prime working age” cohort continued to rise, a dichotomy that has been in evidence for the past year. As such, we see February’s increase in the jobless rate more as noise than as a reliable signal of labor market stress.
The inflation picture is also less clear, and this remains the main concern of the FOMC, particularly after the January data suggested renewed inflation pressures. Here too, however, there was some degree of noise that made interpreting the data more challenging. The Consumer Price Index (CPI) rose by 0.3% in January, as expected, but the core CPI rose by 0.4%, in line with our forecast but a larger increase than expected by the consensus forecast. There was a certain degree of residual seasonality in the January CPI data, but the January data also showed a jump in owners’ equivalent rents, the largest single component of the CPI.
Still, in and of itself, the January CPI data did not suggest a sustained reacceleration in inflation, but other indicators were cause for concern. For instance, the Institute for Supply Management’s (ISM) monthly surveys of the manufacturing and services sectors showed firms i n b oth b road s ectors paying higher prices for non-labor inputs in January. While this was not surprising in the services survey, the extent to which the ISM’s gauge of non-labor input prices rose was. That the manufacturing survey showed rising costs for non- labor inputs did come as a surprise and ended a lengthy run of falling costs. Additionally, retail gasoline prices have risen sharply over the past several weeks, meaning that after a run in which falling gasoline prices acted as a drag on headline inflation, r ising g asoline p rices w ill a dd t o h eadline i nflation beginning with the February data and, if normal seasonal patterns hold, this will remain the case over the next several months.
For those hoping the February data would quell concerns over building price pressures, the early returns are not encouraging. The ISM’s February survey indicated further increases in costs of non-labor inputs in both the manufacturing and services sectors, and retail gasoline prices have continued to increase. While the FOMC may elect to look beyond headline inflation and focus on core inflation, sustained increases in input costs would ultimately feed through to core inflation. M oreover, the core CPI again surprised to the upside in February, and the annualized three-month change rose to 4.2%, the highest reading since last June. While it is too soon to know whether these price pressures will be sustained, this is nonetheless a perfect illustration of why the FOMC continues to insist that it is too soon for them to entertain discussions of cuts in the Fed funds rate.
To the surprise of no one, the FOMC left the Fed funds rate target range unchanged at this month’s meeting. What was much more uncertain, however, was how the Committee would revise their economic and financial projections, including the number of Fed funds rate cuts that would be implied by the updated dot plot. That ended up as pretty much of a wash, however, as the updated dot plot continues to imply three twenty-five basis point cuts by year-end 2024, but at the same time the updated dot plot implies one fewer cut in 2025 than had the prior edition. The Committee’s updated economic projections show the expectation of meaningfully faster real GDP growth in 2024 and higher core inflation than had been implied in the December 2023 projections, with a modestly lower unemployment rate. As was widely expected, the Committee also acknowledged that they would maintain the pace at which the Fed’s balance sheet is being pared down. Thus far, the reaction in the financial markets can best be characterized as relief, but, with the updated dot plot again implying three funds rate cuts this year, it will be interesting to see whether or not market participants once again get ahead of themselves, or at least ahead of the FOMC, and price in even further easing.
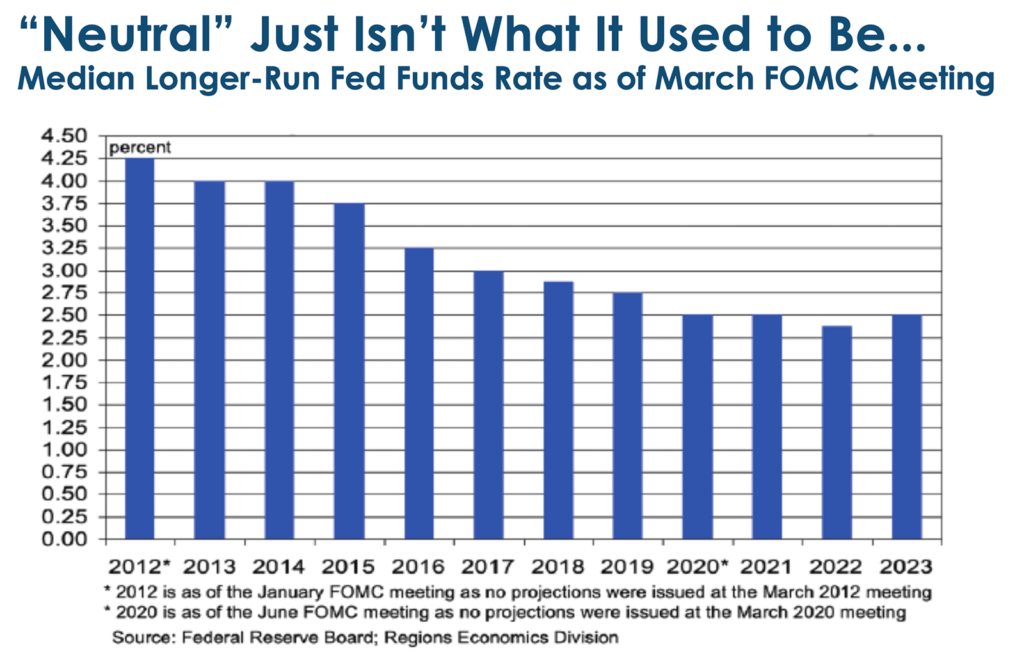
Estimates of the neutral Fed funds rate can, and do, vary over time as perceived changes in the underlying fundamentals of the economy – primarily, growth in the labor force and productivity growth – change, and a neutral funds rate of 2.5% is indicative of weak underlying fundamentals. But, with the economy having proven so resilient in the face of higher interest rates and the rate of labor productivity growth having picked up considerably over the past three quarters, the FOMC may feel that it is time to raise their estimate of the neutral funds rate, which we expect them to do at this month’s meeting. One implication of a higher neutral funds rate, however, would be that policy is not at present as restrictive as many have perceived it to be over recent quarters, and by extension this would imply less scope for the FOMC to cut the funds rate going forward. While this would no doubt rattle the markets, we think that the most important point to keep in mind is that a higher neutral Fed funds rate would be consistent with better underlying economic fundamentals, which ultimately is a win all the way around.
Sources: U.S. Bureau of Labor Statistics; Institute for Supply Management
Investment Strategy Update
Stocks: A Logical Spot to Take a Breather
Regions Multi-Asset Solutions & Highland Associates
U.S. large-cap stocks (S&P 500) continued to melt up in February and turned out a 5.3% total return during the month, as earnings season provided an upside catalyst with mega-cap technology stocks tied to the artificial intelligence (AI) theme leading the way. Encouragingly, market leadership broadened out during February, and at month-end more than two-thirds of the stocks in the S&P 500 were trading above both their respective 50- and 200-day moving averages. This data point makes it tough to argue that the market is on shaky footing due to a narrow leadership profile. However, while improved market breadth and price momentum make it tough to find much fault with the current market backdrop, March would still be a logical spot in the calendar for stocks to take a breather and digest sizable recent gains.
After a 21%-plus gain for the S&P 500 since the end of October, market participants focused on preserving gains could be eager to hit the sell button and take profits amid the first signs the market is losing momentum. Momentum can be a powerful driver of stock returns but is also a double-edged sword as it often feeds on itself – both to the upside and downside. From a seasonal perspective, March has historically been a “middle of the pack” month for the S&P 500, generating an average return of 0.5% dating back to 1928, and the index has typically fallen short of its average monthly return in presidential election years such as this. The historically weak seasonal backdrop along with few identifiable catalysts for near-term upside leading up to quarterly reporting season in mid-April leave stocks susceptible to losing momentum during this stretch in the calendar and are reasons for only guarded optimism.
Calling market tops or bottoms is a challenging endeavor, but that hasn’t stopped many from attempting to do so in recent months. A systematic rebalancing approach can help investors avoid having to call a market top and make emotional decisions to sell winning stocks/positions when momentum fades and the prevailing market narrative shifts. Historically, a strong S&P 500 return in the January/ February time frame has, on average, led to a nearly double-digit return over the balance of a given calendar year. With history on the side of the bulls, an orderly 3%-5% pullback in the index would likely act as a healthy reset and leave us incrementally more constructive on the outlook for stocks over the balance of 2024.
Diversification Harder to Achieve via Large Caps, a Potential Tailwind for Small-Mid Caps
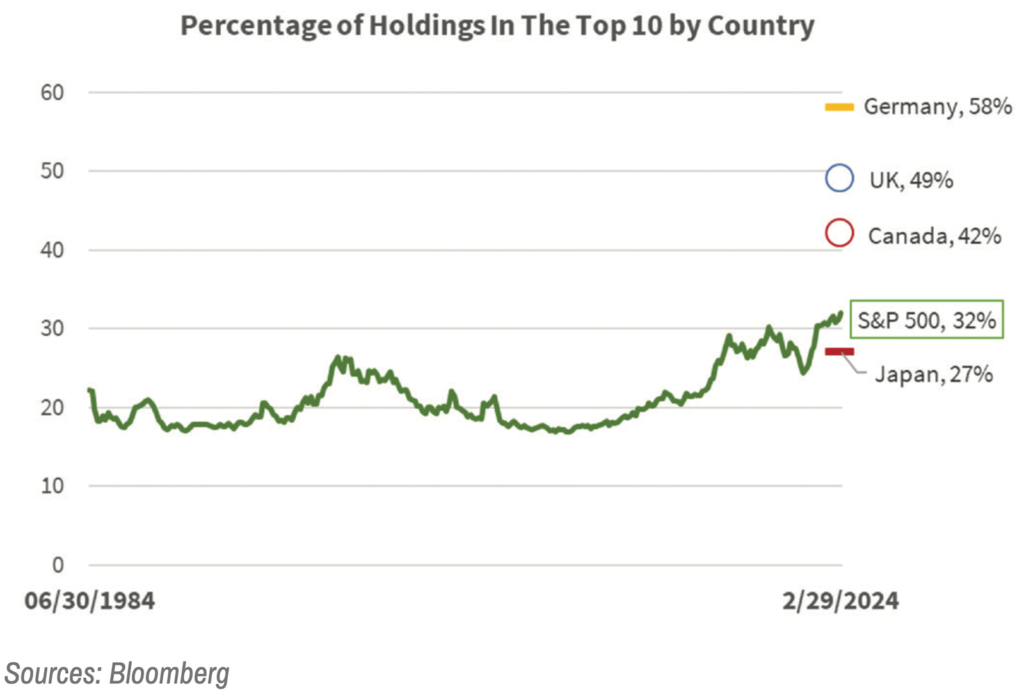
The current level of concentration in the S&P 500 has been an oft-cited concern as prognosticators have pointed toward narrow market breadth and the rise of the Magnificent 7 as a sign the rally is on shakier ground. It has not been unusual for sectors and/or industries tied to a theme, in this case AI, to garner capital inflows as investors crowd into a smaller number of expected beneficiaries. While the top 10 holdings in the S&P 500 accounted for approximately 31% of the index at the end of February, Germany, Canada, and the United Kingdom each carry higher allocations to their respective heavyweights, while Japan’s Nikkei 225 is only modestly more diversified w ith a 2 7% w eighting t o i ts t op 10 constituents. With the S&P 500 and other indices abroad increasingly more concentrated, investors seeking greater diversification could increasingly look to small- and mid-cap (SMid) stocks to alleviate concentration concerns. Notably, the S&P Mid-Cap 400 index has just 8% tied to its top 10 holdings, while the S&P Small-Cap 600 has 6%, highlighting minimal single-stock risk.
As February rolled along, smaller capitalization stocks exhibited positive price momentum with some of the lower quality, unprofitable pockets outperforming, a sign of improved investor risk appetite. This is a notable shift in sentiment for a pocket of the market that has lagged the S&P 500 by 20% since the end of 2022. This cohort hasn’t benefited from the AI frenzy to the same degree as large caps, instead experiencing positive momentum in cyclical areas like industrials and discretionary stocks. We continue to assess attractiveness in this sector of the market.
2024 Setting Up to Be a Country Selection Story Abroad
Japan has remained a standout performer abroad, with the Nikkei 225 rising just shy of 10% on a total return basis year- to-date through February. The Nikkei’s year-to-date rally is in addition to a 21.8% total return in 2023, and in February the index reached a new all-time high, its first since 1989. Outside of Japan, France, Germany, and Italy have performed well on a relative basis year-to-date, while Australia, Spain, and the U.K. have floundered. Encouragingly, the year-to-date rally in the Nikkei has occurred amid signs that Japan’s economic growth is slowing and that inflationary pressures remain stubbornly elevated. In response, the Bank of Japan (BoJ) is expected to pivot in the coming months and potentially scrap its long-held yield curve control policy. The Nikkei 225 making a new all-time high is far from bearish, but with uncertainty surrounding the BoJ’s upcoming shift, volatility in the Japanese yen and Japanese stocks over the next few months is likely, with an equity pullback potentially in the cards should the yen strengthen. As is the case with the S&P 500, the Nikkei has rallied far and fast, and investors should be on guard for the index to lose momentum and perhaps take a breather over the next month or so before resuming its uptrend.
Emerging markets have kicked off ’24 in lackluster fashion as China’s ongoing issues have remained a concern for investors evaluating the space. Sentiment remains negative and positioning is light when it comes to Chinese stocks. At some point, this dynamic could present a contrarian buying opportunity, but near-term catalysts for an improved outlook on China’s economy and stock market remain difficult to identify and, as a result, we see better opportunities in emerging markets outside of China. In that vein, India and Taiwan, which together account for over 34% of the EM index, have been strong performers year-to-date, and while Brazil and Mexico, two countries that performed well in ’23, have lagged, we remain constructive on both as inflationary pressures subside and central banks cut rates/ease monetary policy. Given our cautious outlook on China and the belief that some of the countries that carry smaller weights within the MSCI EM index offer better investment opportunities at present, active managers running portfolios that look different from the MSCI EM index could be set up to perform well over the balance of this year and beyond.
Bonds: A Clip Your Coupon Environment
The 10-year Treasury yield closed out 2023 at 3.88% but ended February at 4.25% as a hot January inflation reading and economic data supportive of the “no landing” narrative called into question just how aggressively the FOMC would be cutting rates over the balance of 2024. However, the uptrend in rates reversed course in early March, with Treasuries and other longer-duration bonds faring better as markets have moved past the seasonal noise in the January inflation data. Inflation is trending toward the FOMC’s 2% target, but not quickly enough to provide policymakers with the cover to ease policy/cut rates later this month. Market participants expect three or four quarter-point cuts in ’24, with the first coming in June, and appear more closely aligned with the FOMC’s view of two or three 25-basis-point rate cuts over the balance of this year. This dynamic could serve to suppress volatility in the rates market over the near-term, leading to a clip-your- coupon sort of backdrop for investors in U.S. Treasuries.
On balance, we view Treasuries as fairly valued at present, with the 10-year yield hovering around 4.1% at the time of this writing, almost the exact midpoint of its year-to-date trading range. Looking forward, 3.90% on the 10-year yield would be noteworthy, as a break below that level would likely call into question the outlook for U.S. economic growth. Conversely, a break above 4.30% would also be worthy of attention as potential evidence that inflation expectations are again moving higher.
Elevated Corporate Issuance Met by Robust Demand, So Far
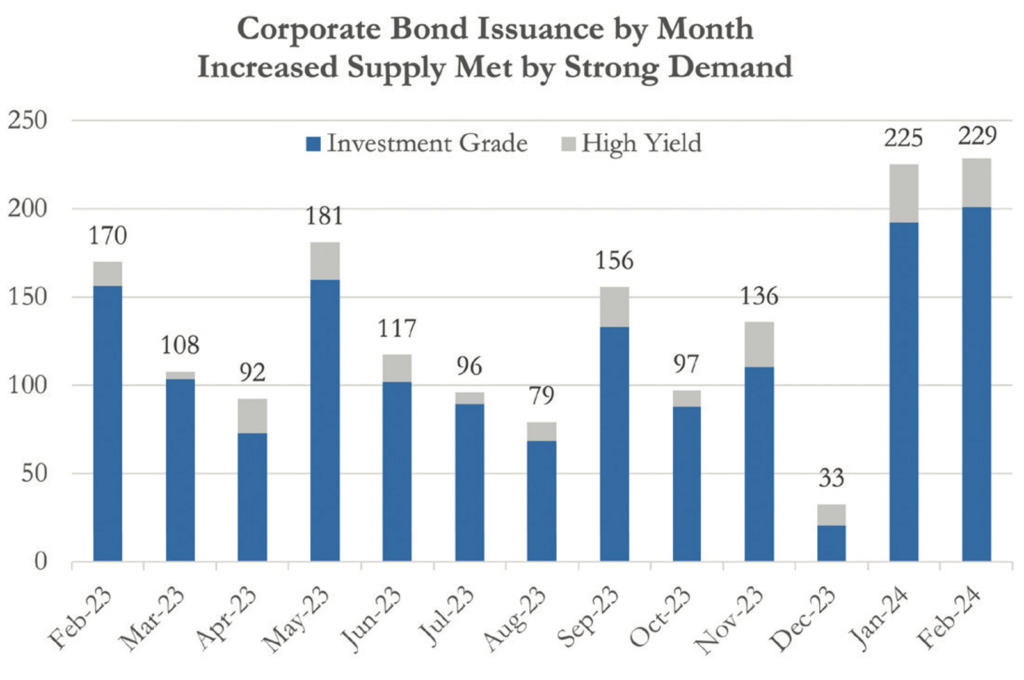
The rise in corporate bond issuance over the past couple of months has garnered our attention and, encouragingly, this increased issuance has been met with ravenous demand for newly issued paper. Corporate issuance set records in both January and February with upwards of $454B across the quality spectrum thus far in 2024, and with a historically strong seasonal period for issuance beginning in March, all signs point to more monthly records falling. Up to this point, demand has been unwavering, but tighter credit spreads and lower absolute yields relative to January and February may test that dynamic. Even if buyers briefly back away from corporates, modestly higher yields and/or wider credit spreads would likely lure participants off the sidelines in short order to lock in higher rates given the market’s prevailing view that the FOMC will begin cutting rates in June. In short, a buyer strike would likely be short lived, but we would be selective, particularly in the investment-grade corporates space given rich valuations at present.
Relative Value Currently Lies with the Lowest Quality Corporate Bonds
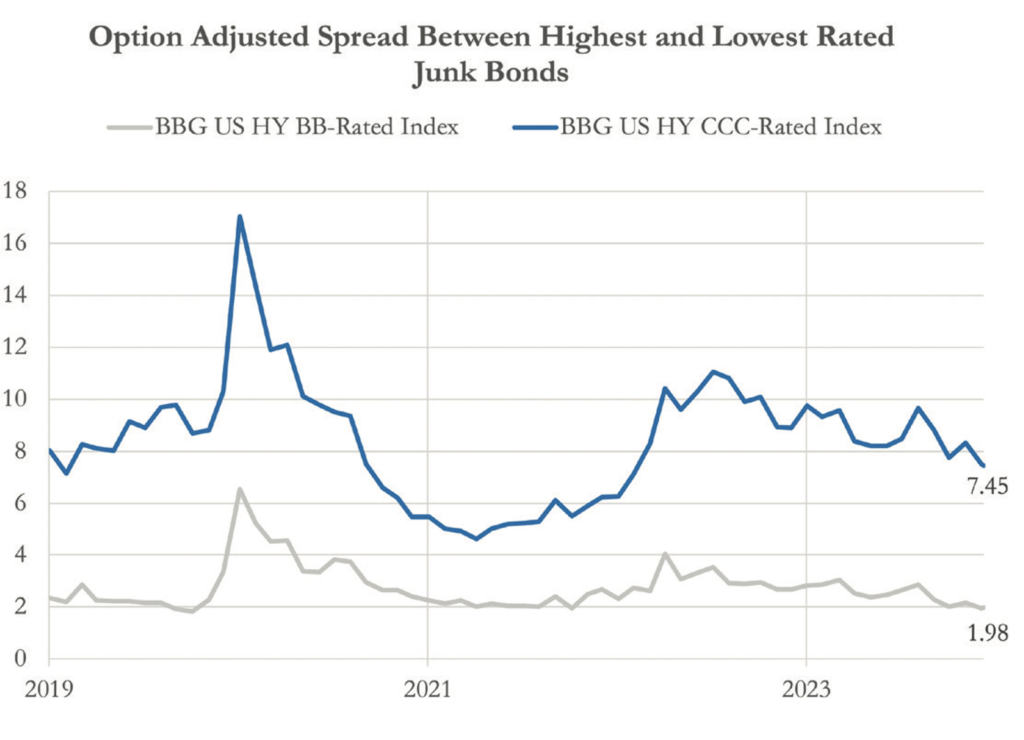
High-yield bonds have been a relative success story year-to- date, eking out a 0.29% total return through February, while most other fixed-income subsectors struggled to stay out of the red. A preference for lower-quality credits is evident when you dig into returns by quality rung as the CCC-rated subset of the index, the lowest credit rating above bonds in default, returned a more compelling 1.5% year-to-date with a healthy 745-basis-point spread over Treasuries at month- end. On the other hand, BB-rated credits, often referred to as “the best junk,” had a spread of 198 basis points, just a basis point away from a three-year low. Investors should view this as a positive indicator of risk appetite. With spreads on CCC wide relative to BB, expect flows to find their way into lower-rated credits in a risk-seeking environment, serving as a tailwind for the sector in general, amid continued low default rates and strong fundamentals.
Against this backdrop, we remain constructive on risk assets. Monetary policy, employment, credit spreads, and momentum indicators continue to signal a favorable environment in the months ahead. Many positives are likely already priced into equities. This leads us to start to favor pockets where valuations are attractive, and sentiment is far from full. U.S. small- and mid-cap, and emerging market stocks are areas that appear to fit these criteria. At the same time, the increase in bond yields, while painful, bodes well for fixed income and select alternative assets across the risk spectrum. We’ve added to both in recent quarters to take advantage of projected higher future returns and an improved backdrop. Lastly, with the potential for inflation to reaccelerate, the appeal of income-generating assets capable of providing inflation diversification remains. Real Estate Investment Trusts (REITs) are somewhat protected from the challenges facing the office sector given its broader diversification relative to private real estate and are priced attractively versus broader equities. We prefer an active approach to the asset class, with preferred managers favoring cell towers, data centers, and industrial properties given attractive fundamentals and supply. A diversified and nimble approach to investing remains desirable given that some assets zig while others zag.
Highland Associates Cross Asset Views
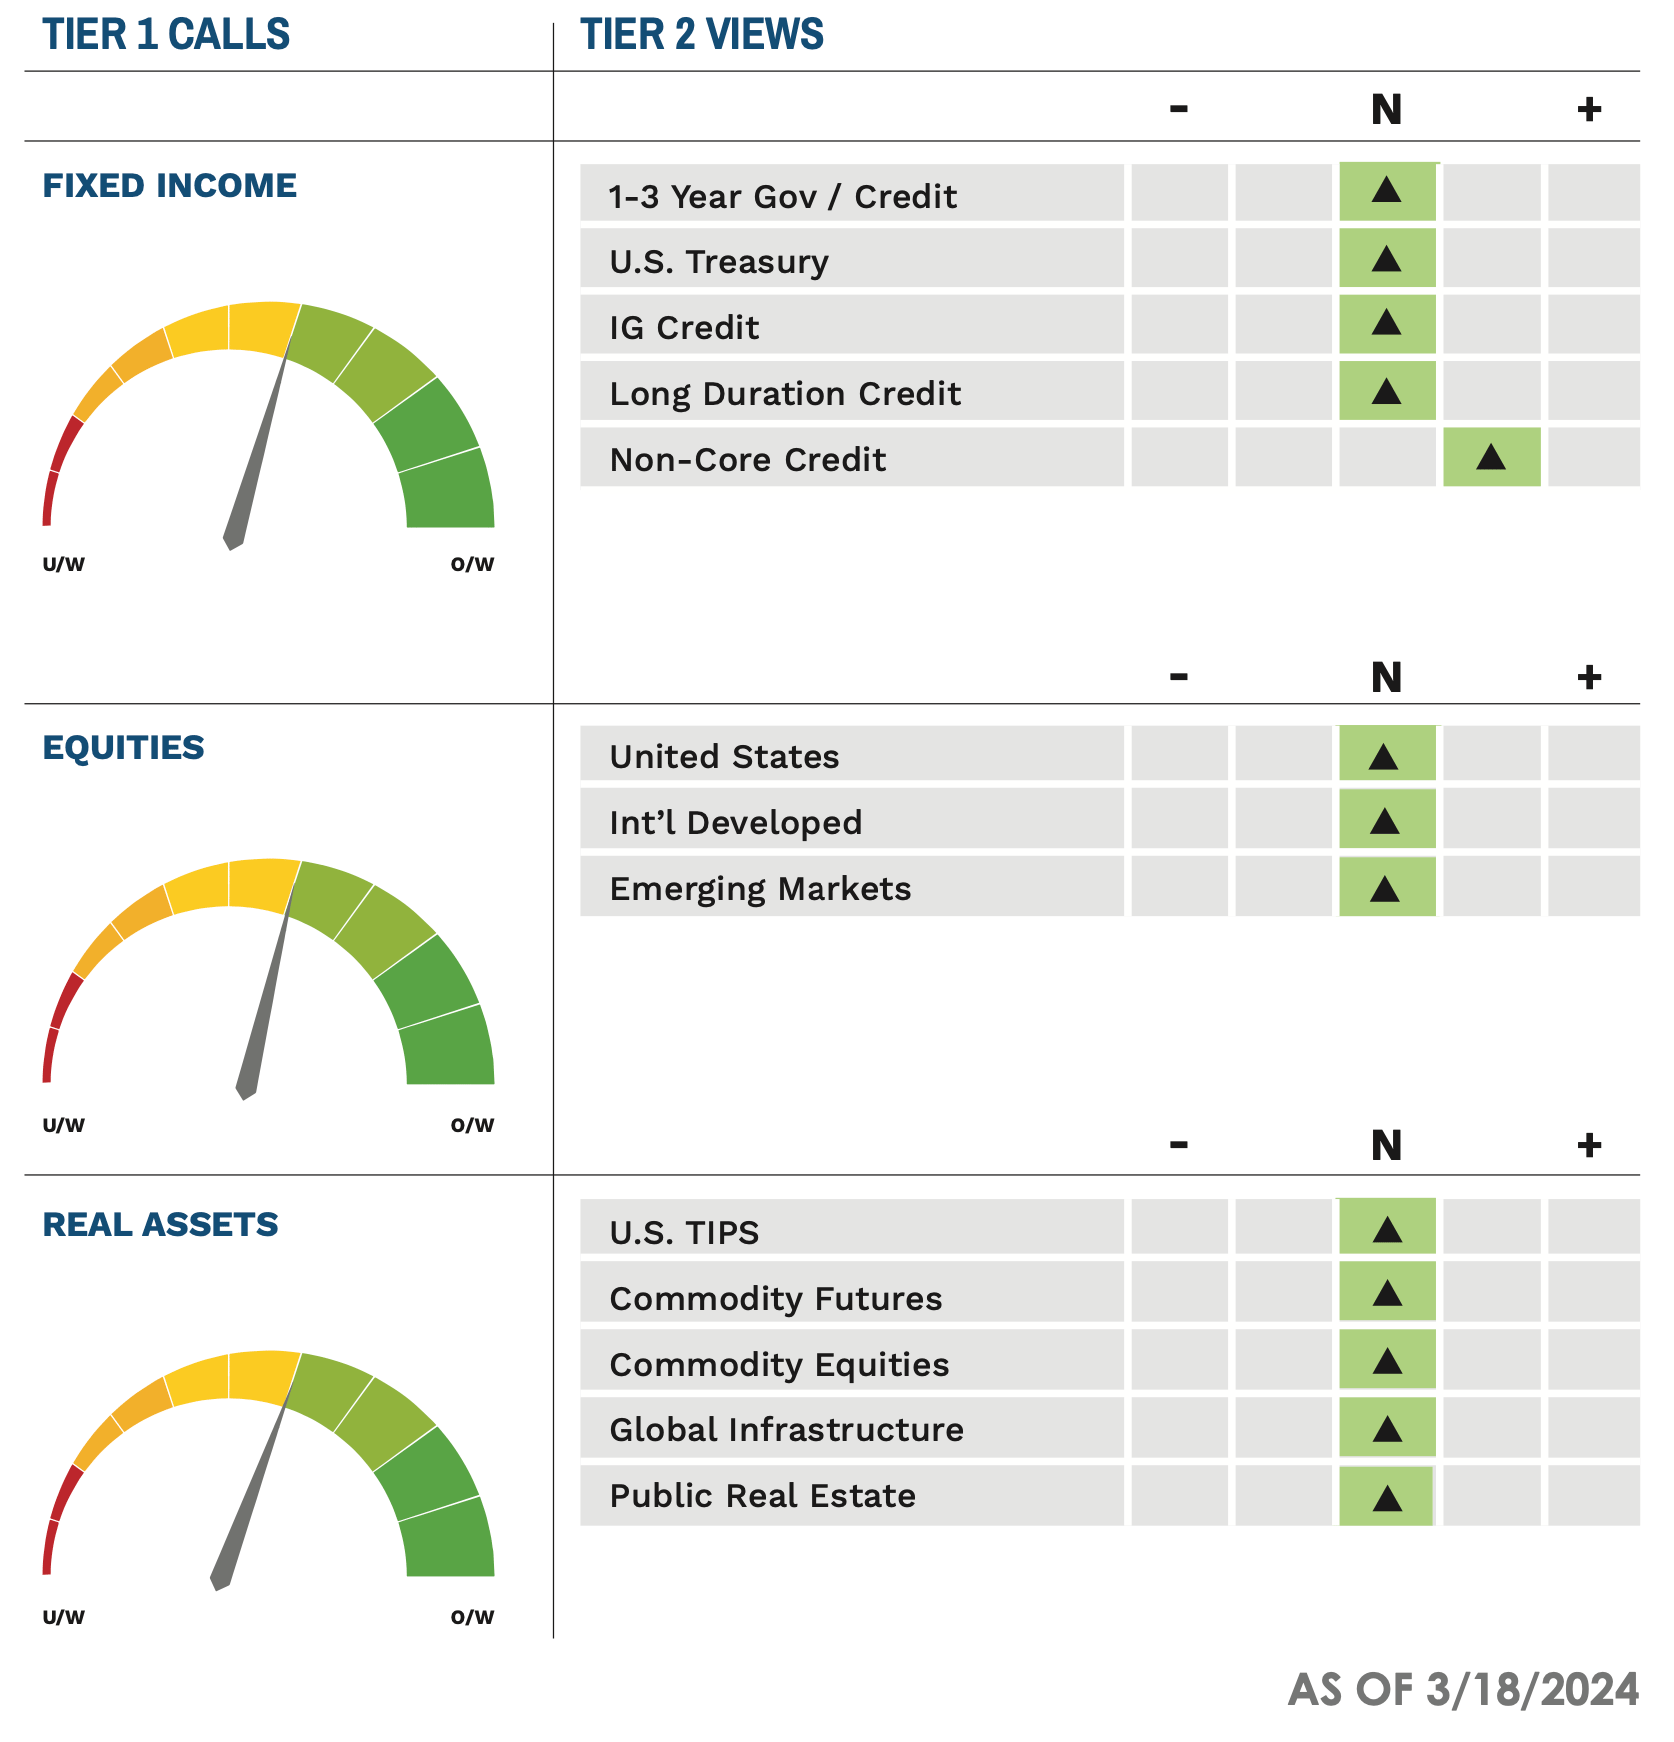
As of 03/18/2024