
Download Asset Allocation | March 2022
Cash Rules Everything Around Me
Economic Update
All the News Noise That’s Fit to Print
Regions Economic Division
Over the past several weeks, there has been considerable discussion of a “reacceleration” of U.S. economic growth in early 2023. While many have made note of this, few have been able to satisfactorily explain it, particularly given that it comes after the FOMC aggressively raised the Fed funds rate in 2022 and market interest rates followed suit. Some have argued that this is another illustration of the general rule that monetary policy works with long and variable lags, meaning that the full effects of the increases in interest rates seen in 2022 have yet to work their way through the economy. Others have argued that the reacceleration in economic growth is evidence that monetary policy is no longer as potent as it has been. Either way, almost across the board, the economic data for the month of January surprised to the upside, often in a big way, including the data on employment, personal income, consumer spending, and business investment in equipment and machinery.
Our question isn’t so much why the pace of growth picked up so strongly in January, but instead whether the pace of growth really picked up to anywhere near the extent suggested by the economic data for the month of January. Recall that, as originally reported, nonfarm employment rose by 517,000 jobs in January, private sector labor earnings rose by over 1.0%, and total retail sales rose by 3.0%. Even business orders for core capital goods, an early indicator of business investment in equipment and machinery as reported in the GDP data, surprisingly reversed several months of weakness, and rose by 0.8%. Along with revised data from the Consumer Price Index (CPI) showing faster inflation over Q4 2022 than had previously been reported, the “strong” January data significantly altered market participants’ expectations of the path of the Fed funds rate, particularly given that many FOMC members have discussed how the strength in the economic data may necessitate a more aggressive trajectory of funds rate hikes than seemed warranted at year-end 2022.
If the numbers cited above seem too good to be true, that’s because they pretty much are. As a first step in understanding why, recall that in any given year there is typically a pronounced lull in the pace of activity across a wide swath of the economy in January. For instance, seasonal workers hired during the previous holiday season are let go, while consumer spending slows sharply after the holiday season splurge and winter weather acts as a meaningful drag on construction activity, to name but a few of the more obvious examples. To be sure, January is not the only time in any given year in which there tend to be pronounced shifts in patterns of economic activity, with major holidays, the start/end of the school year, and changes in calendar seasons typically bringing about such shifts, sometimes adding to, sometimes deducting from, economic activity. If not accounted for, these shifts would make it difficult, if not impossible, to make accurate and timely assessments of the underlying health of the economy, but seasonal adjustment is designed to allow us to do just that. Think of it as segregating the typical cyclical deviations from the underlying trends, with the trends painting a reliable picture of the state of the economy.
That is only true, however, when economic activity adheres to those “typical” seasonal patterns. When that is not the case, the seasonally adjusted data can paint a misleading picture of the state of the economy. We think this is the main factor behind the “strong” January economic data, as this January’s lull in economic activity was decidedly less pronounced than is typically the case for the month. For instance, on a not seasonally adjusted basis, total nonfarm employment declined by 1.61% this January, which is not only smaller than the average January decline but is the smallest January decline in any year over the 1990-2023 period. Over the prior five years, the average January decline in unadjusted nonfarm employment was 1.91%, and if there doesn’t seem to be a dramatic difference between a 1.61% decline and a 1.91% decline, keep in mind that we’re talking about a base of more than 150 million jobs. As such, a “typical” January would have seen unadjusted nonfarm payrolls decline by around 500,000 more jobs than was the case this year, meaning the increase in employment on a seasonally adjusted basis would have been well short of the increase – 517,000 jobs – originally reported for January.
We can make the same comparison with almost all the January data, i.e., January declines in the not seasonally adjusted data that were smaller, often much smaller, than the typical January declines, which led to misleadingly large increases on a seasonally adjusted basis. While one could argue the less pronounced lull in activity in January was itself proof that the U.S. economy had, despite the odds, strengthened at the start of 2023, we think it has more to do with the fact that the seasonal pickup in economic activity over the final several weeks of 2022 was not nearly as strong as would typically have been the case.
Indeed, as we have often noted, what had historically been typical seasonal patterns in economic activity have been significantly disrupted since the onset of the pandemic, which in part reflects the effects of the policy response to the pandemic that continue to linger even as COVID-19 itself is much less of a disruption to the economy than it was in 2020 and 2021. These distortions can still be seen across a wide swath of the economic data. At the same time, atypical weather patterns, perhaps the most common source of seasonal adjustment noise, continue to have an impact, as evidenced in the February employment report. Atypically mild winter weather bolstered hiring in construction and leisure and hospitality services, but these outsized increases in February set the stage for hiring in March to be weaker than it otherwise would be.
The question of whether, or to what extent, seasonal adjustment issues are resulting in the economic data appearing much stronger than it is is not merely academic. After all, it is the seasonally adjusted headline numbers that many, if not most, analysts, market participants, and perhaps policy makers are reacting to, and which are the basis for almost all media accounts of the economic data. Our practice, however, has always been to examine the patterns in the not seasonally adjusted data, which we see as the most reliable gauge of the underlying health of the economy. On that basis, the U.S. economy doesn’t look much different now than it has over the past several months.
Sources: U.S. Bureau of Economic Analysis; U.S. Bureau of Labor Statistics
Investment Strategy Update
March has picked up where February left off, with a downward bias to equity prices amid rising volatility, but for largely unforeseen or underappreciated reasons. This has been unsettling for investors and may weigh on sentiment and risk appetite for months to come. Throughout February, stocks sold off due to rising sovereign bond yields and a strengthening U.S. dollar. Both bonds and the dollar have reversed course in March with yields moving sharply lower and the dollar weakening, and these moves have been for the wrong reasons, i.e., liquidity concerns surrounding the banking sector spurring a flight to safety. While it is common for market participants to sell first and ask questions later, an approach to asset allocation that is measured and long-term focused should ultimately be rewarded, despite what may remain a bumpy road for stocks near-term.
Even as uncertainty surrounding liquidity in the financial services sector has dominated discussions in March, it is notable that the S&P 500 still traded at 18.5X estimated 2023 earnings at the time of this writing. The negative economic and earnings implications stemming from stickier inflation and higher-for-longer interest rates have been underappreciated. Today, with liquidity concerns swirling around certain institutions in the financial services sector, lending standards are likely to tighten, and in short order, leading to fewer loans being made, which will ultimately feed into lowered expectations for earnings and economic growth. With the range of potential economic growth and earnings outcomes likely to widen and skew downward due to potential changes/shifts in banking business models in response to liquidity concerns, either recent hot inflation data must prove anomalous, allowing central banks to pivot away from further tightening of monetary policies, or equity valuations need to fall to account for tighter monetary conditions and lower money supply.
The monetary policy endgame may be altered to some degree by the Silicon Valley Bank (SVB) situation and related financial stability concerns that have arisen. However, higher-for-longer interest rates in the U.S. and abroad will likely still be required to combat inflation, posing a formidable headwind for the global economy and equity valuations, while likely capping near-term upside for risk assets.
Against this backdrop, we continue to hold a defensive position in portfolios with a bias to shorter-duration bonds and select alternatives in lieu of stocks. Within our Highland Diffusion Index, we’ve seen improvement in some market-based indicators as high beta segments like credit spreads and momentum have rallied since the start of the year. However, at the time of this writing, credit indicators have reverted above their 12-month average with stress also reflected in the equity momentum, mirroring the fluidity of the current market environment. Economic-based indicators effectively counteract the market-based indicators and continued labor market strength with all subsets, save for Cap Goods New Orders, entrenched in risk-off territory. The most interesting development is related to the yield curve metrics, with the 10-year and 30-year inversion resulting in the framework’s lowest curve score since 2006.
Fixed Income Market Update
Shorter-Duration, Higher-Quality Corporates Continue to Hold Appeal
Sovereign bond yields across the globe – with Japan a notable outlier – were making year-to-date highs as February concluded. In Europe, yields on 10-year U.K. gilts approached 3.85%, a level last seen in October of 2022 amid a panic by pension funds to sell long-dated bonds as buyers dried up. Yields on 10-year German bunds rose to 2.70%, a level last seen in 2011 as hotter than expected February inflation data out of France, Germany, and Spain led to calls for the European Central Bank (ECB) to hike key interest rates by a more aggressive half-point when it met in March. The ECB ultimately followed through with a 50-basis point hike to combat still elevated inflation but did not issue forward guidance as it sought to leave its options open. U.S. Treasury yields rose alongside sovereign yields in the U.K. and euro area as January inflation data stateside also came in hotter than expected, leading Fed funds futures to price in a higher terminal Fed funds rate and push out interest rate cuts from late 2023 into 2024. However, a resilient labor market and inflation stickiness took a backseat to the health of the U.S. financial system in early March, leading to a seismic shift in expectations for the path forward for monetary policy.
Silicon Valley Bank (SVB), formerly a top-20 U.S. bank by assets, experienced sizable deposit outflows over just a few days’ time from venture capital (VC)-backed early-stage companies, a group that made up the lion’s share of its customer and deposit base. To meet deposit withdrawals, the bank was forced to sell holdings of Treasury and mortgage-backed securities (MBS) at prices below where they were carrying them on their balance sheet, which led to capital shortfall concerns. After the bank was unable to raise equity capital, it tried to sell itself, a move that also failed and the bank fell into FDIC receivership. In the wake of the failure of SVB and Signature Bank of New York also entering FDIC receivership, questions arose as to whether the liquidity issues troubling these two specific institutions were emblematic of what the broader banking industry was experiencing. Given what we know of SVB and Signature’s customer and geographic concentrations, we believe these to be firm-specific issues and not indicative of a broader issue plaguing the banking space.
With that said, the FOMC now finds itself in an even more precarious situation when it meets in March as hiking the Fed funds rate by a half-point would increase the risk of an even more abrupt economic slowdown as money supply is already likely to contract as banks tighten lending standards and raise deposit rates in response to SVB’s downfall. On the other side of the coin, failing to hike at all given recent inflation and labor market data could lead to upward pressure on yields across the Treasury curve as inflation expectations become entrenched and even more difficult to reverse. We believe the demise of SVB, and Signature Bank has removed any chance of a half-point hike to the Fed funds rate this month and view a 25-basis point hike as our base-case as the stability of the banking system outweighs a string of hotter inflation and labor market readings.
The upward lift in global sovereign yields throughout February pressured longer-duration bonds while leaving lower-quality pockets of the fixed-income market less negatively impacted. Case in point: While the investment-grade (IG) Bloomberg Corporate index fell 3.2% during the month, the Bloomberg U.S. High Yield (HY) index fared far better, giving back just 1.3% due to the shorter-duration profile of the index. However, March has been far more kind to “quality” as Treasury yields have moved lower risk-off amid SVB’s liquidity concerns, and if lending standards tighten and the likelihood of a recession rises, we would rather be in higher-quality investment-grade corporates relative to high-yield corporates with a similar duration profile.
Sources: Bloomberg; Goldman Sachs; NCREIF; Green Street
Highland Associates Cross Asset Views
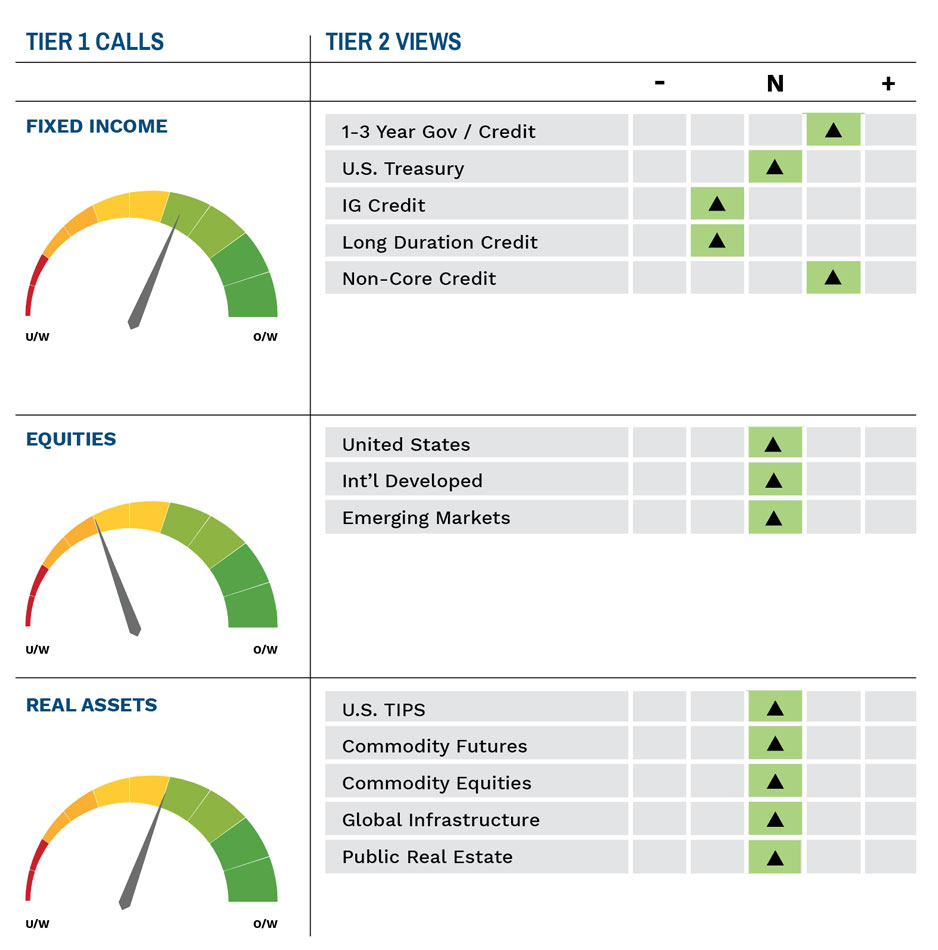
As of March 20, 2023
IMPORTANT DISCLOSURES: This publication has been prepared by the staff of Highland Associates, Inc. for distribution to, among others, Highland Associates, Inc. clients. Highland Associates is registered with the United States Security and Exchange Commission under the Investment Advisors Act of 1940. Highland Associates is a wholly owned subsidiary of Regions Bank, which in turn is a wholly owned subsidiary of Regions Financial Corporation. Research services are provided through Multi-Asset Solutions, a department of the Regions Asset Management business group within Regions Bank. The information and material contained herein is provided solely for general information purposes only. To the extent these materials reference Regions Bank data, such materials are not intended to be reflective or indicative of, and should not be relied upon as, the results of operations, financial conditions or performance of Regions Bank. Unless otherwise specifically stated, any views, opinions, analyses, estimates and strategies, as the case may be (“views”), expressed in this content are those of the respective authors and speakers named in those pieces and may differ from those of Regions Bank and/or other Regions Bank employees and affiliates. Views and estimates constitute our judgment as of the date of these materials, are often based on current market conditions, and are subject to change without notice. Any examples used are generic, hypothetical and for illustration purposes only. Any prices/quotes/statistics included have been obtained from sources believed to be reliable, but Highland Associates, Inc. does not warrant their completeness or accuracy. This information in no way constitutes research and should not be treated as such. The views expressed herein should not be construed as individual investment advice for any particular person or entity and are not intended as recommendations of particular securities, financial instruments, strategies or banking services for a particular person or entity. The names and marks of other companies or their services or products may be the trademarks of their owners and are used only to identify such companies or their services or products and not to indicate endorsement, sponsorship, or ownership by Regions or Highland Associates. Employees of Highland Associates, Inc., may have positions in securities or their derivatives that may be mentioned in this report. Additionally, Highland’s clients and companies affiliated with Highland Associates may hold positions in the mentioned companies in their portfolios or strategies. This material does not constitute an offer or an invitation by or on behalf of Highland Associates to any person or entity to buy or sell any security or financial instrument or engage in any banking service. Nothing in these materials constitutes investment, legal, accounting or tax advice. Non-deposit products including investments, securities, mutual funds, insurance products, crypto assets and annuities: Are Not FDIC-Insured I Are Not a Deposit I May Go Down in Value I Are Not Bank Guaranteed I Are Not Insured by Any Federal Government Agency I Are Not a Condition of Any Banking Activity.
Neither Regions Bank nor Regions Asset Management (collectively, “Regions”) are registered municipal advisors nor provide advice to municipal entities or obligated persons with respect to municipal financial products or the issuance of municipal securities (including regarding the structure, timing, terms and similar matters concerning municipal financial products or municipal securities issuances) or engage in the solicitation of municipal entities or obligated persons for such services. With respect to this presentation and any other information, materials or communications provided by Regions, (a) Regions is not recommending an action to any municipal entity or obligated person, (b) Regions is not acting as an advisor to any municipal entity or obligated person and does not owe a fiduciary duty pursuant to Section 15B of the Securities Exchange Act of 1934 to any municipal entity or obligated person with respect to such presentation, information, materials or communications, (c) Regions is acting for its own interests, and (d) you should discuss this presentation and any such other information, materials or communications with any and all internal and external advisors and experts that you deem appropriate before acting on this presentation or any such other information, materials or communications.
Source: Bloomberg Index Services Limited. BLOOMBERG® is a trademark and service mark of Bloomberg Finance L.P. and its affiliates (collectively “Bloomberg”). BARCLAYS® is a trademark and service mark of Barclays Bank Plc (collectively with its affiliates, “Barclays”), used under license. Bloomberg or Bloomberg’s licensors, including Barclays, own all proprietary rights in the Bloomberg Barclays Indices. Neither Bloomberg nor Barclays approves or endorses this material or guarantees the accuracy or completeness of any information herein, or makes any warranty, express or implied, as to the results to be obtained therefrom and, to the maximum extent allowed by law, neither shall have any liability or responsibility for injury or damages arising in connection therewith.