
Download Asset Allocation | June 2023
Learning to Fly
Economic Update
What a Difference a Month Doesn’t Make
Regions Economic Division
The general theme of our May economic commentary was that decidedly mixed messages in the economic data were making it difficult to pin down where the U.S. economy is, let alone forecast where it is going. While it would have been foolish to think that another month’s worth of data would provide any clear answers, it also would have been reasonable to think, or at least hope, that another month’s worth of data would at least show more of the top-tier indicators pointing in the same direction. Instead, not only have we been treated to another month of many of the top-tier indicators pointing in opposite directions, but we’ve also seen contradictory messages within the same data releases. As would be expected with the current state and future path of the U.S. economy so open to interpretation, the financial markets have remained notably volatile, with sharp swings in equity prices and yields on U.S. Treasury securities. Amid this backdrop, the Federal Open Market Committee (FOMC) is set to convene for their June meeting, with the divisions within the Committee over the appropriate course of monetary policy as stark as those in much of the top-tier economic data.
The second estimate from the U.S. Bureau of Economic Analysis (BEA) shows real GDP grew at an annual rate of 1.3% in Q1, up slightly from the initial estimate of 1.1%. More noteworthy, however, is that the BEA also released their initial estimate of Q1 corporate profits, which covers a much wider range of firms than the more familiar S&P 500 measure of profits. The BEA reported that corporate profits fell by 5.1% in Q1, the third straight quarterly decline. Profits from both domestic and foreign operations declined in Q1, as did profits in both the financial and nonfinancial sectors, the first instance of this inglorious grand slam since Q4 2008.
The ongoing slide in profits has led to compression in profit margins to the point that, excluding Q1 2020, after-tax margins are at their lowest point since Q4 2015, and before-tax margins are at their lowest point since Q3 2009. Moreover, our baseline forecast anticipates further compression in the quarters ahead as growth in top-line revenue slows at a faster rate than we expect growth in input costs, including labor, to slow. Our view is that the ongoing slide in profits has contributed to weakening business fixed investment over recent quarters, particularly in outlays on equipment and machinery, which have been a drag on real GDP growth in three of the past four quarters. Empirical evidence shows business investment to be much more sensitive to profits than to interest rates, and weakening business investment has reflected firms scaling down expectations of growth.
Consumers aren’t exactly feeling upbeat about the economy, at least judging by The Conference Board’s measure of consumer confidence and the University of Michigan’s measure of consumer sentiment. After having shown signs of improvement from the sharp declines triggered by a prolonged period of elevated inflation, both measures have again turned lower over the past two months. While this could reflect the effects of a seemingly constant barrage of crisis headlines (banking crisis, debt ceiling crisis) on consumers still on edge thanks to the cumulative effects of higher inflation and higher interest rates, measures of consumer moods are nonetheless at levels that in the past have been associated with recessions. Depressed sentiment and tapped-out consumers are key elements of narratives offered to account for the recent spate of disappointing earnings reports from retailers running the gamut from discount to luxury retailers.
While such narratives may sound plausible, they are dramatically at odds with measures of household financial conditions and with a labor market that remains tight despite having cooled somewhat. For instance, though down from a peak of over $2 trillion in mid-2021, the level of excess savings on household balance sheets nonetheless remains substantial, with our estimate putting it at just over $900 billion as of April. Although off the all-time lows seen in 2020 and 2021, monthly debt service burdens remain easily below pre-pandemic norms, indicating the degree to which the preponderance of fixed-rate debt on household balance sheets has cushioned the impact of higher interest rates. While credit card debt has grown at a rapid pace over recent months, card utilization rates and card balances as a percentage of disposable personal income also remain well below pre-pandemic norms. To be sure, households in different income buckets face varying degrees of financial stress, but, overall, consumers are not lacking the wherewithal to spend, even if they are lacking the will.
The May employment report is a study in confounding contradictions. Nonfarm payrolls rose by 339,000 jobs in May, far stronger than expected, with private sector payrolls up by 283,000 jobs. Moreover, prior estimates of job growth in March and April were revised up by a net 93,000 jobs for the two-month period. What went largely unnoticed, however, is that the response rate to the May establishment survey was 54.7%, extraordinarily low even in the post-pandemic period in which survey response rates have been well below pre-pandemic norms, and the lowest May response rate since 2001. Moreover, a decline in the average length of the workweek led to a decline in aggregate private sector hours worked in May despite private sector payrolls having risen by 283,000 jobs. Changes in aggregate hours are, in any given period, a much more relevant indicator of the change in aggregate economic output. And, in stark contrast to the reported increase in nonfarm employment, the measure of household employment fell by 310,000 persons in May, pushing the unemployment rate up to 3.7% from 3.4% in April.
Although moderation in food and energy price increases has pushed headline inflation lower, core inflation remains frustratingly persistent, with each measure still far above the FOMC’s 2.0% target. While slower, wage growth nonetheless remains faster than many FOMC members would associate with their 2.0% inflation target. The contradictions in the inflation data and the overall body of economic data have left the FOMC sharply divided ahead of this month’s meeting. Several members are on record as seeing further Fed funds rate hikes as warranted to help push inflation down further, while several members are on record as seeing it appropriate to stand pat to allow for more time to assess the cumulative effects of the substantial increase in interest rates seen to date. In keeping with our general theme, however, anyone waiting for a clear picture of the U.S. economy to emerge may be waiting quite a long time.
Be that as it may, we expect the “pause” camp to win out at this month’s meeting. Keep in mind that the June FOMC meeting brings the release of Committee members’ updated economic and financial projections, including an updated dot plot. The updated dot plot will reflect the significant number of FOMC members seeing further rate hikes as appropriate and, even if there is no June rate hike, the post-meeting policy statement will likely stress the collective willingness of the Committee to raise the funds rate further absent evidence of meaningful progress in pushing core inflation down. This is a point Chair Powell will surely stress in his post-meeting press conference whether there is a June rate hike or not. Against a backdrop of mixed signals in the economic data and a divided FOMC, the considerable volatility seen in equity and fixed income markets over the past several months is likely to be with us for some time to come.
Sources: U.S. Bureau of Economic Analysis; U.S. Bureau of Labor Statistics; The Conference Board; University of Michigan
Investment Strategy Update
Regions Multi-Asset Solutions, Highland Associates
Domestic large-cap stocks closed out May close to a year-to-date high as a flood of capital into companies tied to artificial intelligence (AI) propelled the S&P 500 information technology sector to a 9% monthly surge. Through May, the communication services and information technology sectors were higher by 32.2% and 33.3%, respectively, year-to-date. Both sectors garnered inflows from January through April as market participants allocated capital toward the largest, highest quality companies with the best balance sheets viewed as capable of weathering an economic downturn or recession. But over the back-half of May, technology companies tied to AI were viewed as “must own” secular growth stocks and saw their share prices go skyward as investors feared missing out on additional, potentially sizable gains. The AI movement is in its infancy and will provide many companies with a productivity tailwind over coming years, but we become suspicious when shares rally based solely on how many times a management team mentions “AI” on their conference call, with little regard for how their company plans to leverage and profit from the technology. Investors seeking safety may continue to crowd into the “Big 5” of Alphabet, Amazon, Apple, Microsoft, and Nvidia, which taken together account for 24% of the S&P 500. Despite the strong performance in many of these large-cap technology companies, the S&P 500 was only able to eke out a 0.2% price gain in May and ended the month trading around prior resistance at 4,200, which leads us to question how much gas may be left in the tank for domestic large-cap stocks. Market breadth remained narrow in May with cyclical sectors and domestic small-cap stocks continuing to lag.
Euro Area Equity Rally Stalls as Economic Headwinds Build; Emerging Markets Rudderless Without China
Euro area equity indices skew toward economically sensitive and/or value-oriented sectors such as consumer discretionary, consumer staples, financial services, healthcare, and industrials, all of which rebounded meaningfully as the euro area economy sidestepped a potentially catastrophic energy crisis due to a warmer winter. However, during May, the MSCI EAFE index fell 3.8% and lagged the S&P 500 due primarily to weaker economic data out of the euro area, which called into question the resiliency of the eurozone economy and, in turn, the more constructive tone surrounding the outlook for euro area corporate profits and equities that has been evident since October of last year. With both the Bank of England and European Central Bank likely to tighten monetary policy further over coming months amid elevated inflation, economic headwinds will likely continue to build.
Within the emerging markets, investor optimism surrounding a reopening of China’s economy from Covid lockdowns appears to have been unfounded. China’s economy has stalled, with activity in the country’s manufacturing sector slowing more than expected in May and external trade data for April falling well below estimates, all while the unemployment rate of those aged 16-to-24 rose to an all-time high of 20.4% in April. China’s faltering economy provides the government with cover to implement pro-growth policy shifts, but secular headwinds from rising unemployment amid the 16-to-24 cohort, along with demographic issues brought on by the country’s one-child policy in place until 2016, will hinder China’s ability to pivot to a consumer-based economy. Near-term, Chinese stocks could rally as the government intervenes, but any rebound could be short-lived.
Based on these near-term uncertainties both on the international and emerging markets front, we remain neutral relative to the MSCI World Index.
Investors Being Paid to Be Patient in Bonds
With Congress raising the debt ceiling, market participants can turn their attention toward potential market implications stemming from the deal. Estimates vary, but the U.S. Treasury is expected to issue north of $1T of bonds between now and the end of the third quarter, with around $500B to $700B of short-term T-bills expected to be issued to aid Treasury in replenishing its general account. Treasury will need to flood the market with short-term bonds to keep yields high enough to improve their relative appeal and attract buying interest from money market funds, which are the primary purchasers of shorter-term Treasuries. The FOMC remains open to further hikes in the Fed funds rate, and Fed funds futures have pushed rate cut expectations out into 2024, which, with an expected flood of T-bill issuance, is likely to keep short-term Treasury yields elevated through the summer, at a minimum. At the end of May, one-, three-, and six-month T-bills all carried a yield of over 5.25%, and higher short-term yields appear likely to stick around for a while.
While the implications of the debt ceiling deal for the short end of the Treasury curve appear straightforward, the potential impact on long-term yields is more nuanced. Ratings agencies like the estimated $1.5T in cuts to discretionary spending over the next decade, and with the debt ceiling raised until 2025, near-term downgrades to the U.S. government’s debt rating appear less likely than they did a month ago. On the other hand, Treasury issuance will rise, and with core inflation sticky and too high for the FOMC’s liking, potential upside for prices of long-dated U.S. Treasuries may be limited as well. Given our view that U.S. economic growth will slow over the back-half of 2023, we expect a downward bias to long-term Treasury yields over the balance of this year. Additionally, the fundamental outlook for investment-grade credit remains constructive as interest coverage ratios—or interest expense relative to corporate earnings before interest, taxes, depreciation, and amortization—remain superior to pre-pandemic levels despite higher interest rates. Neither investment-grade nor high-yield corporates are a fat pitch from a valuation perspective, as credit spreads remain tight relative to historical averages, but investment-grade corporates carry a relatively attractive yield and should hold up better if a challenging economic backdrop strains corporate profits.
We continue to hold a defensive position in portfolios with a bias to shorter-duration bonds and select alternatives. While we’ve seen some improvement in our Highland Diffusion Index in recent months, three of the six framework indicators continue to signal Risk-Off, including the more data-driven subsets like Economic, Monetary Policy, and Yield Curve. The market-based indicators like Momentum and Credit Spreads suggest Risk-On positioning that may be warranted in small amounts but poses asymmetric downside should rosy default expectations fail to hold up. The Employment indicator has remained Risk-On throughout this cycle, even being the lone positive indicator for much of the second half of 2022. However, ongoing job openings lead us to believe weakening labor trends are an increasing probability, a potential turning point in what has been the framework’s most stable indicator during this cycle.
Highland Associates Cross Asset Views
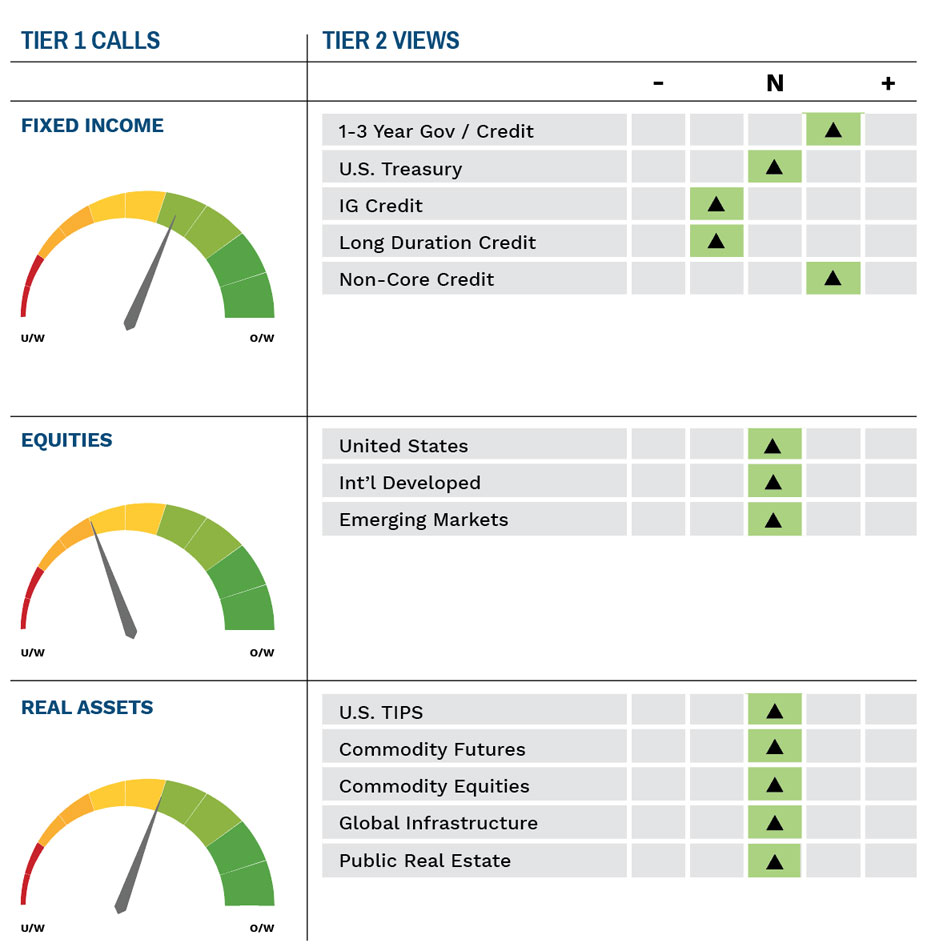
As of 6/09/2023
IMPORTANT DISCLOSURES: This publication has been prepared by the staff of Highland Associates, Inc. for distribution to, among others, Highland Associates, Inc. clients. Highland Associates is registered with the United States Security and Exchange Commission under the Investment Advisors Act of 1940. Highland Associates is a wholly owned subsidiary of Regions Bank, which in turn is a wholly owned subsidiary of Regions Financial Corporation. Research services are provided through Multi-Asset Solutions, a department of the Regions Asset Management business group within Regions Bank. The information and material contained herein is provided solely for general information purposes only. To the extent these materials reference Regions Bank data, such materials are not intended to be reflective or indicative of, and should not be relied upon as, the results of operations, financial conditions or performance of Regions Bank. Unless otherwise specifically stated, any views, opinions, analyses, estimates and strategies, as the case may be (“views”), expressed in this content are those of the respective authors and speakers named in those pieces and may differ from those of Regions Bank and/or other Regions Bank employees and affiliates. Views and estimates constitute our judgment as of the date of these materials, are often based on current market conditions, and are subject to change without notice. Any examples used are generic, hypothetical and for illustration purposes only. Any prices/quotes/statistics included have been obtained from sources believed to be reliable, but Highland Associates, Inc. does not warrant their completeness or accuracy. This information in no way constitutes research and should not be treated as such. The views expressed herein should not be construed as individual investment advice for any particular person or entity and are not intended as recommendations of particular securities, financial instruments, strategies or banking services for a particular person or entity. The names and marks of other companies or their services or products may be the trademarks of their owners and are used only to identify such companies or their services or products and not to indicate endorsement, sponsorship, or ownership by Regions or Highland Associates. Employees of Highland Associates, Inc., may have positions in securities or their derivatives that may be mentioned in this report. Additionally, Highland’s clients and companies affiliated with Highland Associates may hold positions in the mentioned companies in their portfolios or strategies. This material does not constitute an offer or an invitation by or on behalf of Highland Associates to any person or entity to buy or sell any security or financial instrument or engage in any banking service. Nothing in these materials constitutes investment, legal, accounting or tax advice. Non-deposit products including investments, securities, mutual funds, insurance products, crypto assets and annuities: Are Not FDIC-Insured I Are Not a Deposit I May Go Down in Value I Are Not Bank Guaranteed I Are Not Insured by Any Federal Government Agency I Are Not a Condition of Any Banking Activity.
Neither Regions Bank nor Regions Asset Management (collectively, “Regions”) are registered municipal advisors nor provide advice to municipal entities or obligated persons with respect to municipal financial products or the issuance of municipal securities (including regarding the structure, timing, terms and similar matters concerning municipal financial products or municipal securities issuances) or engage in the solicitation of municipal entities or obligated persons for such services. With respect to this presentation and any other information, materials or communications provided by Regions, (a) Regions is not recommending an action to any municipal entity or obligated person, (b) Regions is not acting as an advisor to any municipal entity or obligated person and does not owe a fiduciary duty pursuant to Section 15B of the Securities Exchange Act of 1934 to any municipal entity or obligated person with respect to such presentation, information, materials or communications, (c) Regions is acting for its own interests, and (d) you should discuss this presentation and any such other information, materials or communications with any and all internal and external advisors and experts that you deem appropriate before acting on this presentation or any such other information, materials or communications.
Source: Bloomberg Index Services Limited. BLOOMBERG® is a trademark and service mark of Bloomberg Finance L.P. and its affiliates (collectively “Bloomberg”). BARCLAYS® is a trademark and service mark of Barclays Bank Plc (collectively with its affiliates, “Barclays”), used under license. Bloomberg or Bloomberg’s licensors, including Barclays, own all proprietary rights in the Bloomberg Barclays Indices. Neither Bloomberg nor Barclays approves or endorses this material or guarantees the accuracy or completeness of any information herein, or makes any warranty, express or implied, as to the results to be obtained therefrom and, to the maximum extent allowed by law, neither shall have any liability or responsibility for injury or damages arising in connection therewith.