
Download Asset Allocation | July 2025
Clocks
Economic Update
Tariff Concerns Dominate
By Regions Economic Division
July, long known as the peak of summer heat and celebration, had no shortage of fireworks this year. This July also brought a new tax bill and tariff announcements capable of reshaping the economic landscape. President Trump signed the “Big, Beautiful Bill” into law on our nation’s birthday, projected to add between one and three trillion dollars to our federal debt over the coming decade. While math typically resists partisanship, the divergent projections reveal ideological divides on the impact of extending tax cuts. As new tariffs are once again announced, investors and markets have been more accepting of tariffs than countries. Negotiations intensify as many begin to feel the closing walls and ticking clocks, as Coldplay once sang.
In the summer heat, some alliances and trends in the data have begun to shift. Russia and China come out of things unsaid; both unwilling to provide anything other than moral support to Iran following the U.S. bombing. The most recent CPI announcement has also shown some signs of potential re-acceleration in inflation, and the economy continues to digest distortions from the pull-forward in demand earlier this year. As U.S. equity markets make new highs daily and recent IPOs soar, those that reduced risk earlier in the year curse missed opportunities. Will equity markets remain resilient in the face of renewed tariffs? Or will inflation and an expected slowing of demand make a more meaningful impact on portfolios?
Over the past few months, we’ve discussed the various ways in which the economic data have been impacted by changes in tariff rates. This includes the anticipation of higher tariff rates, increases in tariff rates being implemented, and continued uncertainty around where tariff rates will ultimately settle, assuming that at some point tariff rates do actually settle. Much of this was reflected in the Q1 GDP data; while a spike in business investment in equipment and machinery and a sizable build in nonfarm business inventories were supportive, a surge in imports of goods resulted in the trade deficit widening to the point that it knocked almost five percentage points off the quarterly change in real GDP.
Having previously gone into some detail; we won’t repeat those discussions here. But, as much of the monthly data continues to reflect either payback from decisions taken by firms and households earlier this year or reactions to ongoing changes in trade policy, we do think it is worth continuing to note where we see – or don’t see – the data being impacted and how that, in turn, shapes our thinking on real GDP growth over the middle two quarters of 2025. In some cases, the data is behaving as we’ve anticipated, in other cases, not so much. Either way, we see the net result being more a matter of determining whether certain activity falls into the Q2 or the Q3 data as opposed to changing our outlook for subsequent quarters.
One series behaving in line with our expectations is unit sales of new motor vehicles. Recall that March and April saw the fastest monthly sales rates in four years, reflecting consumer and business purchases being pulled forward to avoid tariff-related price hikes at a time when manufacturers were holding the line on pricing rather than raising prices to reflect higher tariffs, some already in place. Those monthly sales rates, however, were clearly not sustainable, and we expected to see payback, starting with the May data. That has proven to be the case; sales fell from annual rates of 17.8 million units in March and 17.3 million units in April to annual rates of 15.6% in May and 15.3 million units in June, and we look for a further slowdown in the July data.
It is worth noting that despite the clear slowing in sales in May and June, April’s sales rate was high enough that, on a quarterly average basis, the bigger impact will be seen in the Q3 GDP data rather than in the Q2 data. To that point, our forecast anticipates a steep decline in real spending on consumer durable goods not in Q2 but in Q3, which is reflected in our forecast for growth in total consumer spending. Note that the consumer durables category also includes items such as furniture, appliances, and electronics, and that patterns in spending on some of these items have been similar to patterns in motor vehicle sales. To the extent that we continue to see payback in goods spending over the coming months, it will be important to recognize it for what it is rather than to mistake it for a fundamental weakening in consumer spending, as some have already been prone to do.
One data series that hasn’t exactly stuck to script, at least our script, is imports of goods. Recall that imports of goods into the U.S. grew at an annual rate of 51.6% in Q1 after accounting for price changes. As noted above, this was a powerful drag on Q1 real GDP growth. The real imports of goods fell by 20% in April, the largest monthly decline on record, was in line with our expectation of significant payback in the Q2 data. But, while we had anticipated further payback in the May and June data, an easing of trade tensions with China led to a sharp, and sudden, reversal in shipping volumes from China to the U.S., in part reflecting retailers rushing to pull holiday season orders forward from when they would typically be placed. This is one reason real imports of goods were just down 0.1% in May, a much smaller decline than we anticipated, and why we now expect an increase in June and can’t rule out a further increase in July.
Note that imports are holding up better than anticipated in Q2 and will work against Q2 real GDP growth. That said, the trade deficit will still be much smaller in Q2 than was the case in Q1, meaning that net exports will be additive to Q2 real GDP growth. Moreover, along with higher import volumes will come a larger build in nonfarm business inventories in Q2 than we had previously anticipated, which will work to the good of Q2 real GDP growth. We’ll add a caveat here, which is that to the extent orders for holiday season merchandise were pulled forward, imports in the months typically bolstered by holiday season orders – August through October – will be weaker than is typically the case for those months in the not seasonally adjusted data. This means that on a seasonally adjusted basis, imports of goods will be made to look much weaker. Given that it is the seasonally adjusted data that flows into the GDP data, the Q3 trade deficit could look much narrower than will actually be the case, which would make Q3 real GDP growth look stronger than would actually be the case.
Another series that has surprised us is orders for “core” capital goods – nondefense capital goods excluding aircraft and parts. This series is an early indicator of business investment in equipment and machinery in the GDP data. Core capital goods orders were notably strong in Q1, which to some extent reflected firms pulling orders forward to avoid higher prices later in 2025. Again, we expected the Q2 data to bring payback for the outsized increase in Q1, so the 1.5% decline in core capital goods orders seen in April wasn’t exactly a surprise. What was surprising, however, is that core capital goods orders bounced back strongly in May, up 1.7% according to the preliminary estimate, whereas we had anticipated a further pullback. To be sure, this series can be highly volatile from one month to the next but, even so, the preliminary May estimate suggests that real business investment in equipment and machinery, which rose at an annual rate of 23.7% in Q1, may not drop as sharply over the next few quarters as we’d anticipated. As a side note, the renewed provision for the immediate expensing of such investment could further bolster business investment over the back half of 2025 and into early-2026 assuming some clarity on trade policy, which would be additive to real GDP growth.
One place we’ve yet to see substantive and broadly based impacts of higher tariffs is the data on prices of final consumer goods, as neither the data from the Consumer Price Index (CPI) nor the PCE Deflator (the FOMC’s preferred gauge of price changes) have, at least thus far, offered compelling evidence of tariff pass-through. This does not, of course, mean that any such pass-through isn’t coming, just that it hasn’t come yet. But tariff revenues came in at roughly $69.4 billion in Q2, and if consumers are not bearing that burden, then either importers, wholesalers, manufacturers, or retailers are, meaning it is coming out of margins. We would not, however, expect that to remain the case, particularly as we are at the end of the first ninety-day window for the delay in the most punitive tariffs announced on April 2. While we expect the monthly CPI and PCE Deflator data to show more substantive and more broadly based increases in goods prices, we’ll again note that we expect faster services price disinflation to act as a strong offset in terms of the overall inflation rates.
Again, we think it is worth offering these recaps given that the monthly data remains somewhat volatile and that much of this volatility stems from changes, actual or anticipated, in trade policy. As such, there remains a good deal of play in our forecasts for real GDP growth over the middle two quarters of 2025, and we can’t rule out these effects from impacting the Q4 data. Either way, by year-end 2025 we continue to expect the economy to be back on a path toward what we see as the longer-term trend rates of growth in real GDP and real private domestic demand.
Sources: Bureau of Economic Analysis; Bureau of Labor Statistics; U.S. Census Bureau
Investment Strategy Update
Regions Multi-Asset Solutions & Highland Associates
Stocks: Seasonality and Policy Awakening Animal Spirits
After the draconian 18.9% decline to start the second quarter, the S&P 500 recovered those losses and more to record a 10.9% gain from April to June, its sixth best calendar quarter in the last 10 years. The S&P 500 and tech-centric NASDAQ 100 advanced by 5.1% and 6.3% respectively in June, surpassing their February all-time highs, with the NASDAQ making a definitive break out in the final week of the month. Sentiment in markets couldn’t be further from the April lows, as expectations of a resolution on trade and tax policy have year-to-date laggards including small- and mid-cap equities playing catchup early in July. The turn-around in equity markets has proven remarkable with July setting up to be more of the same if tariffs meet the market expectations, but rising valuations make for more fragile markets as liquidity fades into the fall.
The technical backdrop provides further confidence in the durability of the recent rally, as the S&P 500 was able to surpass the 5,900 level that stood as resistance in May, retested that mark, turned it into support and created a base to run past the 6,144 February top. The current index price at $6,278 is slightly overbought at present, creating room for a healthy throwback to the $6,100 level that would turn prior all-time highs into new support. Market participants also get a fresh look at equity fundamentals in July as the earnings season kicks off. Considering second quarter expectations have fallen 6% since the start of the year, companies could be set to surprise to the upside, especially if accompanied by improvements in forward guidance.
The trade ‘truce’ between the U.S. and China in June activated animal spirits, as markets are wagering the pause in U.S. tariffs eventually come to a beneficial conclusion for even the most heavily impacted companies. Trade deals have likely been less plentiful than most were hoping with only the U.K. and Vietnam finalizing trade agreements at the time of this writing, despite hearing multiple other pacts are in the final stages. The terms on these deals differ meaningfully, with the former landing at a 10% tariff and the latter taking on a 20% tariff. Markets seem to be latching onto the U.K. deal, but the Vietnam deal may be more instructive for forming expectations on most trade partners, as the U.K. seems to be the best-case scenario since they are one of the few trade partners where the U.S. maintains a trade surplus. Current risk asset pricing appears to be projecting a baseline tariff for all trade partners somewhere between the two deals with countries the administration views unfavorably-specifically China-subject to higher import taxes. Restoring a level of certainty on trade policy could firm up capex spending or prompt companies to strike up merger activity, which often coincides with strong IPO demand, a rising trend in recent months. On the internal policy front, the ‘Big, Beautiful Bill’ passed over July fourth weekend. The bill strikes us more as maintaining the status quo except for the new depreciation provision around capex that could be another tailwind for business investment and meaningfully lower the corporate tax rate, boosting earnings in the process. Directionally U.S. equities are starting the back half of 2025 on the right foot, provided the secular AI story and trade backdrop remain on par with market expectations.
Positive earnings surprises are driving midcaps. Small and mid-size equities found their way into favor towards the end of June, as cyclical and trade sensitive stocks outpaced broader U.S. benchmarks. Tariff-related developments served as the catalyst for an uptick in performance as the Russell 2500 index made 2.7% of its 4.6% monthly gain in the final week of June. Analyst expectations for smaller publicly traded companies have declined even more than the roughly 10% revision lower for large cap stocks since the start of the year. Historically, these abrupt revisions lower have the tendency to overestimate the actual declines in earnings, presenting an opportunity for well-run businesses to surprise to the upside.
Global equity exposure, as measured by the MSCI ACWI, outperformed domestic equities, as measured by the S&P 500, in the first half. This outperformance was largely driven by developed international exposure, but international leadership in equity markets is changing. In June, the MSCI EAFE experienced a notable decline in momentum, generating a 2.9% gain, while the MSCI Emerging Markets Equity index gained 6.6%. The de-escalation theme around trade was a substantial benefit as the U.S. and China’s trade ‘truce’ was a key event and general progress around tariffs is likely paramount for a full change of the guard abroad. Taking stock of the 19.9% international equities have recorded in 2025 through June, those projecting a repeat performance into the back half of the year may be disappointed unless the US dollar continues to weaken. On a dollar hedged basis, the MSCI EAFE has only posted an 8.8% gain that stands just 2.6% above the S&P 500 since the start of the year. Put differently, the decline in the U.S. dollar has contributed 11% to international equity performance year-to-date. While some may believe that the decline in the dollar could persist, there is plenty of data that suggests that dollar weakness may be overdone in the shorter term.
Without The US Dollar Decline, Foreign Developed Returns Resemble US Stocks

Source: Bloomberg
That first half decline in the dollar was the largest in over 30 years, and while historically outsized trends persist over the balance of the year, rising short exposure could result in a near-term bounce. If U.S. economic growth normalizes, the dollar may start to level out, taking depreciation anywhere near the magnitude we saw in the first two quarters off the table for now.
Fixed income posted a third consecutive monthly gain in June, with the Bloomberg US Aggregate Index returning 1.5% leading the benchmark to year-to-date return of 4.0%. Longer-dated paper saw the greatest price gains, driven by a mix of softer economic data, and the belief that the FOMC easing may be closer than it appeared in months prior. Meanwhile, the front end remained anchored, contributing to a modestly steeper treasury curve. In the coming months, our attention is turning to short term technicals, especially supply, foreign demand, and dealer positioning as primary drivers of rates in the near-term. With heavy Treasury issuance on deck in the second half of the year and elevated deficits persisting, we believe the long end of the curve may test higher levels in the near term.
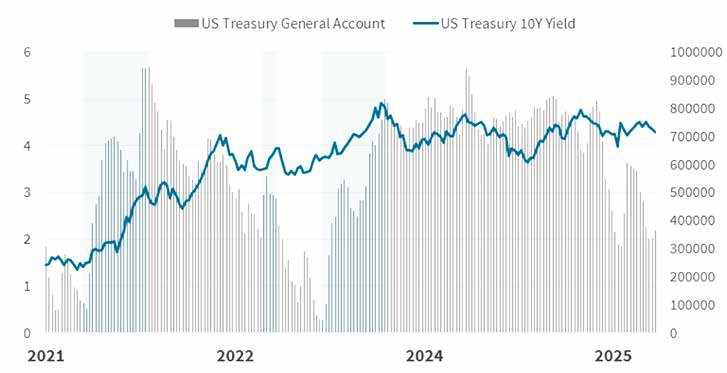
A key story in the Treasury market in 2025 has been the debt ceiling. From March 2025 to early May, the Treasury had to operate under “extraordinary measures” for several weeks which delayed issuance and led to spending down the Treasury General Account (TGA). The net impact in isolation was reduced supply and a technical tailwind for rates to move lower. The TGA was replenished primarily through T-bills but at some point, the Treasury will need to ramp up issuance of long-term debt. US Secretary of the Treasury, Scott Bessent supported T-Bill issuance over long-term debt in a Bloomberg interview on June 30th to which he responded, “Why would we do it at these rates?”. To this point while not beneficial, the Treasury has best practices on how many bills they issue and historically terming out debt to refill the TGA can put upward pressure on interest rates.
Refilling The Treasury Has Put Upward Pressure On Rates In The Past
Source: Bloomberg
Early summer gains in credit cap upside in below investment grade markets. The Bloomberg U.S. Corporate High Yield index generated a 1.8% return in June as credit got pricier with spreads compressing and trade uncertainty abating. In the first half of the year, 16 companies had a default payment and if you include distressed exchanges the default rate ended the quarter at an annualized rate of 1.41%, which is well below historical averages of 3-4%. Low defaults paired with relatively strong fundamentals in below investment grade names have led to spreads well below historical averages. The spread on the Bloomberg High Yield Corporate index, or the yield required over Treasuries to compensate investors for taking credit risk, compressed by another 57-basis points last month after compressing 69-basis points in May which leaves us near where we started the year. An interesting dynamic worth watching is the balance of fallen angels (bonds downgraded to high yield from investment grade), to rising stars (bonds upgraded to investment grade from high yield). In 2022 and 2023, there was a very significant wave ($232 billion total) of rising stars, which was a positive technical for the high yield asset class as the market contracted. That balanced has flipped with fallen angels surpassing rising stars by $33 billion YTD and several BBB-rated bonds near the cusp of being downgraded. Despite those factors, high yield fundamentals remain solid.
Highland moved to an overweight relative value fund position at the expense of high yield at the end of the quarter. While not every portfolio can take an overweight position in these less liquid strategies, relative value hedge funds typically outperform high yield when spreads are this tight. Rate and spread volatility have been high so far this year, and we see the possibility of further volatility in the coming months. Risk positioning remains neutral, but we remain diligently focused on the data for potential changes.
IMPORTANT DISCLOSURES: This publication has been prepared by the staff of Highland Associates, Inc. for distribution to, among others, Highland Associates, Inc. clients. Highland Associates is registered with the United States Security and Exchange Commission under the Investment Advisors Act of 1940. Highland Associates is a wholly owned subsidiary of Regions Bank, which in turn is a wholly owned subsidiary of Regions Financial Corporation. Research services are provided through Multi-Asset Solutions, a department of the Regions Asset Management business group within Regions Bank. The information and material contained herein is provided solely for general information purposes only. To the extent these materials reference Regions Bank data, such materials are not intended to be reflective or indicative of, and should not be relied upon as, the results of operations, financial conditions or performance of Regions Bank. Unless otherwise specifically stated, any views, opinions, analyses, estimates and strategies, as the case may be (“views”), expressed in this content are those of the respective authors and speakers named in those pieces and may differ from those of Regions Bank and/or other Regions Bank employees and affiliates. Views and estimates constitute our judgment as of the date of these materials, are often based on current market conditions, and are subject to change without notice. Any examples used are generic, hypothetical and for illustration purposes only. Any prices/quotes/statistics included have been obtained from sources believed to be reliable, but Highland Associates, Inc. does not warrant their completeness or accuracy. This information in no way constitutes research and should not be treated as such. The views expressed herein should not be construed as individual investment advice for any particular person or entity and are not intended as recommendations of particular securities, financial instruments, strategies or banking services for a particular person or entity. The names and marks of other companies or their services or products may be the trademarks of their owners and are used only to identify such companies or their services or products and not to indicate endorsement, sponsorship, or ownership by Regions or Highland Associates. Employees of Highland Associates, Inc., may have positions in securities or their derivatives that may be mentioned in this report. Additionally, Highland’s clients and companies affiliated with Highland Associates may hold positions in the mentioned companies in their portfolios or strategies. This material does not constitute an offer or an invitation by or on behalf of Highland Associates to any person or entity to buy or sell any security or financial instrument or engage in any banking service. Nothing in these materials constitutes investment, legal, accounting or tax advice. Non-deposit products including investments, securities, mutual funds, insurance products, crypto assets and annuities: Are Not FDIC-Insured I Are Not a Deposit I May Go Down in Value I Are Not Bank Guaranteed I Are Not Insured by Any Federal Government Agency I Are Not a Condition of Any Banking Activity.
Neither Regions Bank nor Regions Asset Management (collectively, “Regions”) are registered municipal advisors nor provide advice to municipal entities or obligated persons with respect to municipal financial products or the issuance of municipal securities (including regarding the structure, timing, terms and similar matters concerning municipal financial products or municipal securities issuances) or engage in the solicitation of municipal entities or obligated persons for such services. With respect to this presentation and any other information, materials or communications provided by Regions, (a) Regions is not recommending an action to any municipal entity or obligated person, (b) Regions is not acting as an advisor to any municipal entity or obligated person and does not owe a fiduciary duty pursuant to Section 15B of the Securities Exchange Act of 1934 to any municipal entity or obligated person with respect to such presentation, information, materials or communications, (c) Regions is acting for its own interests, and (d) you should discuss this presentation and any such other information, materials or communications with any and all internal and external advisors and experts that you deem appropriate before acting on this presentation or any such other information, materials or communications.
Source: Bloomberg Index Services Limited. BLOOMBERG® is a trademark and service mark of Bloomberg Finance L.P. and its affiliates (collectively “Bloomberg”). BARCLAYS® is a trademark and service mark of Barclays Bank Plc (collectively with its affiliates, “Barclays”), used under license. Bloomberg or Bloomberg’s licensors, including Barclays, own all proprietary rights in the Bloomberg Barclays Indices. Neither Bloomberg nor Barclays approves or endorses this material or guarantees the accuracy or completeness of any information herein, or makes any warranty, express or implied, as to the results to be obtained therefrom and, to the maximum extent allowed by law, neither shall have any liability or responsibility for injury or damages arising in connection therewith.