
Download Asset Allocation | July 2024
Right Down the Line
Economic Update
Unsustainable Fiscal Path Isn’t a Problem. Until It Is . . .
By Regions Economic Division
The fiscal path of the federal government has increasingly become a topic of conversation, not to mention concern, not only among the general public but also among market participants. The Congressional Budget Office’s (CBO) mid- June release of their updated projections for the federal government budget – the paths of revenue, spending, deficits, and outstanding debt – through 2034 probably wasn’t all that soothing to anyone already concerned with this issue and has, apparently, caught the attention of many for whom this topic wasn’t previously top of mind.
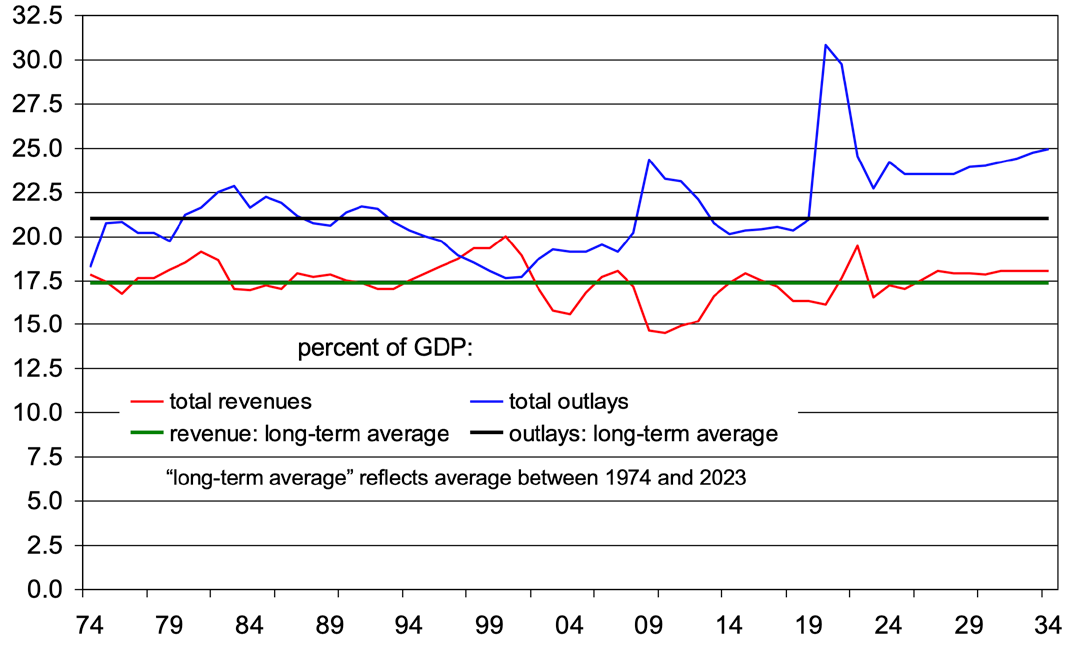
The CBO’s updated projections peg the fiscal year 2024 budget deficit at $1.9 trillion, up from their February 2024 estimate of $1.5 trillion. Moreover, deficits are expected to hover around this higher level over the next few years before becoming larger, both absolutely and as a percentage of GDP, over the later years of the forecast horizon. The CBO now projects that federal government outlays as a percentage of GDP will increase from 24.2% in 2024 to 24.9% in 2034, while federal government revenues as a percentage of GDP will increase from 17.2% in 2024 to 18.0% in 2034 (all years referenced herein are fiscal years, not calendar years). By way of reference, over the 1974 through 2019 period, outlays averaged 21.0% of GDP and revenues averaged 17.3% of GDP, though these shares have swung sharply over recent years, reflecting the impacts of the 2017 tax cuts and the policy response to the pandemic.
Sure, it’s easy to dismiss these long-term forecasts on the grounds that a lot can, and almost surely will, change over the next decade, to the point that any forecast made at present will quickly be proven wrong. What is different in this case, and not at all in a comforting way, is that the path of a considerable portion of federal government spending is predetermined under current law. To that point, “mandatory” expenditures, which include Social Security and Medicare, will grow sharply over the coming decade. At the same time, the federal government’s net interest expense has risen sharply over the past two years, and the CBO anticipates this will remain the case over the coming decade, reflecting both the growing level of federal debt and higher interest rates. Between the growth in mandatory outlays and in net interest expense, there will be increasingly less room in the federal government’s budget for discretionary spending over the next 10 years.
Whether or not the fiscal path anticipated by the CBO is sustainable is one question, perhaps the issue most people are focused on, judging from the questions we field from clients. Another question, in our minds equally important, is whether there are economic implications of such a fiscal path. We’ve already touched on one, i.e., the increasingly narrow scope for discretionary government spending. A much more relevant implication is the potential impact on private domestic investment. One way to think about this is to go back to one of the most basic points in any first semester macroeconomics course, which is that in any economy the aggregate level of investment equals the aggregate level of saving – which matters because investment is the main fuel of any economy’s growth over time.
Domestic saving consists of combined saving among the household, corporate, and government sectors. Any single sector of the economy can engage in dissaving (i.e., run a negative saving rate), as has long been the case in the public sector of the U.S. economy. In a closed economy, dissaving in one or more sectors must be offset by saving in the remaining sector(s), while in an open economy foreign saving can compensate for a lack of or a low level of domestic saving. By definition, however, for any economy the flip side of lower levels of net saving is lower levels of total investment, which, over time, is associated with lower rates of sustainable economic growth.
As of Q1 2024, net domestic saving was negative, equivalent to 0.44% of GDP. This is the fifth consecutive quarter in which net domestic saving was slightly negative, which reflects a falling household saving rate at a time when federal government budget deficits have been growing larger. That this is the starting point from which we embark on the fiscal path anticipated by the CBO makes the prospect of that fiscal path more unsettling, as it leaves us with a set of less than desirable outcomes. Either we see lower and lower levels of investment, we become increasingly reliant on foreign saving to finance a given path of investment, or we end up with some combination of the two. Again, anything that puts longer-term growth in investment on either a lower or an unstable/unsustainable path will ultimately translate into a lower sustainable rate of economic growth.
This, at least to us, is the most important context into which any discussion of federal government finances can be put. Net domestic saving will almost surely become increasingly negative on the fiscal path anticipated by the CBO, meaning that we will become increasingly reliant on foreign saving in order to sustain a given path of investment. The cost of doing so, however, will only increase as domestic dissaving becomes increasingly pronounced, meaning it will take higher U.S. interest rates to attract foreign savings. One advantage the U.S. continues to enjoy is the U.S. dollar’s status as the de facto global reserve currency, which has helped make it possible, and less costly, for the U.S. to attract foreign saving to finance both current consumption and future growth. While there are at present no viable threats to that status, that doesn’t mean that no such threats will emerge. Indeed, mounting geopolitical tensions and the prospects of intensifying trade wars are two such potential threats.
One thing that makes this a difficult topic to discuss is that there is no clear line in the sand that, if crossed, would trigger an outflow of foreign saving, which would in turn result in a sharp and sudden rise in U.S. interest rates. “It isn’t a problem until it is” may be the right answer, but that just isn’t an answer that many people find all that comforting or all that useful. Moreover, many are quick to assume that because that line has yet to be crossed means that there is no such line. We have no doubts that such a line exists, but it could be that before that line is crossed the “bond vigilantes” will saddle up and ride again, pushing interest rates up to a degree sufficient to more or less force fiscal policymakers to act to curb growth of federal government debt.
Recall that the bond vigilantes last rode to the scene in the early-1990s. At the time, federal government budget deficits were growing, to the point that government dissaving was equivalent to more than 6% of GDP, as has been the case over the past five quarters. Increasingly concerned over the prospect of even further increases in the size of the deficit, the bond vigilantes rode roughshod over the bond market, pushing yields on longer-term U.S. Treasury securities up sharply. That was seen as a major catalyst for a bipartisan agreement to rein in growth in government spending, to the point that by the end of the 1990s the federal government was running a budget surplus.
Whether the bond market vigilantes would have enough clout this time around to restore some semblance of order over fiscal policy remains to be seen. It is worth noting that the Federal Open Market Committee (FOMC) tapering the rate at which the Fed balance sheet is winding down and ultimately ending that tapering will blunt upward pressure on U.S. Treasury yields. We’d argue, however, that any such relief will ultimately be offset by the widening deficits envisioned by the CBO. The current fiscal path clearly seems unsustainable, and the questions at this point involve how long it can be sustained and what the catalyst for a change of course will be. It would, of course, be less painful to act out of choice rather than out of necessity, but at some point, the choice may no longer be ours.
Source: Congressional Budget Office
Investment Strategy Update
Stocks: Constructive on U.S. Large Caps Despite Concentration Concerns
Regions Multi-Asset Solutions & Highland Associates
The S&P 500 returned 3.5% in June on its way to a 15.3% year-to-date total return, the index’s best performance at the mid-point of any presidential election year since 1976. The adage “sell in May and go away” has not held this time around, and we continue to expect U.S. large-cap stocks to move higher throughout the summer months before volatility reenters the equation in the lead-up to the November election. A ramp-up in fiscal spending could lead to a long-awaited and most welcome improvement in market breadth as two sectors, communication services (+26%) and information technology (+28%), have generated the lion’s share of the S&P 500’s gain this year. Some signs of sector rotation were apparent in the back-half of June as capital half- heartedly moved out of the information technology sector, specifically semiconductor stocks, and found its way into consumer discretionary, energy, and financial services, among others.
This is an encouraging development, but a few weeks does not make a trend, and with just north of 40% of S&P 500 constituents trading above their 50-day moving average at month-end, participation in June’s rally was still narrower than we would have liked. Improved price momentum out of economically sensitive sectors such as discretionary, financials, and industrials would go a long way toward alleviating some of the concerns investors have surrounding the high level of concentration within the S&P 500 as the top 10 holdings accounted for over 36% of the index at month-end. Absent better breadth, it will still be difficult for the broader market to experience a 5% or greater drawdown so long as capital continues to rotate within the Magnificent 7, evidenced by Alphabet, Amazon, Apple, Meta Platforms, and Tesla all rallying in early July while Nvidia traded lower as it digested a sizable post-earnings rally. Index concentration is headline- grabbing, but the potential for artificial intelligence (AI) to boost productivity and profitability for a broad swath of companies, not just those in the information technology sector, remains the more impactful story for stocks. As a result of this view, the S&P 500 is likely on more stable footing than a high level of index concentration might otherwise lead one to believe.
Weight of Top 10 Stocks in the S&P 500 In- Line With Profit Contribution
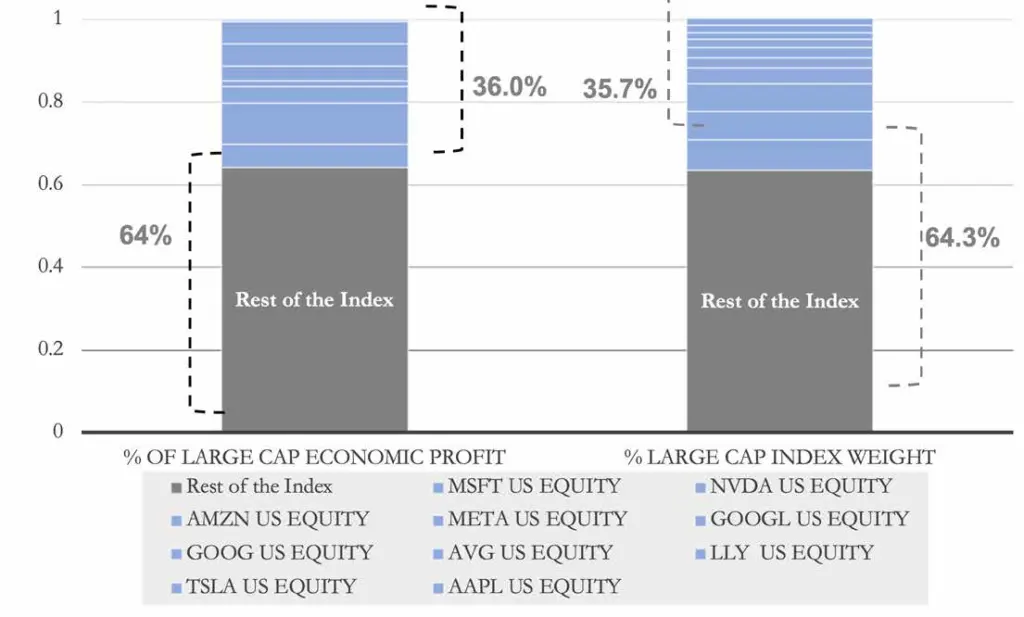
Economic Profit = (Return On Invested Capital- Weighted Average Cost of Capital) * Total Invested Capital
Source: Bloomberg, Regions MAS, Counterpoint Global Insights
Earnings revisions remain supportive of additional upside for domestic large-cap stocks. The consensus estimate for full year 2025 S&P 500 earnings per share rose to $277.58 at the end of June, implying 14.5% earnings growth in 2025 versus 2024. Looking out to 2026, the consensus estimate has jumped to $309.20 from $303.43 at year-end, implying 11.4% earnings growth versus the current 2025 estimate. Positive earnings revisions have been the catalyst for the S&P 500’s year-to-date gain as higher forward earnings estimates and hopes for cuts to the Fed funds rate this year have allowed investors to look past lofty trailing and focus on less demanding forward valuations as the S&P 500 trades at a more reasonable 17.7 times expected 2026 profits. Upcoming quarterly earnings season kicks off this month, which, along with positive earnings revisions and a Fed likely to make monetary policy less restrictive in September, should allow the S&P 500 to grow into its current valuation in time.
Forward P/E for the Magnficient 7 vs. Broader Equity Indices
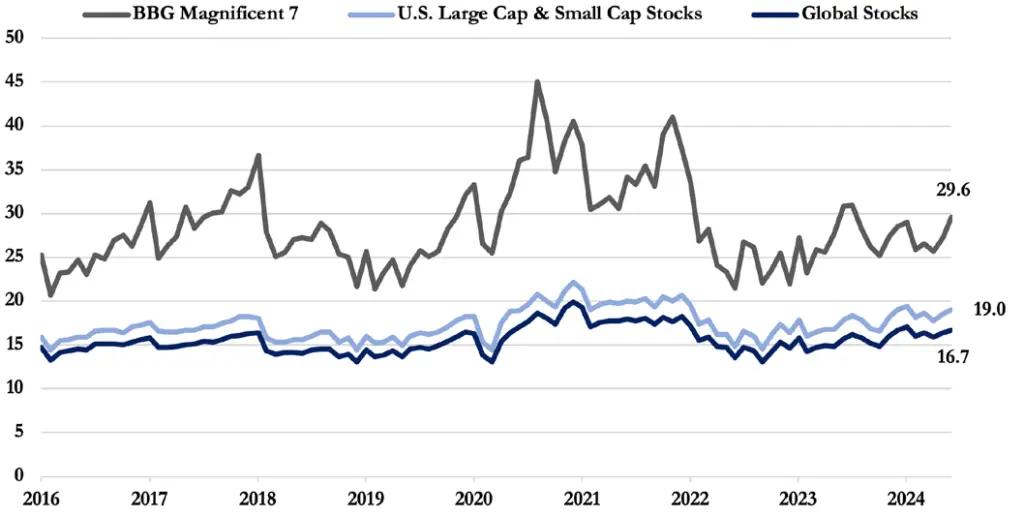
Source: Bloomberg
Small- and Mid-Cap (SMid) Stocks Walking a Tightrope
The drop in Treasury yields during June should have led to improved absolute and relative performance for small- and mid-cap (SMid) U.S. stocks during the month. But, instead of focusing on lower borrowing costs, investors focused more on the why behind the fall in yields, interpreting the drop to imply that perhaps economic growth could wane over coming months, leading to a 1.8% monthly drop in the S&P 1000 SMid index. While SMid failed to rally as Treasury yields fell in June, small- and mid-cap stocks could also face hurdles should rates move higher again as expected borrowing costs would likely rise. This backdrop makes for tough sledding for SMid despite what appears to be firm fundamental underpinnings and attractive valuation metrics.
One pain point for small- and mid-cap indices has been the promotion of high-flying AI-related names that have graduated to the S&P 500 from the S&P 600 and 400 after sizable year-to-date rallies. This is a reminder that companies can get removed from benchmarks even after strong performance, and active managers are more capable of letting their winners continue to run than are rules-based indices. The combination of macro headwinds and the reconstitution of SMid indices has provided a strong headwind for small caps as the S&P Small Cap 600 lagged the large-cap S&P 500 by 16% year-to-date through June. The S&P Mid Cap 400 fared a bit better, gaining 6.2% over that time frame, still lagging the S&P 500 by a sizable margin but besting the equal- weight S&P 500 by just over 1%.
Mid-cap stocks tend to be an attractive hunting ground for active managers, as the S&P 400 and other mid- cap indices tend to include companies that lack broad coverage from Wall Street firms, leading to opportunities to identify mispriced stocks. Mid-cap stocks are also attractive to investors seeking out stocks with higher betas, or leverage to a rising equity market, but with a bias toward more established, less heavily indebted firms relative to small-cap indices. While the economic and interest rate environment might favor mid-caps for a bit longer, sentiment surrounding small caps is likely close to being washed out as metrics like short interest, or bets against a stock’s price rising, have risen in recent months. We do not see the U.S. economy slowing to the degree that small-cap stock valuations currently imply, and given that these stocks would benefit in an outsized way from Fed funds rate cuts, we would prefer to wait for price momentum to improve before considering increasing allocations to SMid.
Political Risk in the Euro Area: Opportunity or Trap?
Developed markets abroad lagged U.S. large-cap stocks in June, with the MSCI EAFE index falling 1.6% during the month versus the S&P 500’s 3.5% gain. Much of the recent weakness abroad has been centered around the euro area after French President Emmanuel Macron dissolved the country’s National Assembly and surprisingly called for snap elections. Political uncertainty ramping up in France again highlights how tenuous and shaky the euro bloc’s union continues to be, and market participants ran for cover as other countries within the EU could face a similar fate over the coming months. Heightened political uncertainty in the euro area is nothing new for investors, but market participants find themselves wondering if the pullback in eurozone stocks is an opportunity to add exposure or if this is the start of a period of political unrest set to weigh on eurozone economic growth, corporate profits, and investor sentiment.
The European Central Bank further easing policy at coming meetings could be supportive of economic growth over coming quarters, bolstering investor sentiment, and leading to inflows. Political uncertainty is likely to remain heightened across the euro area even with snap elections in France behind us, but valuations for euro area stocks remain relatively appealing. Also, even a modest weakening of the U.S. dollar would be another potential positive catalyst for exporters based in the euro area. Investors reducing exposure to euro area stocks over the past month could find themselves looking to buy them back at higher prices as political storm clouds part, and with expectations for improved economic growth supported by less restrictive central bank policies underpinning our view. We maintain a neutral position.
Bonds: Treasury Yields Caught Up in a Tug- of-War
There was a downward bias to Treasury yields in June as inflation data cooled modestly amid signs of a slowing pace of economic activity, pushing prices of U.S. Treasuries higher. The move lower in yields generated solid monthly gains for most fixed income indices, with the Bloomberg Aggregate and Bloomberg U.S. Corporate High Yield index each turning out a 0.9% return, while surprisingly, the investment-grade Bloomberg Corporate index eked out a more modest 0.6% gain. Political uncertainty and the prospect of tariffs being placed on a broad swath of imported goods under a Trump presidency served as an offset and pushed global bond yields higher into month- end, and this tug-of-war netted out to Treasury yields, ending the month and quarter little changed from levels seen in early April. We expect this push/pull on rates to persist for a bit longer as doubts surrounding disinflation and political uncertainty in the U.S. and abroad lead investors to require higher compensation – i.e., yields – to take on the uncertainty/risk of inflation reaccelerating or regime change. As a counterbalance to those upside risks for yields, inflationary pressures subsiding further would lead to calls for central banks to cut rates and make monetary policy less restrictive. This would put downward pressure on yields for bonds maturing inside of five years but could have less of an impact on long- term Treasury yields.
We expect the prevailing “clip your coupon” backdrop to remain in force for a couple more months. Historically bonds have rallied and yields have fallen as the FOMC began cutting rates, setting up a profitable backdrop for fixed income investors. The FOMC is likely to cut the Fed funds rate when it meets in September, and the committee may telegraph such a move when it meets later this month if the economic data cooperates. Economic growth slowing and/or inflationary pressure easing more rapidly than expected would likely generate a rally in long bonds and boost an investor’s total return. However, with the terminal Fed funds rate potentially closer to 4% rather than the sub-3% currently priced in, there isn’t much term premium baked in with the 10-year yield of 4.30%. As a result, investors may shift capital into the belly of the yield curve (two- to five-year portion) and wait for higher yields on long-term bonds before moving farther out on the curve. We continue to see opportunities to boost income and total return by maintaining allocations to higher-yielding corporate bonds and select alternative fixed income securities, assuming positions are sized appropriately.
Average Next 12M Bond Returns Around First Rate Cut
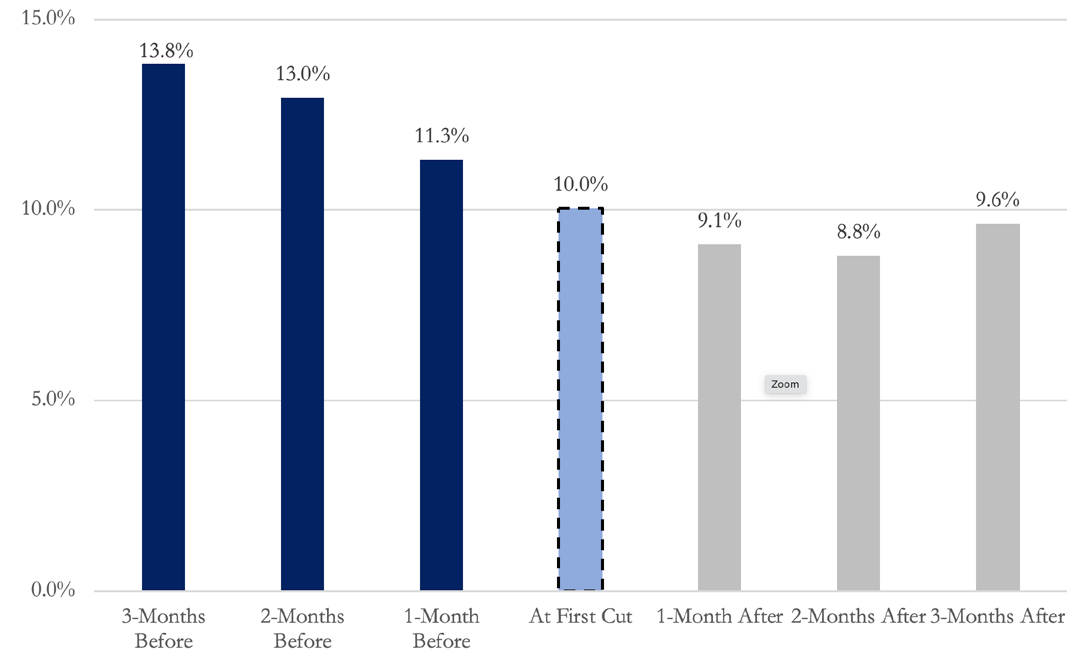
Source: Bloomberg
Credit Quietly Got Cheaper in June
Should economic data improve in the coming month(s),
investors could turn toward corporate bonds across the
quality spectrum with Treasuries appearing increasingl
expensive after rallying last month. This could be
particularly beneficial for investment-grade corporate
bonds, which cheapened by 9 basis points during June.
Widening credit spreads weren’t enough to generate a
negative total return during the month, as the positive
impact from falling rates offset cheaper valuations. High-
yield credit spreads were modestly higher, a trend that has
been in place for three months. From our perspective, a
slow drift higher in below-investment-grade credit spreads
is the best possible outcome as market participants are
presented with better risk-reward opportunities without
the prospect of a sharp spike in yields that causes liquidity
to seize up and risk appetite to wane. Diversification
across credit and rate exposure looks like the best way to
combat both current market conditions and the effects
of a shift in monetary policy in the coming months.
IMPORTANT DISCLOSURES: This publication has been prepared by the staff of Highland Associates, Inc. for distribution to, among others, Highland Associates, Inc. clients. Highland Associates is registered with the United States Security and Exchange Commission under the Investment Advisors Act of 1940. Highland Associates is a wholly owned subsidiary of Regions Bank, which in turn is a wholly owned subsidiary of Regions Financial Corporation. Research services are provided through Multi-Asset Solutions, a department of the Regions Asset Management business group within Regions Bank. The information and material contained herein is provided solely for general information purposes only. To the extent these materials reference Regions Bank data, such materials are not intended to be reflective or indicative of, and should not be relied upon as, the results of operations, financial conditions or performance of Regions Bank. Unless otherwise specifically stated, any views, opinions, analyses, estimates and strategies, as the case may be (“views”), expressed in this content are those of the respective authors and speakers named in those pieces and may differ from those of Regions Bank and/or other Regions Bank employees and affiliates. Views and estimates constitute our judgment as of the date of these materials, are often based on current market conditions, and are subject to change without notice. Any examples used are generic, hypothetical and for illustration purposes only. Any prices/quotes/statistics included have been obtained from sources believed to be reliable, but Highland Associates, Inc. does not warrant their completeness or accuracy. This information in no way constitutes research and should not be treated as such. The views expressed herein should not be construed as individual investment advice for any particular person or entity and are not intended as recommendations of particular securities, financial instruments, strategies or banking services for a particular person or entity. The names and marks of other companies or their services or products may be the trademarks of their owners and are used only to identify such companies or their services or products and not to indicate endorsement, sponsorship, or ownership by Regions or Highland Associates. Employees of Highland Associates, Inc., may have positions in securities or their derivatives that may be mentioned in this report. Additionally, Highland’s clients and companies affiliated with Highland Associates may hold positions in the mentioned companies in their portfolios or strategies. This material does not constitute an offer or an invitation by or on behalf of Highland Associates to any person or entity to buy or sell any security or financial instrument or engage in any banking service. Nothing in these materials constitutes investment, legal, accounting or tax advice. Non-deposit products including investments, securities, mutual funds, insurance products, crypto assets and annuities: Are Not FDIC-Insured I Are Not a Deposit I May Go Down in Value I Are Not Bank Guaranteed I Are Not Insured by Any Federal Government Agency I Are Not a Condition of Any Banking Activity.
Neither Regions Bank nor Regions Asset Management (collectively, “Regions”) are registered municipal advisors nor provide advice to municipal entities or obligated persons with respect to municipal financial products or the issuance of municipal securities (including regarding the structure, timing, terms and similar matters concerning municipal financial products or municipal securities issuances) or engage in the solicitation of municipal entities or obligated persons for such services. With respect to this presentation and any other information, materials or communications provided by Regions, (a) Regions is not recommending an action to any municipal entity or obligated person, (b) Regions is not acting as an advisor to any municipal entity or obligated person and does not owe a fiduciary duty pursuant to Section 15B of the Securities Exchange Act of 1934 to any municipal entity or obligated person with respect to such presentation, information, materials or communications, (c) Regions is acting for its own interests, and (d) you should discuss this presentation and any such other information, materials or communications with any and all internal and external advisors and experts that you deem appropriate before acting on this presentation or any such other information, materials or communications.
Source: Bloomberg Index Services Limited. BLOOMBERG® is a trademark and service mark of Bloomberg Finance L.P. and its affiliates (collectively “Bloomberg”). BARCLAYS® is a trademark and service mark of Barclays Bank Plc (collectively with its affiliates, “Barclays”), used under license. Bloomberg or Bloomberg’s licensors, including Barclays, own all proprietary rights in the Bloomberg Barclays Indices. Neither Bloomberg nor Barclays approves or endorses this material or guarantees the accuracy or completeness of any information herein, or makes any warranty, express or implied, as to the results to be obtained therefrom and, to the maximum extent allowed by law, neither shall have any liability or responsibility for injury or damages arising in connection therewith.