
Download Asset Allocation | July 2023
Labyrinth
Economic Update
(Still) Trying to Make Sense of It All
Regions Economic Division
While it may be true that, as Neil deGrasse Tyson says, the universe is under no obligation to make sense to you, would it be too much to ask for the economic data to do so? Our regular readers will no doubt be inclined to conclude that it is indeed too much to ask, as a common theme of ours over recent months has been the lack of clarity and consistency across the economic data series that we and others use as the basis of our forecasts. As we often note, it’s hard to know where you’re going when you’re not sure where you are. It is, of course, our job to identify the underlying trends in the various economic data series and tie them together into a plausible narrative of the economy’s most likely course. And while that often comes with a certain degree of frustration that arises from mixed signals being sent by the various data series, our degree of frustration has never been as high as it has been of late.
For instance, the two broadest measures of economic activity – Gross Domestic Product (GDP) and Gross Domestic Income (GDI) – are sending conflicting signals. In principle, the two measures are simply different approaches to measuring the value of all final goods and services produced in a given period, with GDP measured on the basis of expenditures and GDI measured on the basis of income. While the two series tend to track closely over time, they do at times diverge, as has been the case over the past two quarters, when real GDI has contracted while real GDP has continued to grow. Historically, when the two series have diverged, revisions to real GDP have tended to be in the direction of GDI, not the other way around. This is somewhat disconcerting given the questions surrounding the current state of the U.S. economy and concerns that a recession is lurking around the corner.
The contraction in real GDI over the past two quarters is largely a function of declining corporate profits as personal income has expanded at a healthy clip. Tempting as it may be to discount the declines in real GDI on the grounds that declining corporate profits don’t have implications for the broader economy, history suggests otherwise. A look at past cycles shows corporate profits have tended to begin declining prior to the economy slipping into recession, which is one reason real GDI has tended to begin declining prior to real GDP beginning to do so. Think about it this way: If declining profits lead firms to pull in the reins on capital spending and staffing, those cuts in business investment and employment can help drag the economy into recession. If, as we expect, profit margins compress further over coming quarters, that would seem to up the odds of a downturn in the broader economy.
One caveat is that on September 28 the U.S. Bureau of Economic Analysis (BEA) will release its annual comprehensive revisions to the data from the National Economic Accounts, which include the data that are the basis for GDP and GDI. As such, the profiles of both real GDP and real GDI may look quite different on September 28 than they do today. Still, we’d caution against dismissing the contractions in real GDI seen over the past two quarters, particularly given the weakening trend in aggregate hours worked in recent months and our suspicion that the U.S. Bureau of Labor Statistics’ (BLS) estimates of monthly growth in nonfarm payrolls have been overstated over the past several months. Our suspicion will be either confirmed or debunked on August 23, when the BLS releases a preview of the annual revisions to the establishment survey data, in which the monthly estimates are benchmarked to the universe of payroll tax returns that nearly all firms are required to file. If our suspicion is correct, the trend in aggregate private sector hours worked will be even weaker than has been reported, which in turn would suggest real GDP growth will be revised down. Moreover, growth in labor earnings, the largest component of personal income, would also be revised lower, making GDI even weaker than has been reported thus far.
The Institute for Supply Management’s (ISM) monthly surveys show the manufacturing and services sectors remain on divergent paths. The ISM Manufacturing Index has signaled contraction in the manufacturing sector in each of the past eight months, and ongoing contractions in new orders and dwindling backlogs of unfilled orders suggest a weak profile for manufacturing employment and output in the months ahead. In contrast, the ISM Non-Manufacturing Index shows continuing expansion in the broad services sector, albeit at an increasingly uneven pace of late.
The labor market is another example of diverging fortunes across different sectors of the economy. While remaining robust, job growth has become increasingly concentrated among a smaller group of industries as hiring in manufacturing, wholesale trade, retail trade, transportation/warehousing, finance, and information services has softened considerably over recent months. Moreover, even as nonfarm payrolls have continued to expand at a rapid clip, growth in aggregate private sector hours worked has slowed to a crawl, June’s increase notwithstanding. This suggests firms are to some degree engaging in labor hoarding, bracing for a period of weaker/declining demand but still eager to take on qualified workers when they can find them in anticipation of future growth in demand. That said, if that demand either does not materialize or takes longer than anticipated to do so, it could be that letting workers go becomes a more feasible alternative for firms.
While there may be little clarity elsewhere in the economy, there is no denying that inflation remains much too high for the Federal Open Market Committee’s (FOMC) comfort. What the FOMC can, will, or should do about that, however, is open for debate. While another 25-basis-point hike in the Fed funds rate at the July FOMC meeting seems likely, our sense is that by the time of the following FOMC meeting in September, the economic landscape will look different, perhaps meaningfully so given the pending benchmark revisions to the data on nonfarm employment, hours, and earnings. One potential problem, however, is that the revised data on GDP and GDI will not come out until the week following the September FOMC meeting, meaning that committee members won’t have a full sense of how different the economic landscape looks. Either way, by the time the September FOMC meeting rolls around, it could be that further funds rate hikes are much harder to justify.
Still, given how murky the view of the U.S. economy is at present, September seems an awful long way away. Our base case is for the U.S. economy to skirt the recession that many have been forecasting for well over a year now. Still, with growth as slow as we expect over coming quarters, the economy would have little capacity to absorb any adverse shocks. This could be the difference between the economy avoiding or falling into recession, and, at this point, neither would surprise us.
Sources: U.S. Bureau of Economic Analysis; U.S. Bureau of Labor Statistics; Institute for Supply Management
June Market Update
Firmer Footing, but Headwinds Remain
Regions Multi-Asset Solutions
The S&P 500 rose 6% in June, with a year-to-date total return of 16.9%. Most encouraging about June’s rally was the performance of the Russell 2000 small-cap index, which rallied 8.1% during the month and outperformed the S&P 500 along with economically sensitive sectors such as industrials, materials, and energy. Narrow leadership has been a reason we’ve remained defensive on stocks throughout 2023, but with small-caps faring better versus large-caps and economically sensitive sectors joining the party in the back half of June, domestic equity indices appear to be on firmer footing.
A period of digestion or sideways movement would be healthy for the S&P 500 after such a sizable year-to-date rally but, historically, a strong first half of the year often leads to gains in the back half, as well as managers chasing returns while previously hesitant retail buyers tend to contract FOMO (fear of missing out). At the same time, valuations for U.S. large-cap stocks remain elevated, and the 10-year U.S. Treasury yield hovering just shy of 4% could pose another hurdle for near-term gains as competition for capital remains heated.
Outside the U.S., developed international equities gained 2.9% during June, propelled by strength out of Japan and the euro area, while the U.K. lagged, albeit only modestly. Elevated inflation readings make the case for a period of stagflation to take hold. Euro area and U.K. equities so far have shrugged off economic concerns, but the drivers behind this disconnect and the sustainability of such a relationship should be questioned. Additionally, with the winter months fast approaching, the prospect of a rapid rise in energy and electricity prices could contribute to renewed and persistent inflationary pressures.
Within Fixed Income, global sovereign bond yields rose in tandem throughout June as entrenched core inflation in the U.S., U.K., and euro area emboldened central bankers to talk tough on inflation. Domestically, in the first week of July, the 2-year yield rose above 5% to a level last seen in 2007, while the 10-year Treasury yield closed above 4% and was back at early-March levels prior to the collapse of Silicon Valley Bank. The FOMC will meet July 25-26, and Fed funds futures are now pricing in a 90% chance of a 25-basis-point rate hike after a strong June employment report. It’s anyone’s best guess what happens after, as FOMC meeting minutes from June pointed toward more dissension in the ranks than was previously believed, a dynamic likely to contribute to continued volatility in rates.
The conversation around high-yield exposure often revolves around credit spreads and the attractiveness of purchasing high-yield bonds at often short-lived “cheap” valuations. Valuations are an important consideration when investing in high-yield bonds, and at present the Bloomberg U.S. High Yield index appears neither “cheap” nor “rich” relative to 10- and 20-year averages. The underlying credit quality of the high-yield index has improved substantially over the past decade, as 88% of the high-yield index is now B-rated or better, only two tiers below investment grade, versus just north of 70% in 2012. Also of note, the high-yield universe has historically been made up largely of unsecured bonds, but secured issuance has risen from 20% to 29% in the last two years, implying higher recovery rates should defaults rise. While high yield remains far from “cheap,” credit spreads remain contained and demand remains robust, leaving us comfortable with a neutral allocation.
Investment Strategy Update
Given the strong rally in equity markets alongside narrowing credit spreads during the first half of the year, the Highland Diffusion Index is now signaling Neutral risk. As a reminder, our Highland Diffusion Index (HDI) framework is central to how we manage risk in client portfolios. The framework tracks 27 data points across six primary areas: Economic, Employment, Monetary Policy, Credit Spreads, Yield Curve, and Market Momentum. It helps to cut through market noise and assess the likelihood markets are in a Risk-On, Neutral, or Risk-Off environment. The framework helped us successfully navigate periods like the COVID-19 Crisis in 2020 and the Global Financial Crisis in 2008-2009.
In August 2022, we initiated an underweight position in equities in favor of short-duration bonds and select alternative strategies, as five of the six indicators – Economic, Yield Curve, Monetary Policy, Credit Spread, and Momentum – were signaling Risk-Off. Both tactical trades positioned portfolios defensively in protection against more equity volatility and rising interest rates. The last three times these five indicators were all pointing Risk-Off was in September 2000, January 1982, and September 1973.
It’s worth remembering how unusual the first three years of this decade have been. The world faced an unprecedented pandemic, prompting officials to respond with widespread economic shutdowns along with massive monetary and fiscal stimulus. That stimulus, along with reopening of the global economy, fueled the sharpest surge in global inflation in over 30 years. Central banks responded with the fastest interest rate hikes in four decades, with consequences that included a global stock market sell-off in 2022, U.K. pension crisis, U.S. regional banking issues, and an uptick in forecasts calling for a recession.
Many believed central banks would be cutting interest rates by now as the pandemic policy response worked its way through the economy. Instead, household financial conditions remain strong, and businesses, particularly among investment-grade corporate issuers, are healthy as both groups took advantage and locked in low, fixed-rate debt. Moreover, while higher interest rates have impacted areas of the economy like construction and sales of new single-family homes, both have begun to rebound recently.
As portfolios have naturally rebalanced closer to policy weights in response to rising equity markets, we are removing all the tactical calls tied to a Risk-Off stance and prefer to remain Neutral for now. In periods such as this one where the range of potential outcomes is wide, our preference is to remain closer to longer-term strategic portfolio targets. We will continue to monitor the investment landscape and reevaluate positioning as we get more clarity.
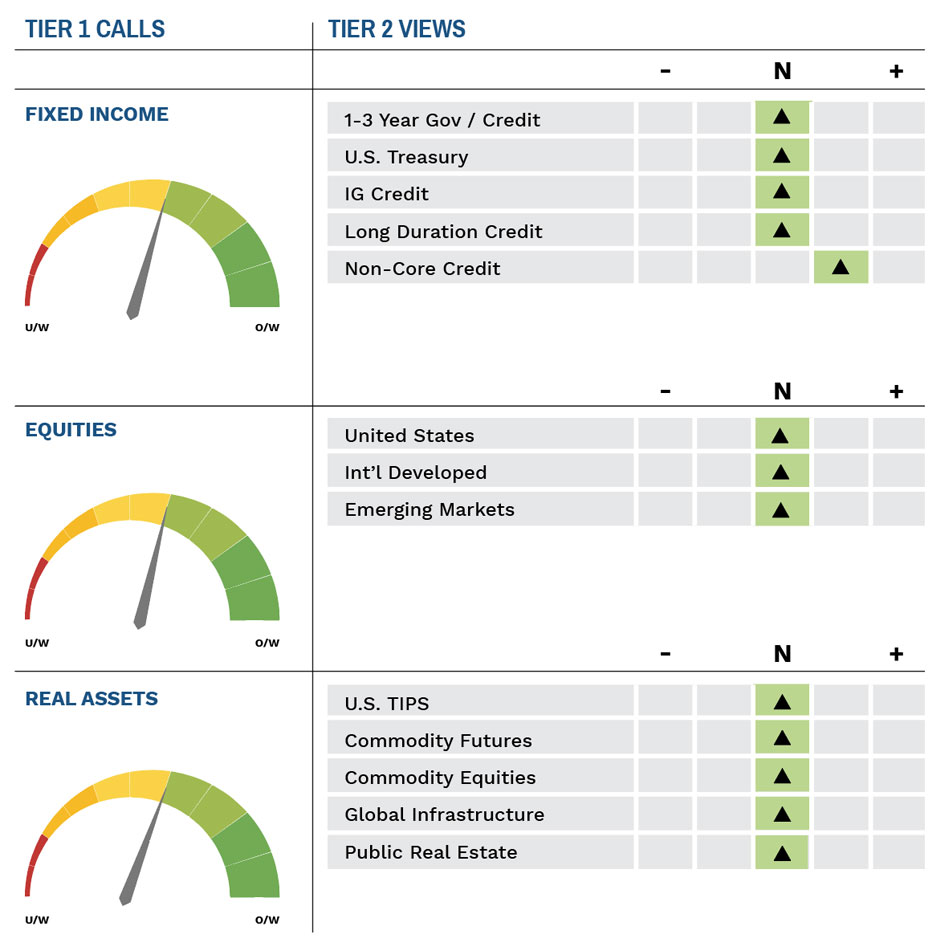
Highland Associates Cross Asset Views
As of 7/17/2023