
Download Asset Allocation | January 2026
A Long Strange Trip
January opens with an optimistic outlook, even as the world is marked by an unsettling mix of conflict both here and abroad. Geopolitical events, including ongoing developments surrounding Nicolás Maduro’s government in Venezuela, civil unrest in Iran, and U.S. policy discussions related to Greenland, have drawn significant global attention this month. In the U.S., ongoing legal and policy discussions involving Federal Reserve Chair Jerome Powell have highlighted the sensitivity of interactions between the White House and the central bank. Tensions continue to rise around the administration’s immigration and enforcement policies.
Amid the turbulence, gold and silver have risen to all-time highs, surging as investors seek refuge in precious metals. Emerging market stocks and small cap stocks have set the early pace out of the door and down to the street. As investors navigate the unusual start to the year, questions remain: does the road ahead remain clear, or could markets take another strange turn?
Economic Update
A Look Forward
Regions Economic Division
As we do each January, we’ll offer a broad contour of how we expect the U.S. economy to evolve over the course of the new year. Then again, if 2025 is any guide, perhaps we should limit ourselves to a discussion to where the economy will be at the end of 2026. After all, while the broad metrics, such as real GDP growth, looked pretty much as we thought they would for full-year 2025, the journey to that point was nothing like we thought it would be.
We did acknowledge a greater than normal degree of uncertainty around our baseline 2025 forecast, and there were two main reasons for that. First, while the broad policy contours seemed somewhat obvious at the start of 2025, there was considerable uncertainty around the specific details of fiscal, trade, immigration, and regulatory policy. Second, by the end of 2024, the degree of confidence we had in much of the economic data had sunk to what for us was an all-time low. A year later, we can make the same points meaning that, once again, our annual outlook comes with a higher than normal degree of uncertainty around it. Either way, when it comes to our annual outlooks, we think that part of looking forward is looking backward. So, before discussing how we think the economy will do in 2026, we’ll offer a summary of how our forecast for 2025 did.
Our January 2025 baseline forecast called for real GDP growth of 2.2 percent, and with the data now at hand and our forecast of Q4 growth, 2025 real GDP growth is tracking at 2.2 percent. While the economy basically got to where we thought it would go, how the economy got there was nothing like we imagined at the start of 2025. That can perhaps best be seen by looking at the quarterly changes in real GDP over the course of the year. After contracting at a 0.6 percent rate in Q1 2025, real GDP grew at a 3.8 percent rate in Q2 and at a 4.3 percent rate (pending revision) in Q3, and at present we are expecting growth at just a 1.3 percent rate in Q4. Suffice it to say that our 2025 outlook envisioned a somewhat more sedate quarterly growth profile. We’ll note that our forecast of 1.3 percent real GDP growth in Q4 2025 reflects the impacts of the government shutdown but will change as remaining gaps in the data are filled in, which could impact full-year 2025 real GDP growth.
In last year’s outlook we noted that “despite having more than worn out its welcome, inflation is showing few signs of going away.” Our forecast had both headline and core PCE inflation at 2.4 percent on an annual average basis in 2025, with the risks to that forecast weighted to the upside. As of this writing, we only have data through September, and on a year-to-date basis PCE inflation was running at 2.6 percent and core PCE inflation was running at 2.8 percent. We noted that even before factoring higher tariffs into the equation we expected core goods prices to transition from being a drag on core inflation to being a support for core inflation.
While going into 2025 we expected the U.S. to impose higher tariff rates on imports of goods, we made no assumptions about what those tariff rates would be. As it turned out, the increase in tariff rates was steeper than we and most others would have thought, though trade deals, tariff exemptions, and foreign suppliers rerouting shipments have all helped soften the impact. As for the impact of tariffs on inflation, we’d argue the jury is still out.
Our 2025 outlook flagged sharply curtailed foreign inmigration as a downside risk to the labor market and, in turn, the broader economy. The household survey data in the BLS’s monthly employment reports show declines in the foreign born labor force that got progressively steeper until late in the year, which we’ve argued was a key factor behind the marked slowdown in the pace of job growth. We also noted that the slowing trend rate of nonfarm employment growth had thus far been a function of a diminished rate of hiring rather than a rising pace of layoffs and expected that tenuous balance to hold through 2025. It does, however, seem that our forecast for the unemployment rate to average 4.1 percent in 2025 was too low, as the unemployment rate averaged 4.3 percent, though here too gaps in the data stemming from the government shutdown are having an impact on the data.
In what was the easiest call we made in our 2025 outlook, we noted that “it’s hard to see things getting much better for the housing market in 2025.” We saw builders making only limited progress in paring down spec inventories of new homes for sale, in part because we expected little relief in the form of lower mortgage interest rates or lower house prices. That said, though there are still gaps in the data stemming from the shutdown, the decline in new single family housing starts in 2025 was on course to be even more severe than we anticipated. At the same time, while we expected the CoreLogic HPI to show house prices up 2.2 percent in 2025, through November the increase was tracking at 1.6 percent.
Finally, we noted that while we saw further room for Fed funds rate cuts in 2025, inflation remaining easily above the FOMC’s 2.0 percent target rate would limit that room. As such, we expected two twenty-five basis point cuts in the funds rate in 2025, whereas a deeply divided FOMC delivered three such cuts while signaling in December that they could be on hold for some time.
All in all, the economy ended 2025 pretty much where we thought at the beginning of the year it would. That said, many of the steps on that journey were vastly different than we anticipated. The question now is whether 2026 will prove to be another long, strange trip for the U.S. economy. We look for real GDP growth of 2.5 percent in 2026. Part of that growth, however, will come at the expense of 2025 growth given that we look for the government shutdown to have taken up to 1.50 percentage points off Q4 2025 real GDP growth, with much of that drag being made up for in Q1 2026.
We expect last summer’s tax and spending bill to provide support for both the household and business sectors in 2026. Specifically, the bill will yield a spike in after-tax personal income in Q1 2026, with much of that gain going to households now feeling the highest degree of financial stress, which will support consumer spending. At the same time, changes in the corporate tax code should support growth in business investment spending. This, in turn, leads us to expect that the acceleration in labor productivity growth seen over the past several quarters has much further to run, and we expect productivity growth to top 3.0 percent for full-year 2026.
If we are correct in expecting continued listless labor supply growth and further acceleration in labor productivity growth, that would mean another year of what on the surface will look like uninspired growth in nonfarm employment. Keep in mind, though, that slower labor supply growth means a lower “breakeven” rate of job growth, i.e., the pace of job growth necessary to keep the unemployment rate more or less stable. At present, we think the breakeven rate of job growth could be as low as 40,000-50,000 jobs per month, though with the noise in the household survey data it’s hard to be too precise about the true rate of labor force growth. Our forecast anticipates the unemployment rate averaging 4.4 percent in 2026.
We do not hold out much hope for meaningful improvement in the housing market in 2026. Our baseline forecast anticipates a second straight decline in single family housing starts though we may have modest sequential improvement over the back half of the year. We see a similar pattern in new home sales in 2026. While builders have made some progress in paring down spec inventories of new homes for sale, for many builders those inventories nonetheless remain uncomfortably high. While our baseline forecast does anticipate some relief in the form of lower mortgage interest rates, absent relief in the form of lower prices affordability constraints will continue to weigh on demand for home purchases. Our baseline forecast anticipates house prices, as measured by the CoreLogic House Price Index, being basically flat in 2026.
We expect some moderation in inflation in 2026 but nonetheless anticipate both headline and core PCE inflation averaging 2.5 percent in 2026. With the Fed funds rate getting closer to what most FOMC members would perceive to be “neutral,” inflation remaining above the FOMC’s 2.0 percent target limits the amount of downside room for further cuts in the funds rate in 2026 absent more pronounced deterioration in either the labor market or the broader economy than we are anticipating in 2026.
We’ll wrap our 2026 outlook by repeating what has become a standing call in our annual outlooks which, by the way, we’ve never been wrong on, which is that at the end of the year, the economy is unlikely to look as we, at the start of the year, expect it to, even if we do not now know why that will be the case.
Sources: Bureau of Economic Analysis; Bureau of Labor Statistics; U.S. Census Bureau
Investment Strategy Update
Regions Multi-Asset Solutions & Highland Associates
A combination of tax loss harvesting and portfolio repositioning served to tamp down enthusiasm and demand for U.S. stocks into year-end, and despite December’s well- earned reputation as a historically strong month for stocks the S&P 500, S&P Midcap 400, and S&P Small Cap 600 indices each posted a modest decline last month. However, while the typical post-Christmas rally failed to materialize, U.S. indices have seen a lift thus far in January with both economically sensitive and growth-oriented sectors outperforming traditionally defensive areas. This sector leadership profile suggests improving investor risk appetite, which may support a constructive market outlook, and there are still plenty of potential catalysts capable of pushing U.S. stocks higher in the near-to-intermediate-term.
Early in the new year, investors have sought out exposure to sectors and industries that are most levered to a potential U.S. economic upswing over coming quarters. This has generated bids for consumer discretionary, financials, industrials, and materials stocks, among others, but the information technology sector has also participated, in large part due to a rally in semiconductor stocks, one of the more cyclical industries within the technology sector. The ability for corporations to see tax benefits from the immediate expensing of capital expenditures should also spur increased investment across a broad swath of sectors, while stepped- up corporate capex along with a potential banner year for individual tax refunds should boost consumer spending.
U.S. economic growth surprising to the upside over coming quarters and leading to upward revisions to earnings estimates is one of several potential drivers of upside. We expect a lighter touch on the regulatory front to buoy select sectors and the U.S. economy in 2026. Financial services is potentially one of the biggest beneficiaries, between a less onerous regulatory environment and what could be a round of consolidation within the banking segment. What remains to be seen is how lighter regulations may be offset by potential policy shifts aimed at improving affordability for U.S. consumers, such as interest rate caps on credit cards.
We anticipate that the new year will bring with it a continuation of last year’s more robust dealmaking environment, and investment banks will be the primary beneficiaries of an uptick in mergers and acquisitions (M&A) activity. Corporations remain flush with cash, and with profit margins and free cash flow at/near record levels, both the number of announced deals and average deal size could surpass last year’s levels though these outcomes depend on market, policy, and financing conditions. We see opportunities for M&A to boost sentiment surrounding economically sensitive (financial services, industrials), secular growth (communication services, information technology), and defensive (health care) sectors alike, as well as small and mid-cap stocks.
Small cap and mid-cap U.S. stocks have had a strong start to the new year and have outperformed their large and mega- cap brethren in the S&P 500 up to this point. The question investors may be asking is whether outperformance will be sustained or if this is just the “January Effect” playing out? For background, the January Effect is a market maxim that dates to the 1940’s and notes the tendency for U.S. stocks, specifically smaller capitalization stocks, to rise in January. This phenomenon has largely been attributed to tax loss harvesting in December, but with tax advantaged accounts such as 401k’s and IRAs garnering the lion’s share of inflows in recent years, the January Effect has been muted. This leads us to conclude that other factors have driven the strong start to the year in smaller stocks, and improved relative performance could persist.
So far this year, investors have expressed a preference for cyclicals, and with the S&P Midcap 400 and S&P Small Cap 600 carrying larger exposures to economically sensitive sectors, than the S&P 500. For context, while financials, industrials, and materials combined account for over 45% of the S&P 400 and over 40% of the S&P 600, they account for less than 25% of the S&P 500. For portfolios with small and mid-cap exposure, we maintain a preference for higher quality stocks, but higher beta small caps will likely see an even greater lift should investors grow more confident that U.S. economic growth is set to accelerate.
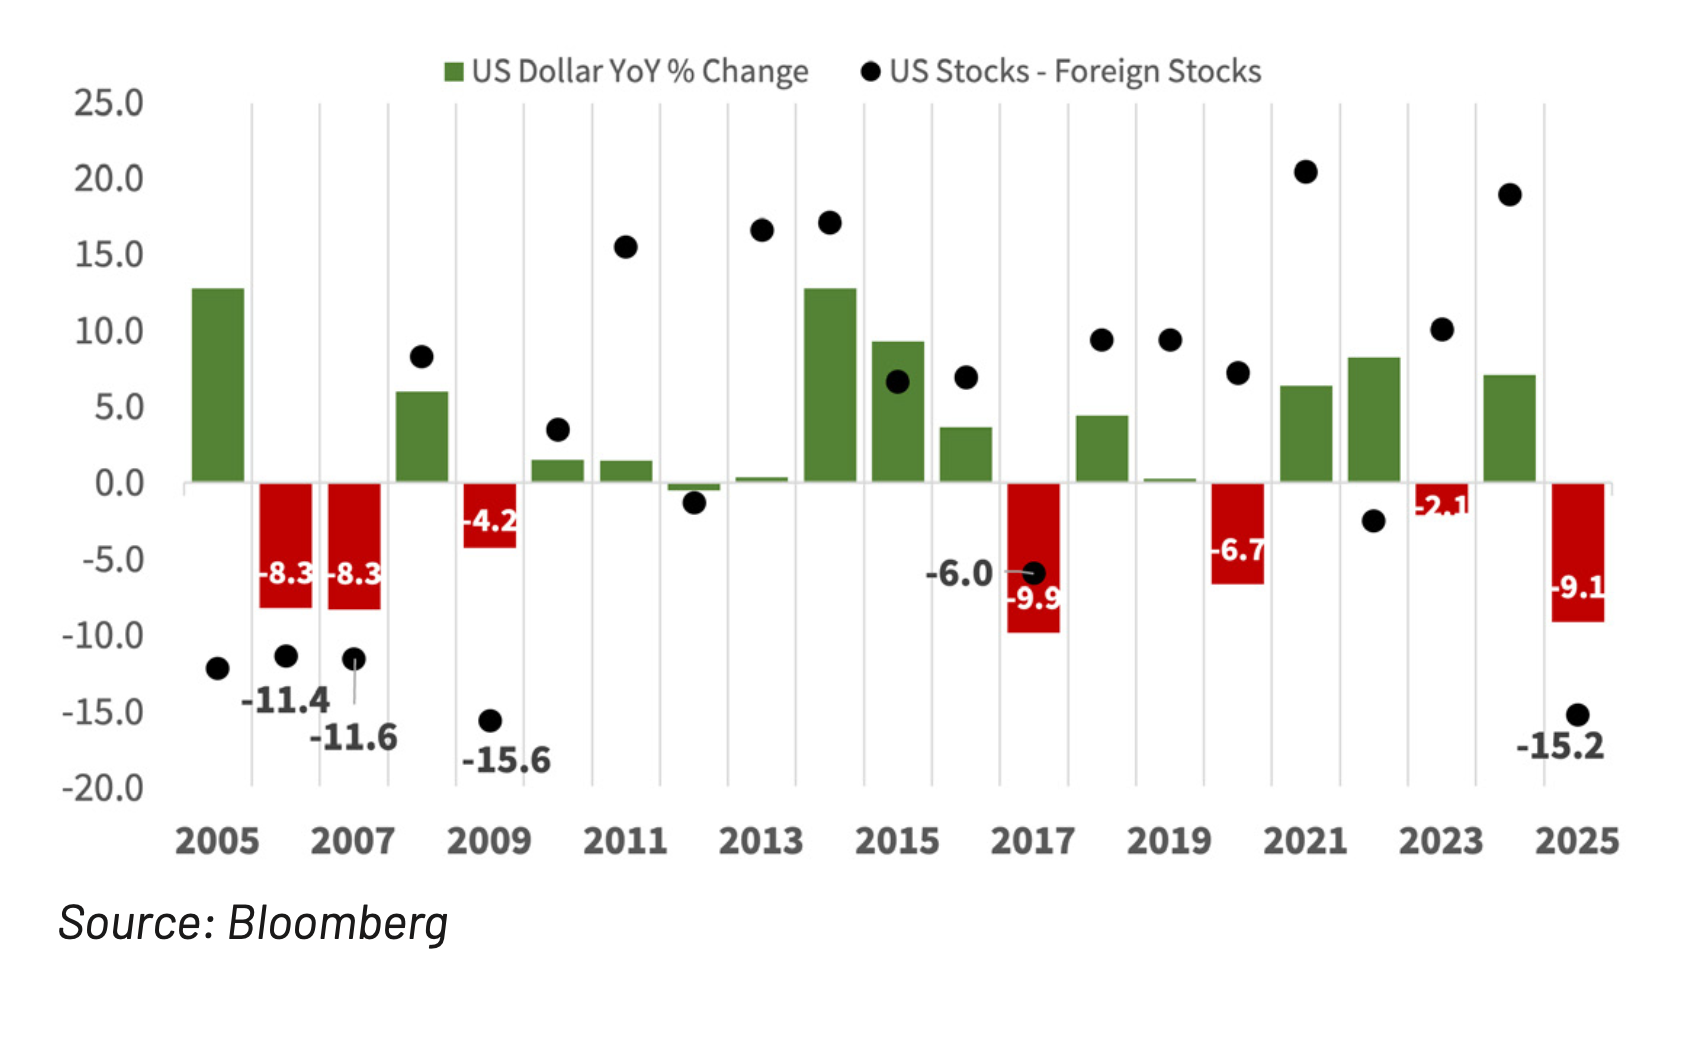
Investors appeared eager to reallocate capital into developed foreign markets at year-end as the U.S. dollar weakened, propelling the MSCI EAFE developed markets index to a 3% total return in December. The MSCI EAFE posted a total return of 32% last year, the index’s best calendar year since 2009, a move that was driven in large part by weakness in the U.S. dollar and hopes that fiscal stimulus would boost economic growth and corporate profits in the EU and Japan. While investors were handsomely rewarded for allocating capital abroad last year, we anticipate more mixed and muted returns from developed markets abroad in the coming quarters for a few reasons.
Almost two-thirds of the MSCI EAFE’s gain last year materialized in the first half of the year as tariff/trade uncertainty spurred capital outflows from the U.S. and generated substantial weakness in the U.S. dollar. However, from when the U.S. Dollar Index (DXY) bottomed on July 2nd through year-end, the S&P 500 outperformed the EAFE with a price return of 15.3% versus the EAFE’s 10.7%. With trade rhetoric taking a backseat, the greenback appears to be stabilizing, and absent another downdraft for the U.S. dollar, investors in developed markets abroad will have to bank more on earnings growth to drive gains in the year ahead. Fiscal stimulus will likely buoy economic growth in the euro area and Japan, but after last year’s rally, valuations are more demanding, and much of the good news could be priced in. As a result, many investors may want to see tangible benefits, i.e. earnings growth/upside, from this spending spree early in ‘26 before increasing allocations to developed foreign markets.
Large Downdrafts In The US Dollar Rarely Repeat In Back-To-Back Years
The MSCI Emerging Markets (EM) index offers a wide array of growth and value opportunities with high free cash flow available in Latin American countries like Brazil and Mexico, as well as more growth-oriented options such as South Korea in Asia. At a high level, active investment managers are coming into the year underweight growthier markets like South Korea that gained over 100% in 2025 with analysts still expecting 64% EPS growth over the next twelve months. Instead, allocators are expressing a view that cheaper valuations in less thematic exposures represent a better risk-reward tradeoff and are looking to markets such as Mexico and Brazil that carry a free cash flow yield in the mid 6% range for opportunities. On paper, it would appear fund managers are betting on value, but in practice they are likely managing concentration risk as both South Korea and Taiwan country-specific indexes hold a 20%-plus position in just one stock. We see positive fundamentals in emerging equities allowing the sub-asset class to build on last year’s strength. Even with slightly higher valuations and a potential currency tailwind, there are several reasons to like and remain overweight emerging markets.
U.S. Treasury yields have been little changed while credit spreads have continued to narrow/tighten to start the new year, leading to modestly positive returns out of investment- grade and high yield corporate bonds alike. The lack of volatility in the Treasury market so far this year has allowed investors to comfortably clip their coupons, but we don’t expect this period of relative calm to last for much longer. As such, a more active and flexible investing approach to fixed income will likely be required and could be rewarded in the year to come.
The 10-year Treasury yield has remained above 4% for all but a couple of days since the end of October and spent the bulk of December stuck between 4.10% and 4.20%, a tight trading range to be sure. The lack of movement in yields on longer-dated U.S. Treasury bonds in recent months stands in contrast to the rise in yields on sovereign issues abroad. While the 10-year Treasury yield rose from 4.07% at the end of October to 4.16% at year-end, while G7 10-year bonds had a larger move higher. Given the broad-based lift in yields tied to comparable sovereign bond issues abroad, we would have expected Treasury yields to rise more, but so far that hasn’t been the case. However, the longer an asset trades in a narrowing/tighter range, the larger the move in either direction is likely to be. In our view, the move in the 10-year yield is likely to be higher, with upside resistance in the 4.35% to 4.40% zone likely to be tested at some this year.
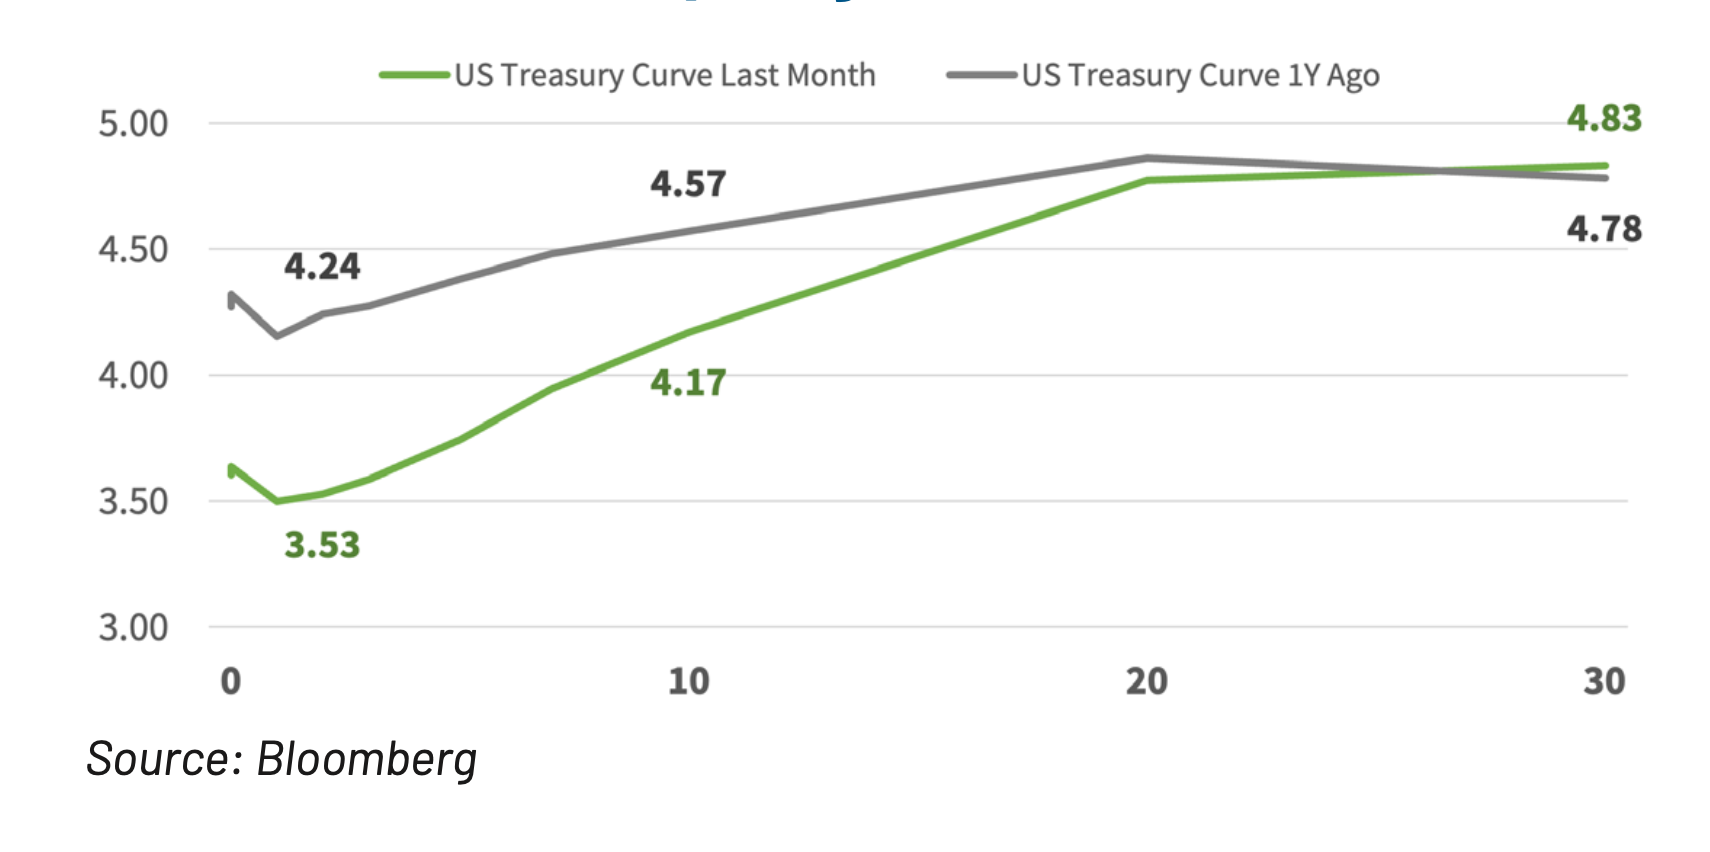
The yield curve steepened throughout the 4th quarter as the spread between the 2-year Treasury yield and the 10-year Treasury yield, commonly referred to as the 2s/10s spread, bottomed in mid-October at 55-basis points before widening to 69-basis points after back-to-back 25-basis point Fed funds rate cuts at the FOMC’s November and December meetings. For long-dated Treasuries, a combination of sticky inflation along with pro-growth fiscal policy and less restrictive monetary policies should keep sustained upward pressure on yields farther out on the curve. This will serve to limit total return potential out of both longer-dated Treasuries as well as longer duration investment grade corporate bonds in the coming year. With lower yields and credit spreads tighter than at the start of 2025, we continue to focus on diversification as we position for interest rate volatility to increase, creating opportunities to rebalance portfolios and/or tactically reposition.
Yield Curve Steepening As Short Rates Come In
Current valuations suggest more limited potential for high yield assets. With credit spreads tightening in 8 of the last 12 months, investors remain at the mercy of corporate borrowers as we enter 2026 with the option-adjusted spread (OAS) on the Bloomberg High Yield Index sits just a handful of basis points above a 20-year low. That lack of risk premium is positive for risk assets more broadly as credit markets are effectively messaging well below-average default rates in the coming year. Rich current valuations paired with a hefty maturity wall that needs to be refinanced suggests sizable new issuance in the year to come as companies are going to be lining up to term-out outstanding debt issued at higher yields. Those supply expectations are dependent upon demand remaining robust, but current valuations leave little room for any sort of market misstep. In this environment we want to make sure we are liquidity providers, with the ability to buy discounted assets such as high yield corporate bonds if volatility ramps up. If high yield OAS tightens inside of 250-basis points and absolute yields fall closer to 6% with market participants overpaying, we look to remain underweight high yield bonds.
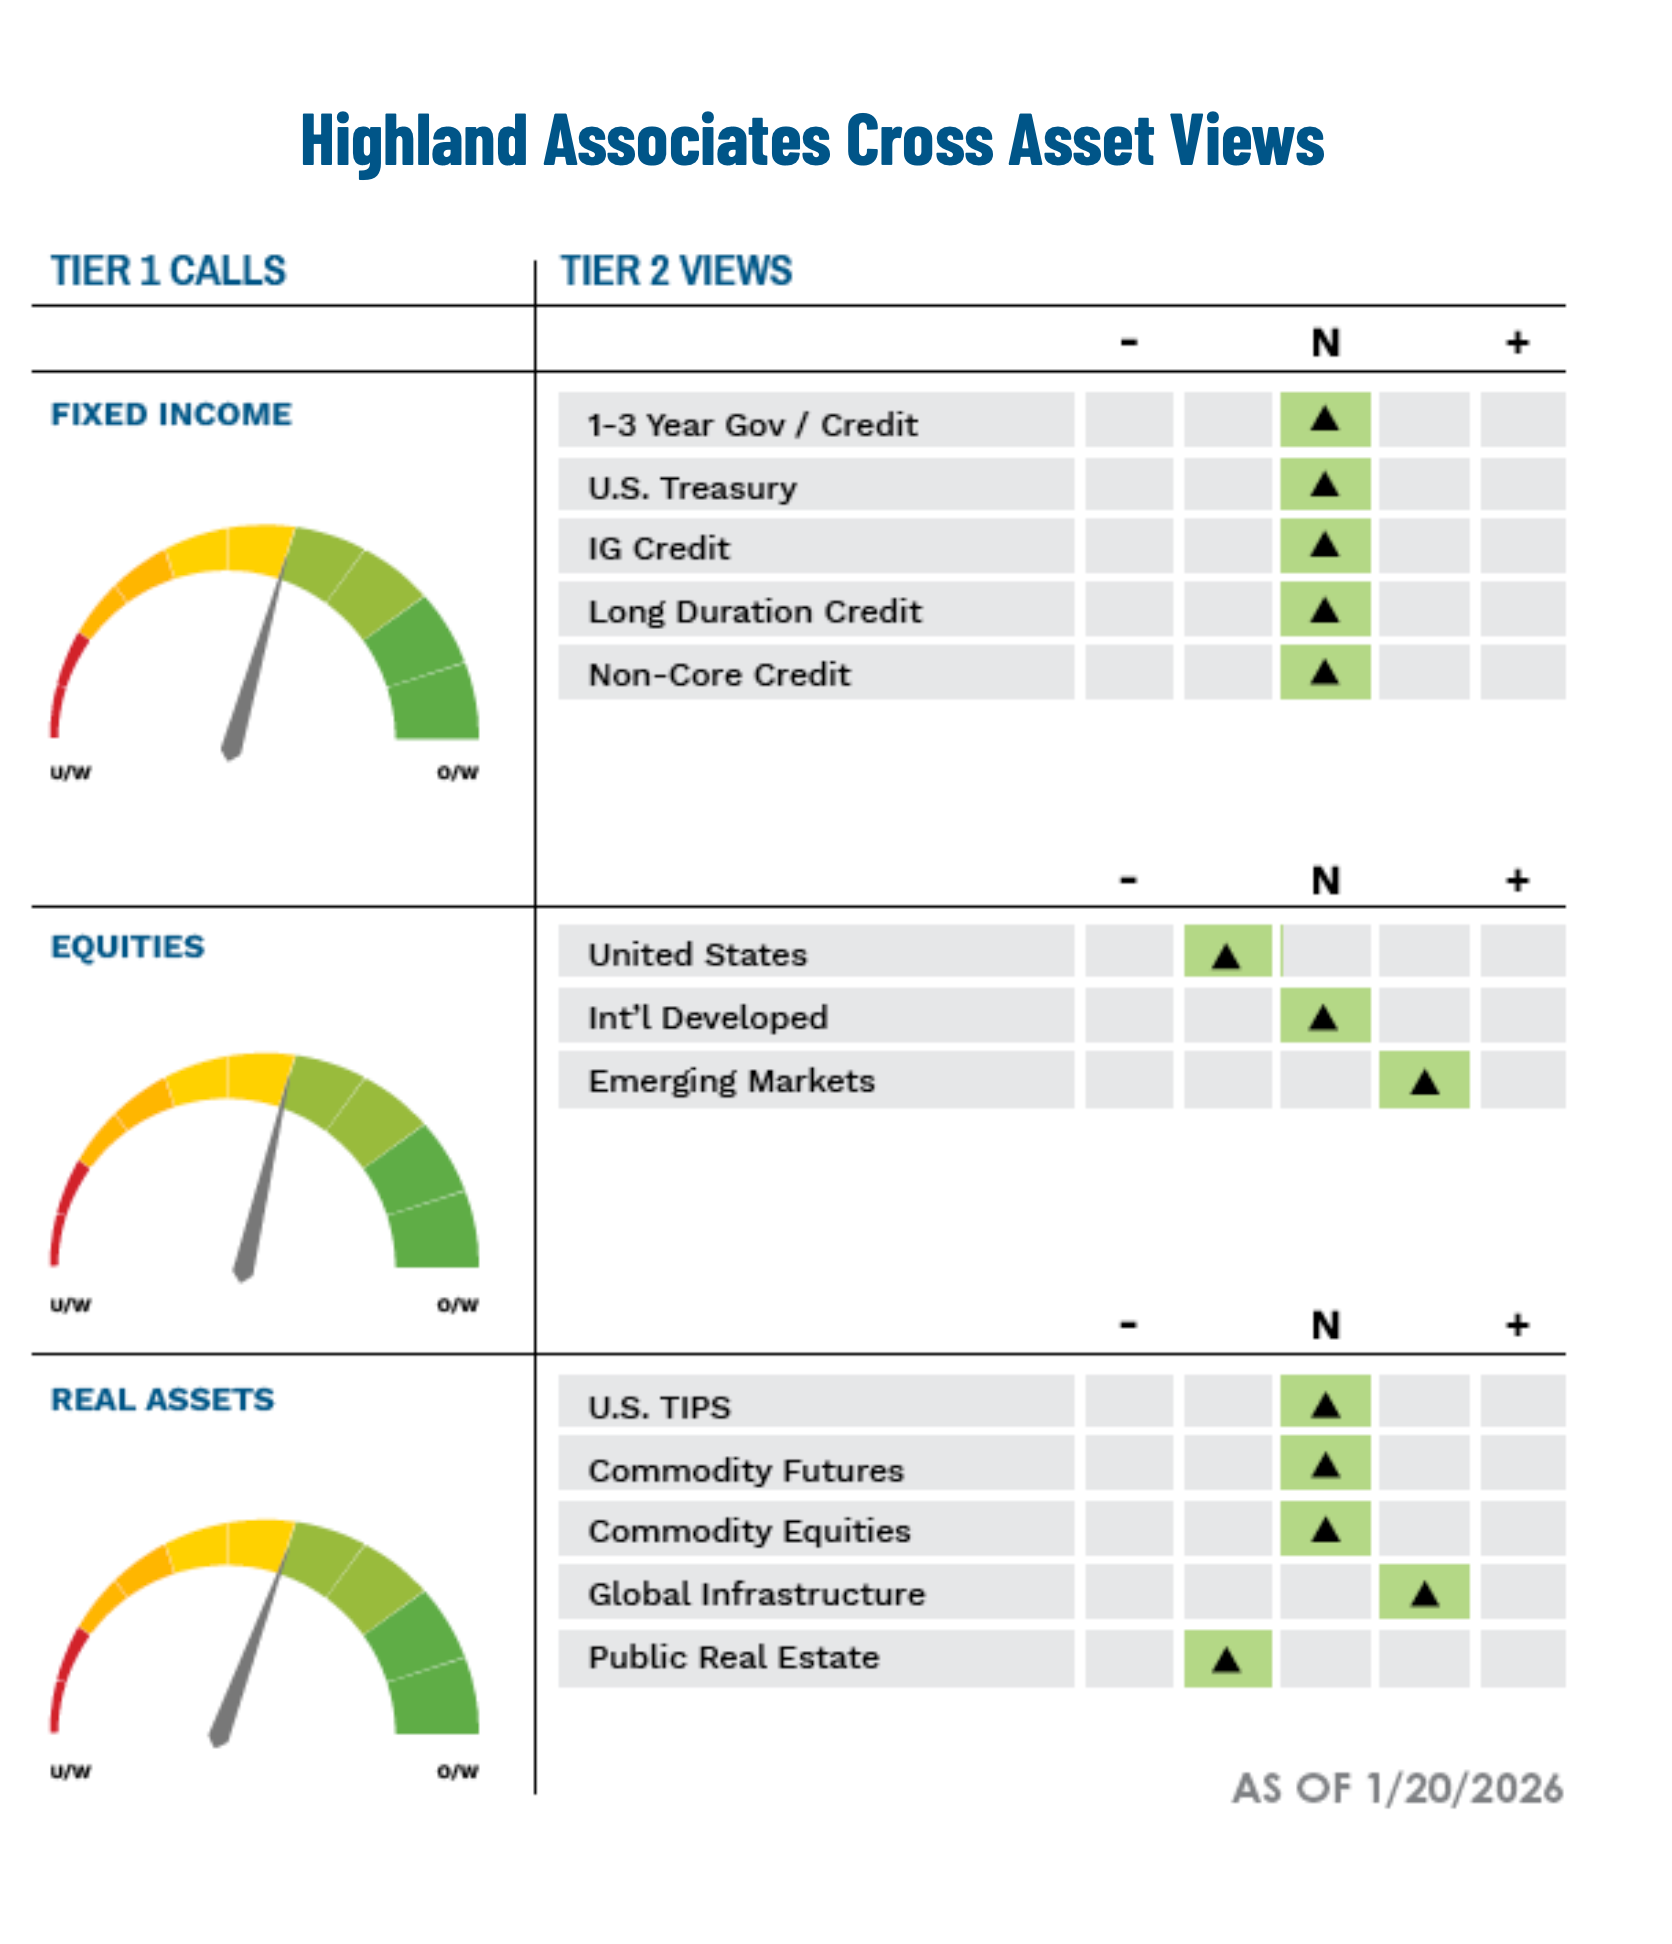
For the first time since 2017, U.S. equities underperformed both developed international and emerging market equities. Last year was one of only three years over the past 15 where that has happened, and we believe emerging markets may continue to offer relative opportunities depending on valuation, earnings trends, and risk conditions. To capitalize on this belief, Highland made the tactical decision to overweight emerging market equities relative to U.S. and developed international at the end of November. This dynamic was also seen in fixed income, where the U.S. bonds underperformed global bonds broadly. As spreads remain narrow relative to history, we continue to look for opportunities to increase exposure to areas with higher carry such as asset-backed securities. Portfolio diversifiers like inflation-sensitive assets remain a higher conviction due to inflation remaining persistently above 2.5%. Areas such as natural resource equities and global infrastructure outperformed the S&P 500 in 2025 and could continue to gather inflows as countries upgrade their infrastructure to support technological advancements related to artificial intelligence. With fixed income spreads so narrow and short- term rates hovering around 3.75%, we believe that hedge fund portfolios may offer better risk-adjusted returns than assets like high yield, especially in market drawdowns where high yield securities tend to sell off with equities. We remain vigilant as we enter 2026, carefully weighing market risks that may affect our base case scenarios to both the upside and downside.
IMPORTANT DISCLOSURES: This publication has been prepared by the staff of Highland Associates, Inc. for distribution to, among others, Highland Associates, Inc. clients. Highland Associates is registered with the United States Security and Exchange Commission under the Investment Advisors Act of 1940. Highland Associates is a wholly owned subsidiary of Regions Bank, which in turn is a wholly owned subsidiary of Regions Financial Corporation. Research services are provided through Multi-Asset Solutions, a department of the Regions Asset Management business group within Regions Bank. The information and material contained herein is provided solely for general information purposes only. To the extent these materials reference Regions Bank data, such materials are not intended to be reflective or indicative of, and should not be relied upon as, the results of operations, financial conditions or performance of Regions Bank. Unless otherwise specifically stated, any views, opinions, analyses, estimates and strategies, as the case may be (“views”), expressed in this content are those of the respective authors and speakers named in those pieces and may differ from those of Regions Bank and/or other Regions Bank employees and affiliates. Views and estimates constitute our judgment as of the date of these materials, are often based on current market conditions, and are subject to change without notice. Any examples used are generic, hypothetical and for illustration purposes only. Any prices/quotes/statistics included have been obtained from sources believed to be reliable, but Highland Associates, Inc. does not warrant their completeness or accuracy. This information in no way constitutes research and should not be treated as such. The views expressed herein should not be construed as individual investment advice for any particular person or entity and are not intended as recommendations of particular securities, financial instruments, strategies or banking services for a particular person or entity. The names and marks of other companies or their services or products may be the trademarks of their owners and are used only to identify such companies or their services or products and not to indicate endorsement, sponsorship, or ownership by Regions or Highland Associates. Employees of Highland Associates, Inc., may have positions in securities or their derivatives that may be mentioned in this report. Additionally, Highland’s clients and companies affiliated with Highland Associates may hold positions in the mentioned companies in their portfolios or strategies. This material does not constitute an offer or an invitation by or on behalf of Highland Associates to any person or entity to buy or sell any security or financial instrument or engage in any banking service. Nothing in these materials constitutes investment, legal, accounting or tax advice. Non-deposit products including investments, securities, mutual funds, insurance products, crypto assets and annuities: Are Not FDIC-Insured I Are Not a Deposit I May Go Down in Value I Are Not Bank Guaranteed I Are Not Insured by Any Federal Government Agency I Are Not a Condition of Any Banking Activity.
Neither Regions Bank nor Regions Asset Management (collectively, “Regions”) are registered municipal advisors nor provide advice to municipal entities or obligated persons with respect to municipal financial products or the issuance of municipal securities (including regarding the structure, timing, terms and similar matters concerning municipal financial products or municipal securities issuances) or engage in the solicitation of municipal entities or obligated persons for such services. With respect to this presentation and any other information, materials or communications provided by Regions, (a) Regions is not recommending an action to any municipal entity or obligated person, (b) Regions is not acting as an advisor to any municipal entity or obligated person and does not owe a fiduciary duty pursuant to Section 15B of the Securities Exchange Act of 1934 to any municipal entity or obligated person with respect to such presentation, information, materials or communications, (c) Regions is acting for its own interests, and (d) you should discuss this presentation and any such other information, materials or communications with any and all internal and external advisors and experts that you deem appropriate before acting on this presentation or any such other information, materials or communications.
Source: Bloomberg Index Services Limited. BLOOMBERG® is a trademark and service mark of Bloomberg Finance L.P. and its affiliates (collectively “Bloomberg”). BARCLAYS® is a trademark and service mark of Barclays Bank Plc (collectively with its affiliates, “Barclays”), used under license. Bloomberg or Bloomberg’s licensors, including Barclays, own all proprietary rights in the Bloomberg Barclays Indices. Neither Bloomberg nor Barclays approves or endorses this material or guarantees the accuracy or completeness of any information herein, or makes any warranty, express or implied, as to the results to be obtained therefrom and, to the maximum extent allowed by law, neither shall have any liability or responsibility for injury or damages arising in connection therewith.