
Download Asset Allocation | January 2022
It’s Too Soon to Know
Economic Update
Lots of Stuff May or May Not Happen in 2023
Regions Economic Division
As far as 2023 outlooks go, that’s about as clear and concise, not to mention precise, as we can be. Consider it the triumph of experience over hope. Really, if the experience of the past three years hasn’t been enough to dissuade one from making detailed predictions as to how the coming year will play out, nothing will. A year ago, we found ourselves wondering whether we’d settled into a new normal in which the only thing normal is that nothing is normal. In hindsight, thinking that 2022 would help answer that question was, well, hopeful, naive, or just downright foolish – take your pick. Then again, that we’re still asking that question may in and of itself be the answer to that question. Either way, 2023 is likely to be quite challenging for the U.S. economy.
With the caveat that making a forecast and having a high degree of confidence in that forecast are two different things, we offer this outline of how we see the economy playing out in 2023. After what we expect will be full-year 2022 real GDP growth of 2.0%, our baseline forecast anticipates real GDP growth of around 1.0% in 2023, with even slower growth in private domestic demand – combined business and household spending. We do not have a recession as our base case, putting us at odds with many of our counterparts. The last time we found ourselves so out of step with recession calls was 2019 when, coming into that year, many thought that the age of the expansion that started in 2009 meant that it was destined to end. That was of course nonsensical, but we will concede the case for recession in 2023 is much stronger.
There is no denying that a period of significantly elevated inflation and rising interest rates has soured consumer and business sentiment. Indeed, many CEOs have been making recession calls of late, which is not a trivial point, as we believe it is possible to talk yourself into a recession. One issue firms across a wide swath of industry groups are struggling with is trying to gauge the strength of demand, both near-term and long-term. While many firms faced extraordinarily rapid growth in demand over much of 2021 and 2022, that growth was in many cases a function of two factors: one, firms rushing to fill in the gaps left by production having been disrupted by the effects of the pandemic on the labor market, supply chains, and shipping networks, and two, firms building up inventories to levels higher than were considered normal prior to the pandemic as a hedge against further supply chain/labor supply disruptions. Much of that catch-up/precautionary demand began to wane in late-2022, leaving firms trying to right-size production plans. If firms are gearing up for a slower trend rate of demand growth, they will have less need to engage in capital spending. Indeed, leading indicators of business investment as reported in the GDP data weakened markedly in late-2022, leading us to downgrade our forecast of 2023 real GDP growth.
If enough of those with ultimate responsibility for calls on hiring and capital spending act accordingly, the effects will certainly be felt throughout the economy, particularly to the extent that consumers begin to doubt their job and income prospects and act accordingly when making spending decisions. As it is, we expect growth in consumer spending to slow considerably in 2023. Much as the rush of spending on consumer goods seen in the early phases of the pandemic has faded, and we expect that will be the case with the rush of spending on services seen over the back half of 2022. Although households are still sitting on elevated buffers of savings, we expect them to try to preserve at least some of these buffers, particularly with the incentive offered by higher interest rates.
While we look for further declines in construction and sales of single-family homes, we think that the housing market having been chronically undersupplied for the better part of the past decade puts a floor under demand. Indeed, applications for purchase mortgage loans were quick to respond to the dip in mortgage rates in late-2022, and we think that will also be the case as lower prices and falling mortgage rates ease affordability constraints as we move through 2023. That isn’t to say we expect a surge in home sales such as that seen in mid-2020, but instead a more gradual increase. Even if we are correct on this point, sales may come more out of current inventories of new homes under construction, which rose sharply over the latter half of 2022, as opposed to triggering significant increases in new single-family housing starts.
Although there are signs it has begun to cool off, the labor market is still characterized by a glaring imbalance between labor demand and labor supply. As of November, there were more than 10.4 million open jobs across the U.S. economy, down from a record of more than 11.8 million in March 2022 but still roughly 50% above pre-pandemic levels and equivalent to 1.7 open jobs for each unemployed person. What is puzzling is that, even with the economy having slowed and at best modest expectations for 2023, job vacancies remain so high, particularly as they remain elevated across all industry groups. The way labor demand and labor supply become more balanced will be a key determinant of how the economy fares in 2023. We expect falling job vacancies and reductions in hours worked to be the prime components of that rebalancing, as opposed to significant and widespread layoffs. If we’re wrong, however, and firms are more aggressive in laying off workers, the jobless rate will rise further and growth in personal income, consumer spending, and, in turn, real GDP will be lower than we now expect.
We anticipate the FOMC raising the Fed funds rate by 25 basis points at their January 31-February 1 meeting, with another like-sized increase possible at their March meeting. With clear, and at least to us convincing, evidence of the economy slowing, the labor market cooling, and inflation decelerating, we expect the FOMC to wind down its series of rate hikes. Winding down rate hikes, however, does not by any means suggest rate cuts are soon to follow and, with inflation lingering above their 2.0% target through most or all of this year, we do not expect the FOMC will cut the funds rate in 2023. There are obviously risks both ways – higher and more persistent inflation would surely lead to further rate hikes, while a more severe slowdown in the broader economy could be the catalyst for rate cuts.
As we all by now know well, stuff happens and things change, to use highly technical language, and our forecast can and will change as the year progresses. About the only thing we can be certain of is that by the end of 2023 the economy is unlikely to look as we now expect it to. What we don’t know right now is why that will be the case.
Sources: Bureau of Labor Statistics; Institute for Supply Management
Investment Strategy Update
Highland Associates and Regions Multi-Asset Solutions
With this being our first outlook piece of the new year, we thought it an opportune time to highlight a few broad themes currently factoring into portfolio positioning.
A bounce back year ahead for the “Balanced Portfolio,” with bonds doing the heavy lifting.
After experiencing its worst drawdown since 2008 last year, the “balanced portfolio,” either a 50/50 or 60/40 stock/bond portfolio, should bounce back in 2023, but buoyed by bonds, not stocks. Our capital market expectations for both stocks and bonds moved higher throughout the year, but we expect a challenging backdrop for stocks to persist in 2023 as economic and monetary policy uncertainty remains elevated, leading to concerns surrounding earnings growth, negative earnings revisions, and lower valuations over coming quarters.
Given the backdrop we anticipate in 2023, bonds should again become the risk-off asset class of choice. Broadly speaking, bonds offer the most attractive yields investors have seen in over a decade, and in the case of investment-grade and high-yield corporate bonds, credit quality metrics are encouraging and superior relative to historical norms when entering economic slowdowns/recessions. “Stickier” inflation driven by labor market tightness could force the FOMC to hike the Fed funds rate beyond what is currently expected, placing additional upward pressure on the short end of the yield curve, while also pulling the long end lower and further, inverting the yield curve as recession risks rise. While we are tempering our near-term expectations for stocks, we expect bonds to post a “coupon-plus” type of return over the coming year.
In the post–Global Financial Crisis world, with few exceptions, bond volatility has remained low, leading to a historically good run for risk-adjusted returns for balanced portfolios. Bonds can be beneficial not just via lower correlations to stocks, but also by the lower volatility nature of the asset class relative to stocks. 2022 was an outlier in this regard as interest rate volatility was a constant, leading to excessive volatility and drawdown for fixed income and balanced portfolios alike. However, we expect interest rate volatility to subside over coming quarters, particularly in the back-half of the year, leading to improved risk, or volatility-adjusted returns.
Balanced Calendar Year Returns
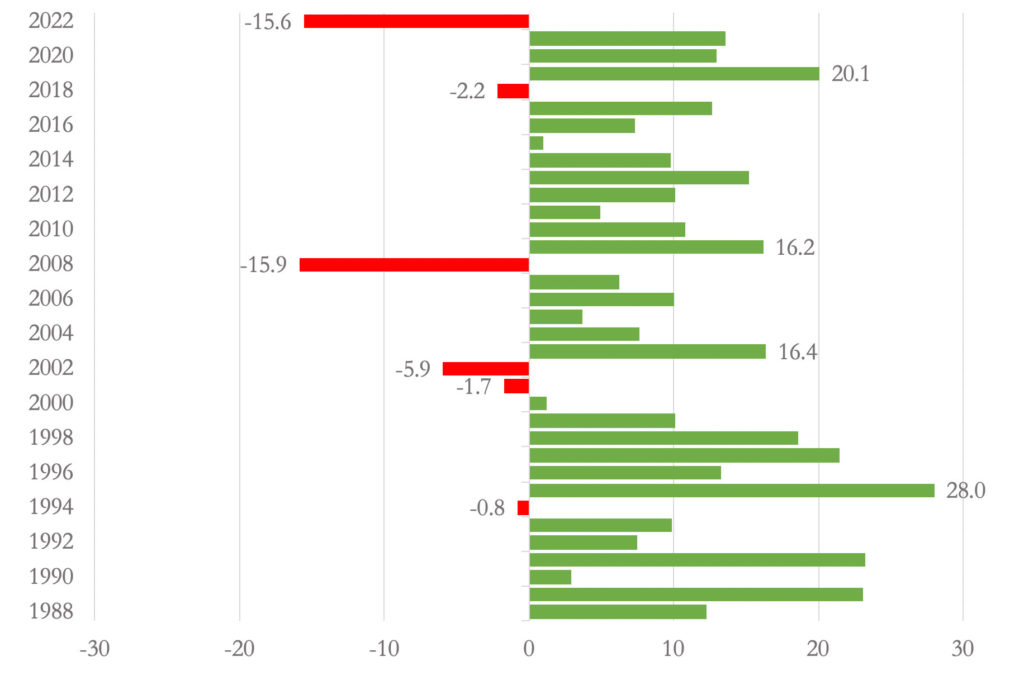
*Bloomberg; data from January 1, 1988, through December 31, 2022
A higher Fed funds rate boosts expected returns for not just bonds but also select alternative strategies.
Elevated and stickier than anticipated inflation led to a more aggressive pace of monetary policy tightening than many, including us, anticipated, and sent interest rates and bond yields soaring in 2022, painfully paving the way for higher expected future returns. The FOMC delivered the sharpest rise in the fed funds rate dating back to 1986, which had a meaningful negative impact on bond prices and therefore returns during the year, generating the first back-to-back negative calendar year return for bonds in the last 30-plus years. Increases in yields, while painful, are a strong predictor of future returns. Since 2000, there has been a 0.94 correlation between the five-year rolling return for the Bloomberg Aggregate Bond Index and the starting yield for the index. This dynamic bodes well for investors in core, investment-grade fixed income with a five-plus year investment time horizon.
Starting Yield & Total Returns – Bloomberg Aggregate Bond Index
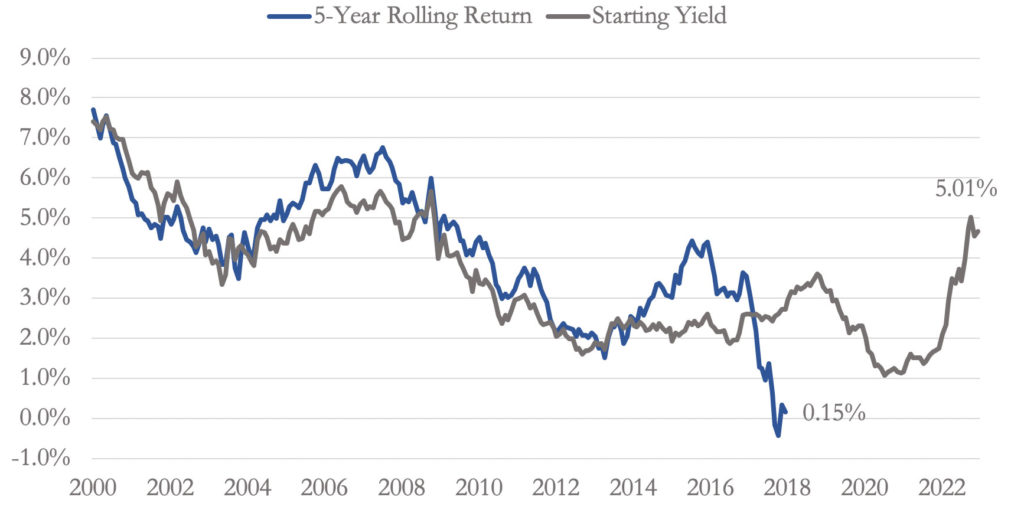
*Bloomberg; data from January 1, 2000, through December 31, 2022.
However, traditional fixed income isn’t the only beneficiary of rising interest rates, as select alternative strategies that utilize cash as collateral or capture a spread linked to the risk-free rate stand to gain as well. Trend strategies are an illustration of this as futures positioning allows these managers to get full notional value while holding most of the portfolio in cash/short-term bonds as low-risk collateral for margin. Relative value and long short strategies that involve short selling also stand to benefit from recent interest rate rises. These strategies are often given a “short rebate,” typically a risk-free rate of interest (SOFR) minus a small spread. With 30-day SOFR at over 4.0%, this increases expected return meaningfully for many market-neutral managers. Macro strategies also keep excess collateral, which can vary from 60% to 80%, in short-dated government bonds. Lastly, corporate and securitized credit strategies often involve some component of both fixed and floating rate instruments, with securitized strategies typically having more floating rate exposure. As a result, credit return expectations have increased roughly in line with interest rate hikes.
When we look back, near-zero policy rates since the Global Financial Crisis reduced the return potential for these alternatives, but the investing landscape has shifted in a more beneficial manner. Heightened volatility across asset classes should also increase demand for diversification strategies, as defensive posturing will likely be rewarded in the near term.
Real assets poised to continue to deliver tangible portfolio benefits over a tactical and strategic time horizon.
*Bloomberg; data from January 1, 2000, through December 31, 2022.
Exposure to diversified real assets proved beneficial in 2022, and we expect this to continue in the coming years as investors place a premium on earnings stability and income/cash flow generation. Commodities and natural resource equities posted strong gains in 2022 as U.S. crude oil prices briefly topped $130/barrel in March, a 13-year high, following the invasion of Ukraine. Private real estate also continued its march higher for the year despite dislocations in public real estate markets.
A diversified and nimble approach to investing in real assets is desirable given that some real assets zig while others zag. For example, commodities, as a broad basket, fare best during periods of rising inflation when the outlook for economic growth is improving, and worst in periods of falling inflation/lower expectations for economic growth. Meanwhile real estate, infrastructure, and TIPS provide a ballast for portfolios and tend to hold up relatively well during periods of stable/falling inflation.
Inflation is expected to remain above the FOMC’s 2% target into 2024, with several factors posing upside and downside risk to this forecast. Further disruptions in supply chains and shipping networks would be a source of continued upward pressure on goods prices, while commodity and energy markets remain vulnerable to supply shocks. A nimble and more tactical approach within real assets is a requirement to take advantage of short-term dislocations and successfully ride trends as they materialize.
Average Real Returns in Various Inflation Regimes
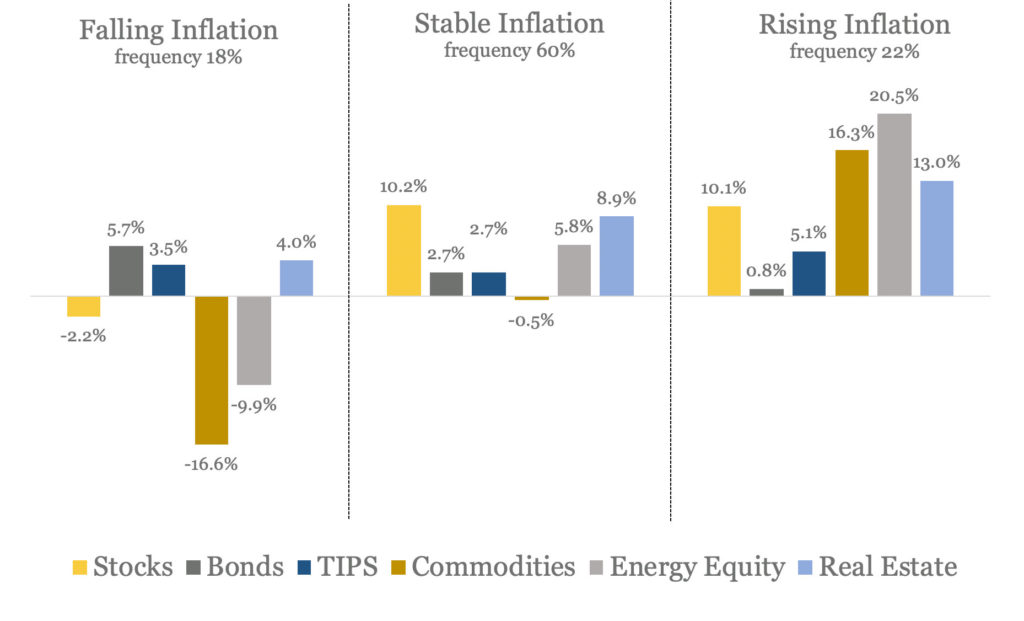
*Average annual real returns in Falling, Stable, and Rising inflation periods. March 1997 – December 2021. A Rising inflation period is defined when the 3M YoY CPI monthly moving average is greater than the 12M CPI moving average by at least +0.5%. A Falling inflation period is defined when the 3M YoY CPI monthly moving average is greater than the 12M CPI moving average by less than -0.5% or more. Stable is any period not defined as Rising or Falling. Index Data: Stocks – S&P500 Index; Bonds – Barclays US Aggregate Index; TIPS – Barclays US TIPS Index; Commodities – Bloomberg Commodity Index; Energy Equity – S&P Energy Index; Real Estate – FTSE NAREIT All Equity Index. Source: eVestment
Highland Associates Cross Asset Views
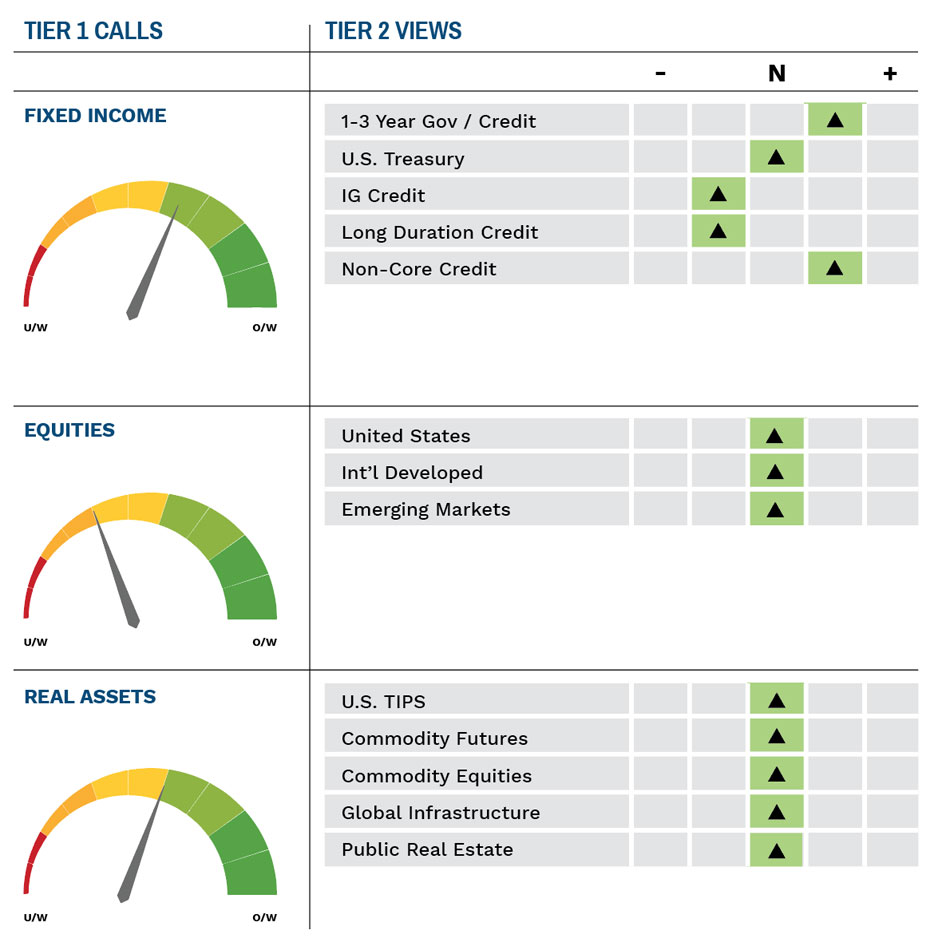
As of January 17, 2023