
Download Asset Allocation | February 2026
Change
Despite the return of volatility during the winter months, the world seems scarcely changed in recent quarters, like frost that refuses to thaw. The persistent specter of geopolitical conflict—recently intensified by renewed rhetorical hostilities between the U.S. and Iran—continues to cast a long shadow over global stability. On the domestic front, one of the most notable changes has been the announcement of Kevin Warsh as the new Fed Chair. While he has yet to be confirmed, markets have already adopted a more cautious posture, reflecting the uncertainty ahead as we all play parts of tomorrow.
Information Technology, the S&P 500’s dominant force for more than a decade, and Communication Services, the three-year leader, have both fallen to the bottom third of 2026 sector rankings as questions grow over AI’s potential to disrupt the very champions it once propelled. Given how heavily U.S. equity performance has relied on these sectors, their reversal raises deeper questions about the endurance of U.S. market leadership. The S&P 500 has outperformed international and emerging equity markets in nearly every rolling three year calendar period since 2008 and 20121, respectively, but I know we can’t all stay here forever. Change is rarely easy, as Blind Melon once sang, and investors now confront the possibility that creative destruction may carry heavier consequences than once assumed. Time will tell if our global and sector champions resume their market dominance or if their long reign already coming to an end.
1 Source: Highland Associates, S&P Global, Bloomberg
Economic Update
The More Things Change, The More they Stay the Same
Regions Economic Division
At least so far, the start of 2026 sounds and feels a lot like the end of 2025, with another shutdown of the federal government to help set the tone. This year’s shutdown, however, was much shorter and far less disruptive than last year’s shutdown. A labor market that wobbled over the second half of 2025 is still a concern for many. Though it may be less vol-atile than in 2025, trade policy nonetheless remains some-what uncertain, and it remains to be seen whether stronger tariff pass-through will push goods prices up further in 2026. As it is, the cumulative effects of higher prices over the past few years and concerns over the labor market continue to weigh heavily on consumer sentiment. The housing market continues to labor under the weight of affordability con-straints that are holding down home sales and new con-struction. The FOMC remains sharply divided over the main risks facing the economy and, in turn, the appropriate path of monetary policy. Amid all of this, however, the economy continues to grow at a sturdy pace.
That there are still so many holes in the economic data stemming from last year’s shutdown leaves room to question just how rapidly the economy is actually growing, and many are pointing to the divide between real GDP growth and monthly job growth as grounds for doing so. That divide widened considerably over the second half of 2025 as the pace of hiring slowed to a crawl, and there is little to suggest that divide has narrowed thus far in 2026. While we can point to swings in net exports and nonfarm business inventories that were even sharper in 2025 than is typical for these two inher-ently volatile components of GDP as one factor in the divide between job growth and real GDP growth, that isn’t a very satisfactory answer given that there is a similarly wide divide between job growth and growth in real private domestic demand, i.e., combined business and household spending.
Moreover, the Bureau of Labor Statistics (BLS) released their annual benchmark revisions to the recent historical data on nonfarm employment, hours, and earnings, which suggest an even wider divide between job growth and economic growth, however measured, than had previously been implied. Coming months could see similar annual benchmark revisions to much of the source data that feed into the Bureau of Economic Analysis’ (BEA) measure of real GDP but, given the magnitude of the divide between job growth and economic growth, it would take meaningful downward revisions across a wide swath of the economic data series to narrow that di-vide. Based on available data, we have little reason to expect that to occur.
As the data now stands, Q4 real GDP growth may come in faster than we had anticipated, even allowing for a significant drag from the federal government shutdown. The data on retail sales point to Q4 growth in consumer spending on goods being faster than our forecast had anticipated, while the data on shipments and orders of core capital goods suggests the same for business investment in equipment and machinery. Both consumer spending and business investment ended 2025 on solid notes, and if current trends persist, we expect this momentum to have carried into 2025. One key reason to think so is that the changes in the individual and corporate tax codes enacted into law last summer are likely to provide meaningful support for consumer spending and business investment.
If we are correct in anticipating real GDP growth to be faster in 2026 than was the case in 2025, it would follow that at some point there would be a pickup in the pace of nonfarm job growth. To that point, the January employment report shows private sector payrolls increased by 172,000 jobs in January. We do not, however, think that to be a sustainable pace throughout 2026 as a whole. In other words, we look for a continued divide between job growth and economic growth.
One way to bridge that divide is via faster growth in labor productivity, and the longer-term trend rate of labor productivity growth has been steadily firming. What is largely overlooked is that the acceleration in the trend rate of labor productivity growth – we use an eight-quarter moving average – actually began over the back half of 2017, which we argued was firms reacting to considerably tighter labor market conditions. The acceleration in productivity growth, however, was disrupted by the pandemic, and it took considerable time for those effects to wash through the data. As such, we see the acceleration in productivity growth over recent quarters as a continuation of a trend in place prior to the pandemic, long before AI became as prominent as it now is. Our view is that we are in the very early stages of AI being the primary driver of a prolonged period of meaningfully faster labor productivity growth.
While there could be some degree of displacement in the labor market due to the development and utilization of AI, we still think AI could do more to augment labor productivity than to replace labor. In other words, we see AI as something to be more welcomed than feared, though we are fully aware that this view is far from universal. We find it useful to discuss this issue in the context of the economy’s “speed limit,” i.e., the rate at which it can grow on a sustained basis over time without sparking inflation pressures. For any econo-my, the speed limit is a function of two things – the rate of growth of total labor input and the rate of labor productivity growth. While the ongoing acceleration in labor productivity growth will work to increase the U.S. economy’s speed limit, demographic factors are likely to blunt some of that gain.
This point was recently reinforced by the release of the Census Bureau’s estimates of 2025 population growth. After growth of 1.0 percent in 2024, total U.S. population grew by only 0.52 percent in 2025, ending a three-year run of notably faster growth fueled by international immigration. Over the 2022-2024 period, international immigration accounted for just over eighty-five percent of all U.S. population growth, and while the rate of international immigration over this period was not sustainable, the pendulum has swung to the opposite direction. Net international immigration fell from 2.734 million persons in 2024 to 1.262 million per-sons in 2025, with every state in the U.S. seeing a decline from 2024. Moreover, we think that the 2025 figures for net international in-migration are overstated. Keep in mind that Census reports the annual population changes not on a calendar year basis but on a July/July basis, and our sense is that the latter months of 2025 likely saw further outflows of foreign-born persons that have not yet been picked up in the Census estimates.
If we are correct on this point, it follows that the 2026 vintage population estimates may show a more severe drop- off in net international immigration than that reported in the 2025 vintage data which, in turn, would mean further deceleration in total population growth. Either way, the drop-off in international immigration in 2025 exposes the long-running weakness in natural population growth (the difference between births and deaths in a given time period), reflecting the secular decline in birth rates. With diminished flows of international in-migration to counter weakness in natural population growth, the U.S. is due for a period of decelerating population growth. This, in turn, means slower labor force growth and a lower speed limit for the economy than would otherwise be the case.
Again, while faster labor productivity growth could mitigate the drag from slower labor force growth, where all of this nets out remains to be seen. This is a particularly relevant question given that Kevin Warsh has been an active proponent of the notion that the U.S. economy is on the verge of a significant, sustained acceleration in productivity growth that can help prompt faster real GDP growth and lower inflation, which he believes would warrant the Fed funds rate being lower than it presently is. While we do not disagree with the premise of a significant, sustained acceleration in labor productivity growth, it isn’t clear to us that Mr. Warsh is accounting for the effects of meaningfully slower labor supply growth, unless he is assuming productivity growth will be rapid enough to more than offset slower labor supply growth.
This is a question that will likely be answered over time. For now, we look for solid real GDP growth in 2026 but see limited room for further Fed funds rate cuts. While the economic data series never move in straight lines, we can at least hope for less volatility this year than we saw in 2025.
Sources: Bureau of Economic Analysis; Bureau of Labor Statistics; U.S. Census Bureau
Investment Strategy Update
Regions Multi-Asset Solutions & Highland Associates
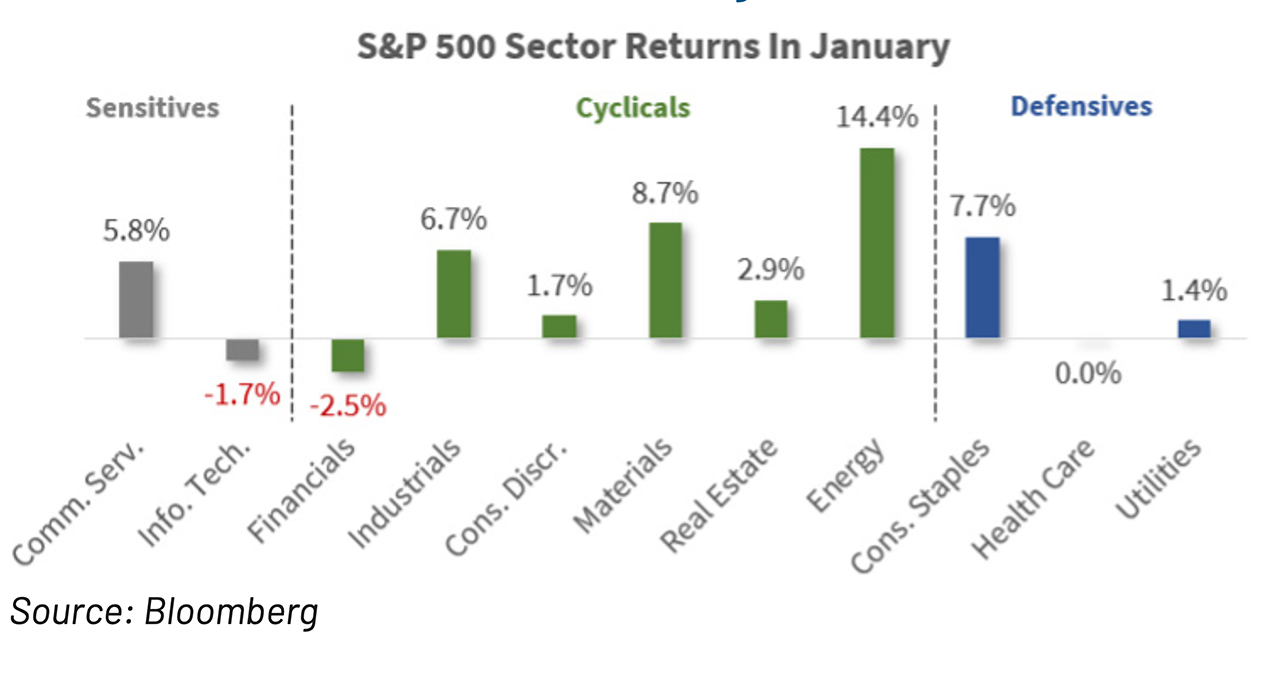
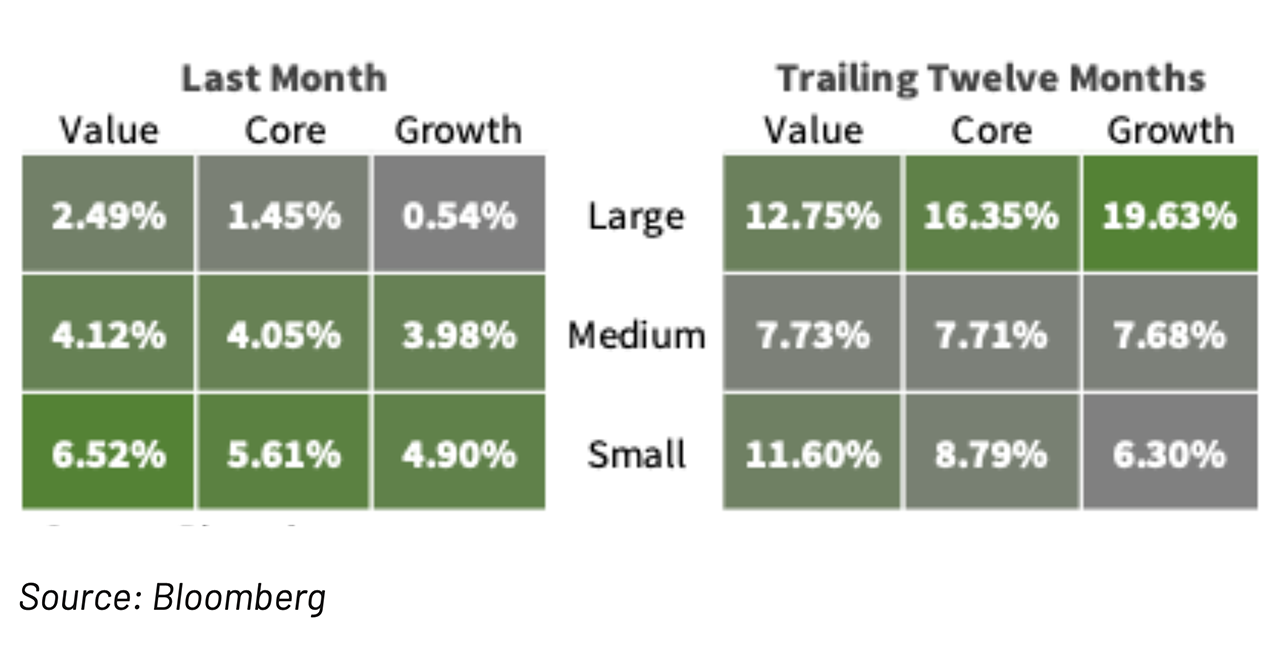
U.S. equity indices closed out a tumultuous and headline driven January in positive territory with smaller capitalization stocks outperforming. The S&P Small Cap 600 index rose 5.6% on a total return basis during the month, easily outpacing the S&P 500’s 1.4% gain. If history repeats, a positive return for full-year 2026 is likely in store for stocks; historically, when the S&P 500 generates a gain in January, it goes on to post a gain for the 1st half and full year approxi-mately 80% of the time. Simply put, the ‘January Barometer’ could be on the side of bulls after a solid start to 2026. From a sector perspective, Consumer Staples, Energy, Industrials, and Materials were the top performers within the S&P 500 as each posted a gain of 6% or more in January. But strength out of these areas was offset by softness in Information Technology and Financials, which both printed modest declines and weighed on the index’s return. As was the case in November and December, capital continued to rotate out of some of last year’s winners tied to the AI theme and found its way into a diverse group of sectors ranging from defensive to economically sensitive, with a bias toward smaller cap stocks. On the surface, this is positive as rotation and the search for relative value is the lifeblood of a healthy market, but some of the sector relationships we turn to as a gauge on investor sentiment and risk appetite started to signal caution toward the end of the month and warrant continued monitoring.
First, Consumer Staples and Energy sectors exhibited improved relative performance during January and drastically outperformed Consumer Discretionary, a potentially worrisome indicator surrounding the health of the U.S. consumer. Secondly, the Financials sector fell 2.5% on the month despite continued steepening of the Treasury yield curve and signs the U.S. economy could be reaccelerating. While this is a suboptimal outcome, it appeared to be rotation driven as opposed to outright selling, as regional banks gained over 5% as a group and outperformed the super-regional players, which fell 2% as profit taking took hold. Historically, banks at large have been an accurate barometer or gauge on the health of the U.S. economy, and it’s tough to get too bearish with regional banks holding up and the yield curve steepening due to improved economic growth expec-tations. Lastly, areas that performed quite well during the month, such as U.S. small caps and emerging market stocks, hit overbought levels and may need to move sideways to digest such sizable short- term gains before resuming their uptrend.
A strong start to the year on the manufacturing front, if the January ISM is to be believed, reinforces market participants’ preference for cyclicals as this is potentially just the beginning of a powerful capex spending cycle capable of boosting economically sensitive sectors. The rotation out of AI in the information technology sector and into economically sensitive areas has provided a headwind for the broader S&P 500 given the tech sector’s 34% weight within the index, making stabilization in tech a necessity for sizeable leg higher in large caps. However, we expect tax refunds to boost consumer spending and an uptick in corporate capex to lead to improved labor productivity contributing to im-pressive growth in corporate profits. Based on that outlook, we maintain a constructive outlook on U.S. stocks.
S&P 500 Sectors Returns in January
The beginning of February has been volatile, but it is difficult to be bearish with small cap stocks and transports outperforming. Software’s shakeout may have gotten all the attention last month, but there were other reasons to remain constructive on broader U.S. equities. Most notably, the equally weighted S&P 500 posted a 3.3% gain on the month and has now outperformed the market cap weighted S&P 500 by 4.5%, through early February. This outperformance highlights the fact that investors didn’t totally jettison their stock holdings as volatility surged in recent weeks, instead the selling pressure concentrated on stocks viewed as most at risk from AI disruption. We were particularly encouraged by the continued rise in ‘real economy’ stocks, represented by the Dow Jones Transportation Index, which rose 5.4% in January. That price level marked a new all-time high for the index that is now higher by 14.3% year-to-date through early February. Lastly, the S&P Small Cap 600 index posted a gain on the month of 5.7% handily outperforming the S&P 500. The weakness early in January has been limited to software, but other thematic momentum trades including emerging equities and short dollar positions were swept up in the shakeout as market dynamics suggest algorithmic trading and leveraged positioning may have contributed to volatility, though multiple factors were likely involved. That downturn, while painful at the industry level, may create opportunities for investors not forced to sell to increase exposures in select names at better valuations/prices.
U.S. Equity Size & Style Returns
Emerging market stocks could see some consolidation after a red-hot start to the year. Countries such as Brazil, Mexico, South Korea, and Taiwan have already generated double- digit returns in 2026, so we could expect some moderation over the next few months. Technicals remain favorable as these countries continue to trade well above their 50- and 200-day moving averages with impressive broad leadership from constituents. However, relative strength at month-end signaled these countries may be “overbought” at a level not seen since 2018. These levels have since subsided through the first half of February2 without significant price declines, suggesting markets have taken some time to digest the move-ment. Because of these conditions, a 5% or 10% decline over the near-term may not surprise us, but EM tailwinds remain plentiful and the upward trend remains in place. We remain constructive on emerging market stocks, broadly speaking, and see reasons to believe that last year’s winners such as South Korea and Taiwan can continue to ride the memory cycle to more gains. Additionally, some of this year’s budding outperformers in Latin America have cyclical tailwinds that could persist throughout the balance of this year, and central bank easing could be a catalyst for potentially material upside in the quarters to come for Brazil and Mexico, specifi-cally. With a U.S./India trade deal announced in early February, we will be watching India’s SENSEX index for signs of a durable bottom which could provide a potential springboard for Indian equities in the quarters to come.
The Treasury market has remained remarkably calm despite a flurry of potentially market moving headlines related to tariffs/trade, Iran, the nomination of a new Fed chair, and a par-abolic jump and equally unsettling selloff in precious metals, just to name a few. The 10-year Treasury yield opened the month at 4.18%, moved up to 4.30% mid-month as Treasur-ies caught a bid on more U.S./Iran saber rattling, and closed out January at 4.26%, still within the 4.10% to 4.30% range it’s been stuck in since early December.
President Trump’s announcement in late January that he was nominating Kevin Warsh to chair the Federal Open Market Committee (FOMC) was surprising as he was viewed by market participants as the most ‘hawkish’ of the leading candidates. Equity market volatility jumped following the announcement, but the bond market took it in stride and fixed income investors appear to be in ‘wait and see mode’ in the lead-up to Warsh’s confirmation hearings. Warsh has been out of public eye for some time working in the hedge fund industry, so as market participants get clarity and confirmation on his views surrounding the size of the Fed’s balance sheet, the path forward for rates, and the regulatory backdrop, we would expect interest rate volatility to increase and the yield curve to likely steepen further.
Interest rate volatility could pick up as corporate capex and consumer spending put upward pressure on inflation expectations and economic growth forecasts in the coming months. Thus, a nimble and more tactical approach to the fixed income market may be rewarded this year as relative value opportunities undoubtedly arise but will likely be short-lived. An increased exposure to U.S. Treasuries can act as a volatility dampener, but we are still looking for a coupon-minus return over the balance of this year. Investment-grade and high yield corporate bonds remain historically ‘rich’ even after experiencing a modest selloff in early February, and a rebound, i.e., tighter credit spreads in high yield could provide investors with a chance to trim exposure. Debt tied to developed and developing market issuers still appeal to those seeking to diversify U.S. dollar exposure, but investors in EM bonds should have tempered expectations after a strong multi-year advance. Regarding potential near term opportunities, we are evaluating opportunities in the asset-backed securities (ABS) market, broadly speaking, to gauge the relative attractiveness of this segment for potential portfolio inclusion.
Attractive securitized credit yields come with caveat. Opportunities to add value in traditional market segments includ-ing high yield and investment grade credit have been waning as valuations tighten, prompting our attention towards more off-the-run bond sectors with the aim of reducing or diversifying undue portfolio risks. Specifically, tighter credit spreads and the potential for higher interest rate volatility based on monetary and fiscal policy uncertainty suggests there is more risk than reward in adding to corporate bonds at this point in the cycle. However, there are select areas to trade up in quality for similar yield in areas like securitized credit that offers an index yield to worst of 4.6% relative to the 4.8% found in high grade corporates. The Bloomberg US MBS Index consists entirely of AA-rated mortgage bonds while the Bloomberg US Agg Corp Index has over 90% of its assets in A- and BBB-rated paper, but that uptick in quality is far from a free lunch as mortgage spreads have come in considerably over the last year. Early in January that rally accelerated as the U.S. administration directed Fannie Mae and Freddie Mac to buy $200B in mortgage bonds, and now the asset class carries an option adjusted spread just 17bps over treasuries. From our standpoint, the improvement in credit quality is a strong selling point for securitized credit but the asset class just doesn’t have the margin of safety we seek out in an opportunistic position at present.
Corporate bond markets have seen hefty issuance to start 2026, with over $30B in new paper coming to market in January, a 32% uptick from January of last year. That surge in new deals fits with market expectations of rampant issuance due to both a favorable environment with tight spreads and lower rates at the front of the curve but may also be the byproduct of heightened capex spending and potential M&A activity. That elevated issuance and the current market maturity wall could be a potential strain on credit markets should liquidity dry up in a volatile stretch, but momentary drawdowns for risk assets witnessed thus far in 2026 have yet to pressure on valuations. Should the option-adjusted spread on the Bloomberg U.S. High Yield Corp index make another run at the 250bps over treasuries we’d anticipate more disciplined investors lightening up exposure, but it’s tough to forecast where that capital rotates into with cash rates coming down and potential volatility in the cards.
In normal environments a gain on the S&P 500 Index in January feels like a win with the “January Barometer”, but the Santa Claus rally was bumpy this year. Volatility in U.S. equities has risen and the US dollar fell sharply in the wake of geopolitical risks. The rally has since fizzled out as fears of Artificial Intelligence disrupting the software industry have grown and the S&P 500 is now flat in 2026. U.S. software names have been the biggest detractor, and this dynamic has benefited from the tactical overweight Highland made to emerging market equities within equity portfolios last year. A falling US Dollar has also contributed, and we saw the trade-weighted US Dollar briefly fall below $96 for the first time since 2022. While it seems to have found support in the $96 range, this is a trend we are closely monitoring, and further dollar weakness could have larger ramifications on corporate earnings and consumer purchasing power. Commodities soared to start the year, rising 10.4% in January on the back of strong demand for precious metals. The index has given some of these gains back as the metals have fallen in February, but the upward trend remains in place and gold specifically has risen nearly 140% since the end of 2024.
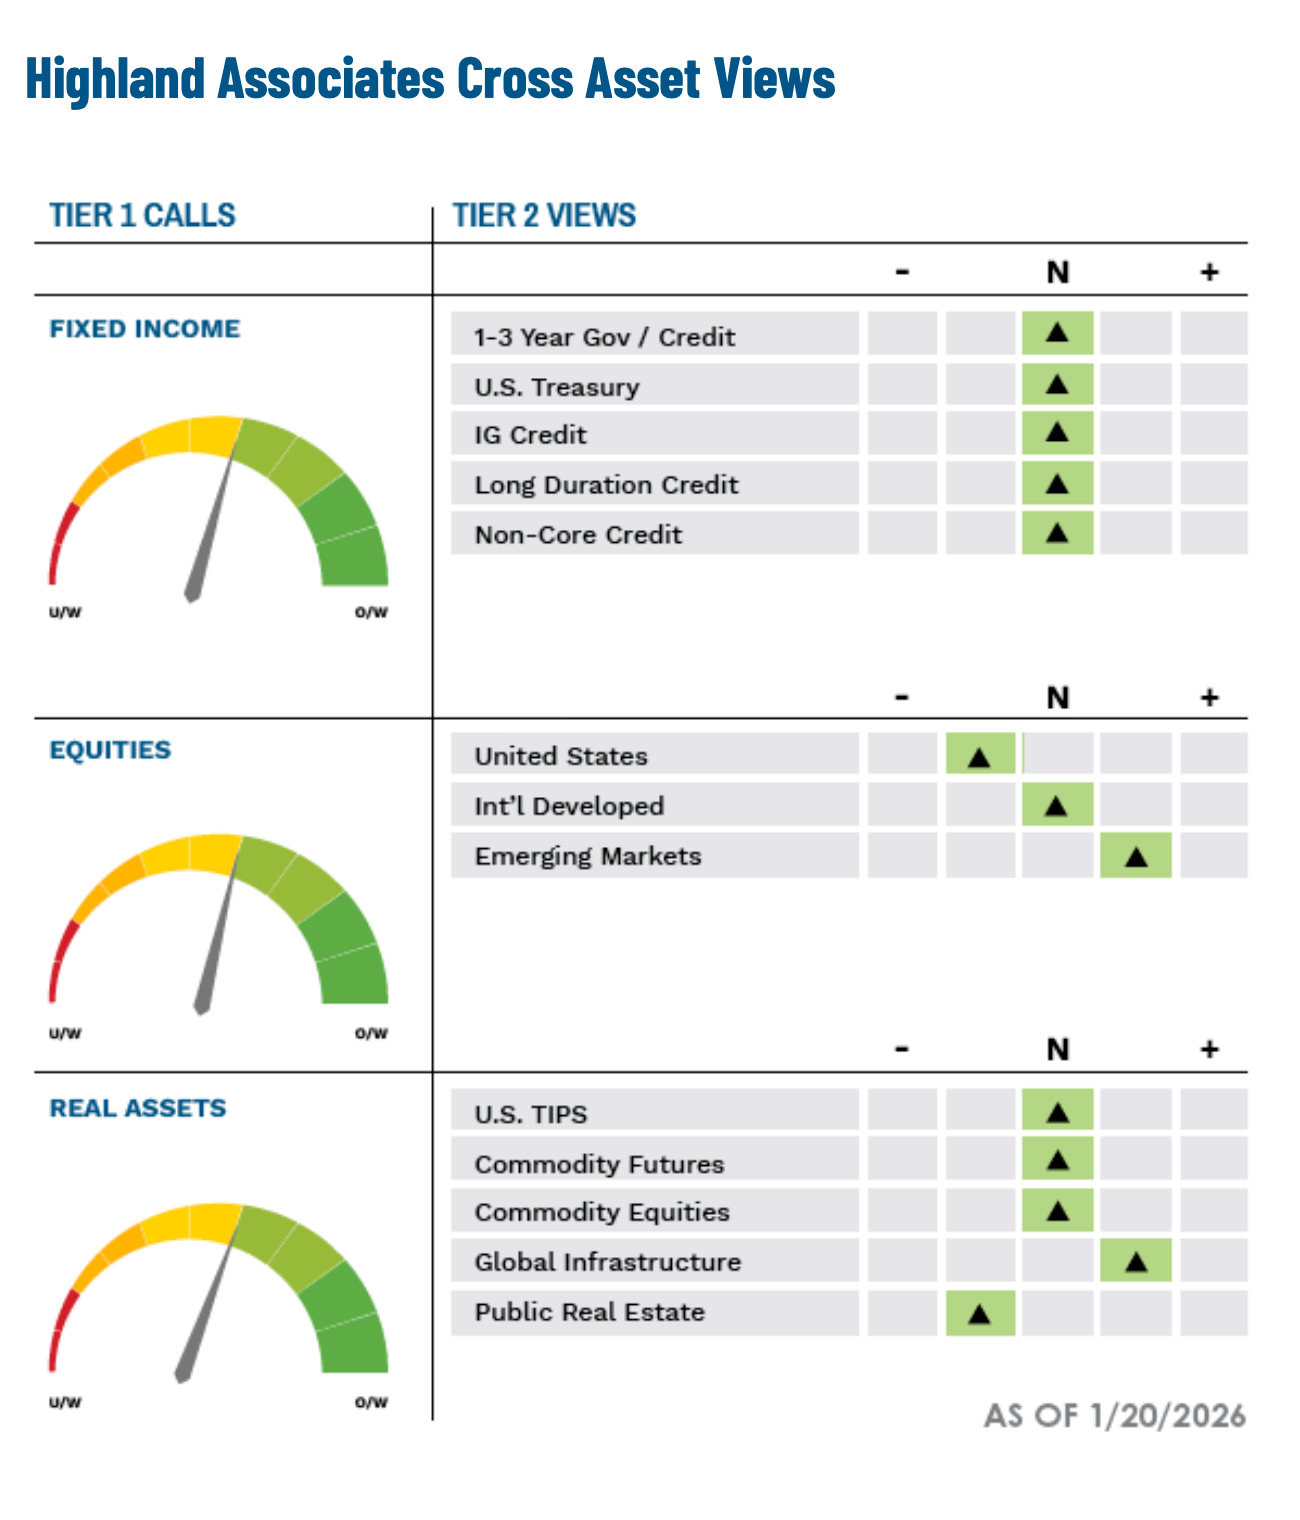
Highland Outlook
Portfolios with dedicated allocations to natural resource equities and commodities have reaped the benefits of this move, while investors holding broad equity index exposure have seen less impact from the moves in commodities. Highland continues to favor inflation-sensitive exposure as a complement to equity portfolios as these companies have little representation in the broader indices. Fixed income portfolios were relatively flat to start the year as interest rates rose slightly in January, but yields have since fallen in the wake of equity market volatility. With tight corporate spreads and an approximate 46% weighting in US Treasuries, the performance of the Bloomberg US Aggregate Bond Index has little room to benefit from anything other than current yield or duration. High yield has posted positive returns despite widening spreads, but we expect potential weakness if equity markets continue to move lower. We remain com-fortable with our current risk- neutral allocation given market volatility and will look to tactically adjust as markets settle.
IMPORTANT DISCLOSURES: This publication has been prepared by the staff of Highland Associates, Inc. for distribution to, among others, Highland Associates, Inc. clients. Highland Associates is registered with the United States Security and Exchange Commission under the Investment Advisors Act of 1940. Highland Associates is a wholly owned subsidiary of Regions Bank, which in turn is a wholly owned subsidiary of Regions Financial Corporation. Research services are provided through Multi-Asset Solutions, a department of the Regions Asset Management business group within Regions Bank. The information and material contained herein is provided solely for general information purposes only. To the extent these materials reference Regions Bank data, such materials are not intended to be reflective or indicative of, and should not be relied upon as, the results of operations, financial conditions or performance of Regions Bank. Unless otherwise specifically stated, any views, opinions, analyses, estimates and strategies, as the case may be (“views”), expressed in this content are those of the respective authors and speakers named in those pieces and may differ from those of Regions Bank and/or other Regions Bank employees and affiliates. Views and estimates constitute our judgment as of the date of these materials, are often based on current market conditions, and are subject to change without notice. Any examples used are generic, hypothetical and for illustration purposes only. Any prices/quotes/statistics included have been obtained from sources believed to be reliable, but Highland Associates, Inc. does not warrant their completeness or accuracy. This information in no way constitutes research and should not be treated as such. The views expressed herein should not be construed as individual investment advice for any particular person or entity and are not intended as recommendations of particular securities, financial instruments, strategies or banking services for a particular person or entity. The names and marks of other companies or their services or products may be the trademarks of their owners and are used only to identify such companies or their services or products and not to indicate endorsement, sponsorship, or ownership by Regions or Highland Associates. Employees of Highland Associates, Inc., may have positions in securities or their derivatives that may be mentioned in this report. Additionally, Highland’s clients and companies affiliated with Highland Associates may hold positions in the mentioned companies in their portfolios or strategies. This material does not constitute an offer or an invitation by or on behalf of Highland Associates to any person or entity to buy or sell any security or financial instrument or engage in any banking service. Nothing in these materials constitutes investment, legal, accounting or tax advice. Non-deposit products including investments, securities, mutual funds, insurance products, crypto assets and annuities: Are Not FDIC-Insured I Are Not a Deposit I May Go Down in Value I Are Not Bank Guaranteed I Are Not Insured by Any Federal Government Agency I Are Not a Condition of Any Banking Activity.
Neither Regions Bank nor Regions Asset Management (collectively, “Regions”) are registered municipal advisors nor provide advice to municipal entities or obligated persons with respect to municipal financial products or the issuance of municipal securities (including regarding the structure, timing, terms and similar matters concerning municipal financial products or municipal securities issuances) or engage in the solicitation of municipal entities or obligated persons for such services. With respect to this presentation and any other information, materials or communications provided by Regions, (a) Regions is not recommending an action to any municipal entity or obligated person, (b) Regions is not acting as an advisor to any municipal entity or obligated person and does not owe a fiduciary duty pursuant to Section 15B of the Securities Exchange Act of 1934 to any municipal entity or obligated person with respect to such presentation, information, materials or communications, (c) Regions is acting for its own interests, and (d) you should discuss this presentation and any such other information, materials or communications with any and all internal and external advisors and experts that you deem appropriate before acting on this presentation or any such other information, materials or communications.
Source: Bloomberg Index Services Limited. BLOOMBERG® is a trademark and service mark of Bloomberg Finance L.P. and its affiliates (collectively “Bloomberg”). BARCLAYS® is a trademark and service mark of Barclays Bank Plc (collectively with its affiliates, “Barclays”), used under license. Bloomberg or Bloomberg’s licensors, including Barclays, own all proprietary rights in the Bloomberg Barclays Indices. Neither Bloomberg nor Barclays approves or endorses this material or guarantees the accuracy or completeness of any information herein, or makes any warranty, express or implied, as to the results to be obtained therefrom and, to the maximum extent allowed by law, neither shall have any liability or responsibility for injury or damages arising in connection therewith.