
Download Asset Allocation | February 2024
How Do You Like Me Now?!
Economic Update
The Upside Surprises Keep Coming, but for How Long?
By Regions Economic Division
For those of us tasked with tracking, analyzing, and forecasting the economic data, a general rule is that you seldom actually know what you at first think you know. Inconsistencies between different data series purportedly tracking the same things, data collection – particularly for survey-based data – issues, faulty seasonal adjustments, and what can be large and seemingly out of the blue revisions to previously released estimates are some of the occupational hazards we’ve come to accept as part of the job. Since the onset of the pandemic, however, these issues have seemed much more pronounced than what we had become accustomed to dealing with over many years of toiling at this task. To be sure, all of this keeps us on our toes and helps ensure that things are never boring, but at the same time these issues make it more difficult to produce forecasts that come with a high degree of confidence, let alone a high degree of accuracy. That many, if not most, of the surprises in the economic data of late have been to the upside is certainly preferable to the alternative but doesn’t alter the broader point here. After all, marking a forecast up for sure feels better than marking a forecast down, but the higher degree of volatility in forecasts – ours and others – from month to month seen since the onset of the pandemic isn’t desirable either way.
OK, fine. Before this turns into an episode of Dr. Phil, we’ll note that the initial estimate from the U.S. Bureau of Economic Analysis (BEA) shows real GDP grew at an annual rate of 3.3% in Q4 2023, which, need we say it, was considerably stronger than had been expected. Consumer spending, government spending, and net exports were the main drivers of Q4 growth. For full-year 2023, real GDP grew by 2.5%, which was far better than had been expected at the start of the year, when many forecasters (though not us) had recession as their base case. Keep in mind that Q4 real GDP being higher than had been anticipated sets a higher base for real GDP in Q1 2024 and, in turn, for full-year 2024, such that we’ve upped our forecast for 2024 real GDP growth between our January and February forecasts.
The January employment report took the concept of upside surprises to a new level, to the point that it made us question every single assumption we’ve ever made about the labor market. Total nonfarm employment was reported to have increased by 353,000 jobs, with private sector payrolls up by 317,000 jobs, while average hourly earnings were reported to have risen by 0.6%. At the same time, the January employment data incorporated the annual benchmark revisions to the data on nonfarm employment, hours, and earnings, which showed job growth to be stronger and more broadly based over the latter part of 2023 than had previously been reported. All of this was, or at least seemed to be, in stark contrast to the signals sent by the labor market data over prior months, which had shown a slowing trend rate of job growth, declining job vacancies, decelerating wage growth, and the rate at which workers were voluntarily quitting jobs falling back in line with pre-pandemic norms.
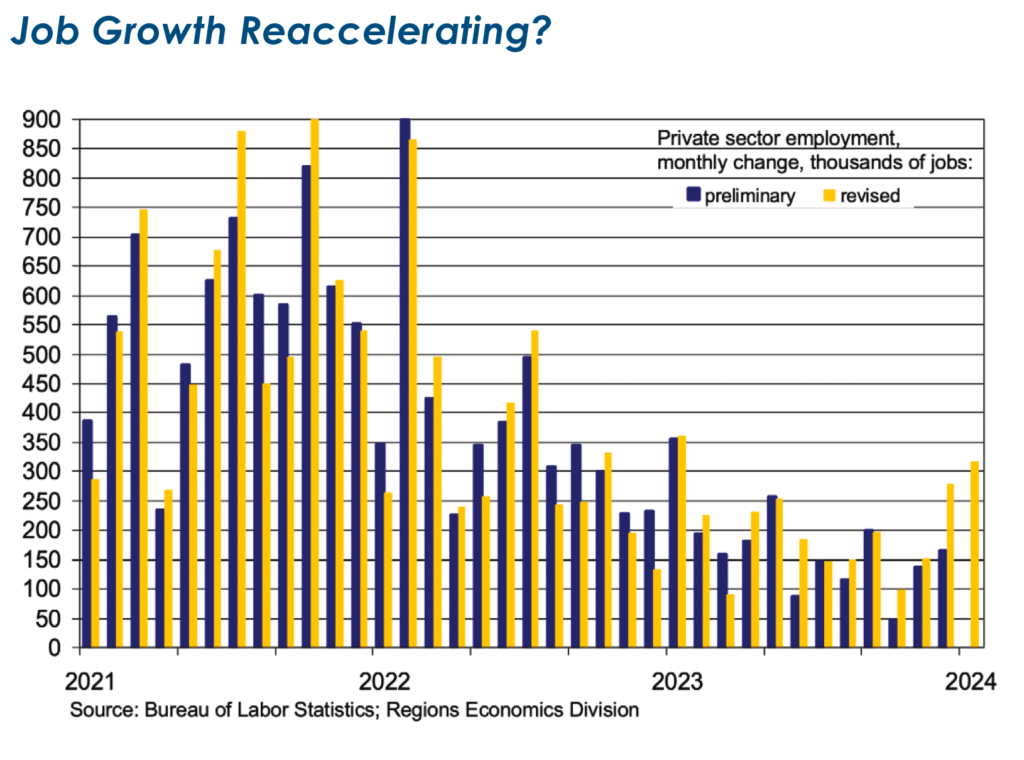
Beneath those surprisingly strong headline numbers, the January employment report is rife with noise. A low response rate to the January establishment survey calls into question how reliable the initial estimate of January job growth is, and there is ample evidence that reported January job growth was significantly bolstered by favorable seasonal adjustment. At the same time, however, weather effects related to unusually harsh winter weather across most of the nation held down job counts and hours worked in certain industry groups. To that point, the reported 0.6% jump in average hourly earnings is largely a product of the sharp decline in aggregate hours worked as opposed to genuinely faster wage growth. Sort through all the noise, however, and the January employment report was still stronger than we and most others expected.
The Institute for Supply Management’s (ISM) read on the manufacturing sector for January hardly constitutes a surprise, upside or otherwise. After all, with the headline index coming in at 49.1%, the ISM’s gauge shows a 15th straight month of contraction in the factory sector, with only 4 of the 18 industry groups represented in the survey reporting growth in January while 13 reported contractions. In keeping with our general theme here, however, there were indeed upside surprises in the details of the ISM’s survey. The index of new orders rose to 52.5%, indicating growth in new orders after 16 straight months of contraction, while the index of production rose to 50.4%, indicating manufacturing output rose in January. Many immediately seized on these details as pleasantly surprising signs that the long-running contraction in the factory sector has run its course. We, however, saw these readings as having more to do with quirks in how the ISM calculates its diffusion indexes rather than being signs of genuine growth. To our point, only five industry groups reported higher new orders, and only four reported higher output in January, while 10 industry groups reported declines in new orders and 11 reported lower output.
The ISM Non-Manufacturing Index rose to 53.4% in January, indicating continued expansion in the broad services sector, and offered a useful reminder that not all upside surprises are pleasant surprises. The prices paid index, a gauge of changes in the costs of non-labor inputs, jumped from 56.7% in December to 64.0% in January, the largest monthly increase since early-2021 – when inflation began its rapid acceleration. This is noteworthy given that prices for non-energy services remain the main hub of inflation pressures. One thing to keep in mind, however, is that January is the month in which new pricing structures tend to take effect, which may have biased the ISM’s gauges of price pressures higher for January – the ISM’s manufacturing survey showed a similarly large increase. Clearly, though, this will be something to watch in the months ahead.
The Federal Open Market Committee (FOMC) meeting that concluded on February 1 wasn’t so much a surprise as it was a cold smack in the face to those market participants who had been betting on/hoping for six Fed funds rate cuts this year commencing with the March FOMC meeting. Though dropping the implicit tightening bias that had long been a staple of their post-meeting policy statement, the committee signaled that Fed funds rate cuts are not coming soon, a message Chair Powell strongly reinforced in his post-meeting press conference. Though acknowledging the marked deceleration in inflation, the committee sees itself in a risk management role, with its priority being preventing inflation pressures from reigniting. The economy’s surprising resilience validates this view, allowing the FOMC to be patient in deliberating their next move, which we still expect to be the first of four 25-basis-point cuts by year-end 2024.
We closed last month’s edition by reiterating our call that by the end of 2024, the economy is unlikely to look as we, at the start of 2024, expected it to. We thought, however, it would take longer than the end of January for things to look so much different. At this point, we think it safe to say that in next month’s edition we’ll be explaining yet more surprises in the economic data and the financial markets. Whether those will be upside or downside surprises, however, is not a call we’re willing to make right now. Instead, we’ll let you know next month.
Investment Strategy Update
Stocks: January Was Just a Calendar Change So Far
Regions Multi-Asset Solutions & Highland Associates
The first month of 2024 shared heavy resemblance to 2023 as large-growth companies dominated index returns for the better part of the month with the S&P 500 Growth returning 2.9% compared to the S&P 500 at just 1.7%. The phrase “dance with who brought you” comes to mind regarding the largest names in the index, as gains in the top companies reinforce our stance that portfolios benefit from meaningful cap-weighted exposure, but valuations give us pause. We’re slow to draw past parallels to more frothy markets like the dot-com bubble due to the fact today’s leading firms have far superior earnings. Though the January earnings season illustrated that no companies are impenetrable, with four of the six Magnificent 7 stocks that reported falling post-earnings. The highest exposures in the S&P 500 are there for a reason. They are industry- leading companies with strong earnings growth, and we’re certainly not lining up to bet against them at this stage. However, history tells us the largest holdings won’t retain those titles forever. In fact, Microsoft is the only company in the top-10 market cap that was there in 2000. The adage “trees don’t grow to the sky” certainly applies when weighing valuations, but decades of market data advocate for participating in top names rather than heading for the sidelines and “waiting for trees to fall.”
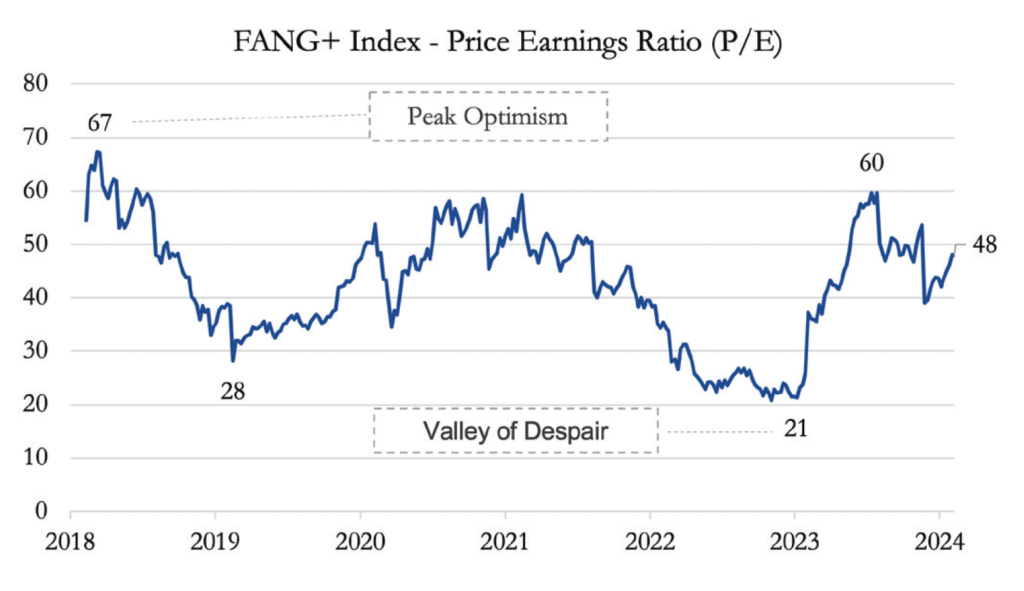
That assertion prompted us to revisit historical analogs for the Magnificent 7. Comparisons could be made dating back to the 1970s with the Nifty 50, but we’d flash back to a more recent group with similar characteristics in the FANG+ Index. All three cohorts saw tremendous gains backed by at least partially commensurate earnings growth. They also carried blistering valuations that seemed to temporarily defy gravity. Due to a lack of data and existence of an official Nifty 50 Index, a more recent group of highfliers will have to do. The FANG+ stocks that overlap with the Magnificent 7 saw a peak P/E ratio of 67 times earnings in 2018 before ultimately declining to just 21 times after prices returned to earth post-pandemic. Looking at last year and January in isolation, it’s difficult to ascertain why portfolios shouldn’t tilt further into the largest stocks; but backing up to 2022 when the Bloomberg Magnificent 7 Index was down 45.3% puts the benefit of diversification into perspective.
No Surprise Small Companies Left to Save Themselves
The S&P 600 Small Cap Index was down 4.0% in January, a stark contrast with its elated end-of-year bull run. Smaller companies were swimming against the current for the better part of the month as lower borrowing costs seemed increasingly distant with upside surprises in economic growth and labor market data keeping the FOMC, and short end of the curve, anchored higher for now. Pricing rate cuts for March was always too aggressive in our view for an FOMC that emphasized caution at every turn, provided unemployment didn’t ratchet significantly higher. That backdrop leaves small- and mid-cap companies to fend for themselves via revenue or earnings growth until the macro backdrop warms up, a tall order in the near-term given the street’s expectations for revenue to climb modestly while earnings bottom. Like prices, a bottom in earnings is only clear in hindsight; from the potential bottom it just appears earnings are headed lower. But improved revenue growth so far this quarter unveils movement in the right direction. Multiples in the sub-asset class are even more appealing than when the month began, but we’re waiting on firmer signals that fundamental expansion is afoot. The soft-landing thesis and subsequent benefit for small caps remains intact for now, but expectations around easing were due for adjustment, which would likely set the segment back until more dovish narratives thaw in the spring or technicals renew investor interest.
Dollar Headwinds Intensify for International Equities While China Stocks Sputter on Stimulus
Developed stocks ended the month in positive territory with the MSCI EAFE posting a 0.6% gain, while emerging equities struggled in January, falling by 4.6%. The reset in FOMC expectations played a role in catapulting the dollar higher against most major currencies to start the year, a tough environment for international stocks. China was a loss leader in the Emerging Markets Index, notching a double-digit decline despite stimulating the banking system by lowering reserves with speculation that the government would consider purchasing public equities. The country is plagued by an ongoing crisis of confidence, with domestic sentiment surveys reaching decade lows after harsh zero-COVID policies and property sector woes have eroded consumer spending. We expect China’s government spending policy is set to persist as the determination, or desperation, to restart growth becomes more apparent. Throwing money at the country’s issues should provide short-term sparks, but restoring long-term confidence likely requires structural changes. The downdraft for stocks in emerging markets didn’t stop in Asia, as the Latin America 40 ETF ended the month down akin to the broader index at 4.2%. Currency hurt the subset, but these economies appear to be fulfilling their end of the bargain with inflation that continues to moderate in some of the most heavily tracked countries like Mexico and Brazil. Equity prices haven’t reflected success so far, but progress on inflation lends itself easier financial conditions that would lower the cost of capital for corporations. One of the strongest stories abroad was yet another continuation trend, as the Japanese Nikkei 225 registered an 8.4% gain over the period, though a significant portion of those gains can be attributed to a stronger yen, one of the few currencies that fared well against the dollar. The dollar-hedged Nikkei gained a more modest 4.4%, a subtle reminder that diversified currency exposures can be a valuable part of a holistic portfolio.
Bonds: FOMC Closes the Door on March Cut, Making Markets Rethink May
January brought on more lackluster fixed income markets, evidenced by the Bloomberg Aggregate Bond Index loss of 0.3% after a year-end hot streak. Yields lacked clear direction during the month, oscillating to various economic data before the FOMC meeting and another blowout payrolls number sent rates higher to early December levels. Those events paired with the increased services prices in January are casting fresh doubt that inflation is firmly on the path to the FOMC’s 2.0% target, a proper reset from the unrealistic narrative bought by markets in recent months. Fed futures betting on an early spring cut embody these expectations, starting the month pricing a 96.5% chance of a cut in March with a 100% chance of a second cut in May. Those numbers aged poorly as the FOMC talked down the chance of a cut. Early February futures now indicate a 21.2% chance of a March cut and just 60% chance of a cut in May. Officials went so far as to mention they wouldn’t follow certain Taylor Rule models that suggest cuts, instead waiting on longer data streams to bolster their confidence.
Last month brought a narrowing of alignment between market participants and monetary policy officials putting upward pressure on long-end yields. Higher yields should be bought at this point in the cycle given the broader trends of moderating inflation and easing financial conditions. We are hesitant to trade around duration exposure, as yield could prove scarce if inflation declines as predicted. Conversely, select active managers may be able to add value during the volatile period for rates by making incremental shifts on the curve and buying surges/soft spots in yields along the way.
Corporate Issuers on a Borrowing Spree That Could Pressure Spreads; High Yield Holds Steady
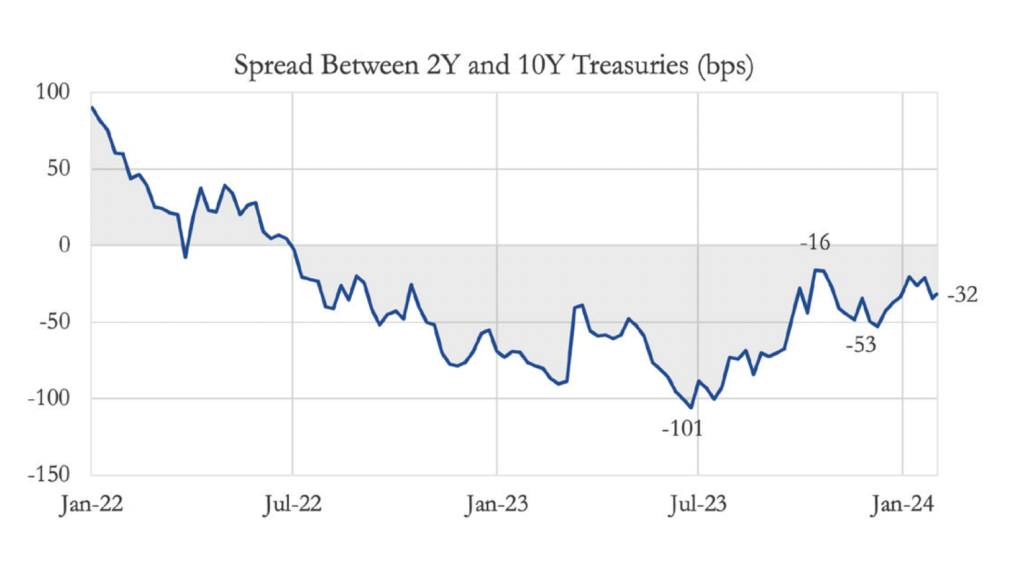
Investment-grade corporate bonds turned out a 0.2% loss for the month, while the below-investment-grade subset of the market was flat. Credit spreads managed to tighten marginally across the quality spectrum over the course of January, despite moving wider at month-end. That spread widening coincided with a further inverted yield curve, implying that inflation surprises and linked higher-for-longer policy rates remain the most prominent risks to bondholders as a positive relationship between spreads and rates persists. The spread between 2-year and 10-year treasury notes can serve as a gauge on broader risk appetite worth watching in this environment. Wider option-adjusted spreads appear more bark than bite, as any upticks in spread are being bought in short order based on primary market demand. Survey data indicates investors are still underweight the long end of the curve, and with minimal issuance that far out, investment-grade paper longer than 10 years to maturity is likely to trade tight.
Within high yield, market activity has been healthy. Borrowers face minimal hurdles when refinancing and extending maturities, including a handful of CCC-rated borrowers, an indication that sentiment remains intact for now. A hefty allocation to quality corporates can enhance yields without undue risk, as strong demand and adequate balance sheets make the subset viable within a core fixed-income portfolio.
Against this backdrop, we continue to hold a Neutral risk position in portfolios and remain focused on adding yield and identifying relative value opportunities across fixed income, equity, and alternative markets. Monetary policy, employment, credit spread, and momentum indicators are signaling a more favorable environment for risk assets in the months ahead. However, context is always key as typically monetary policy easing, coupled with narrowing spreads, and positive momentum would historically signal the economy is firming, normally after an economic slowdown but that’s not exactly the case this time. This should be viewed in a positive light and improve outlook for risk assets but shouldn’t be taken as an all clear.
Highland Associates Cross Asset Views
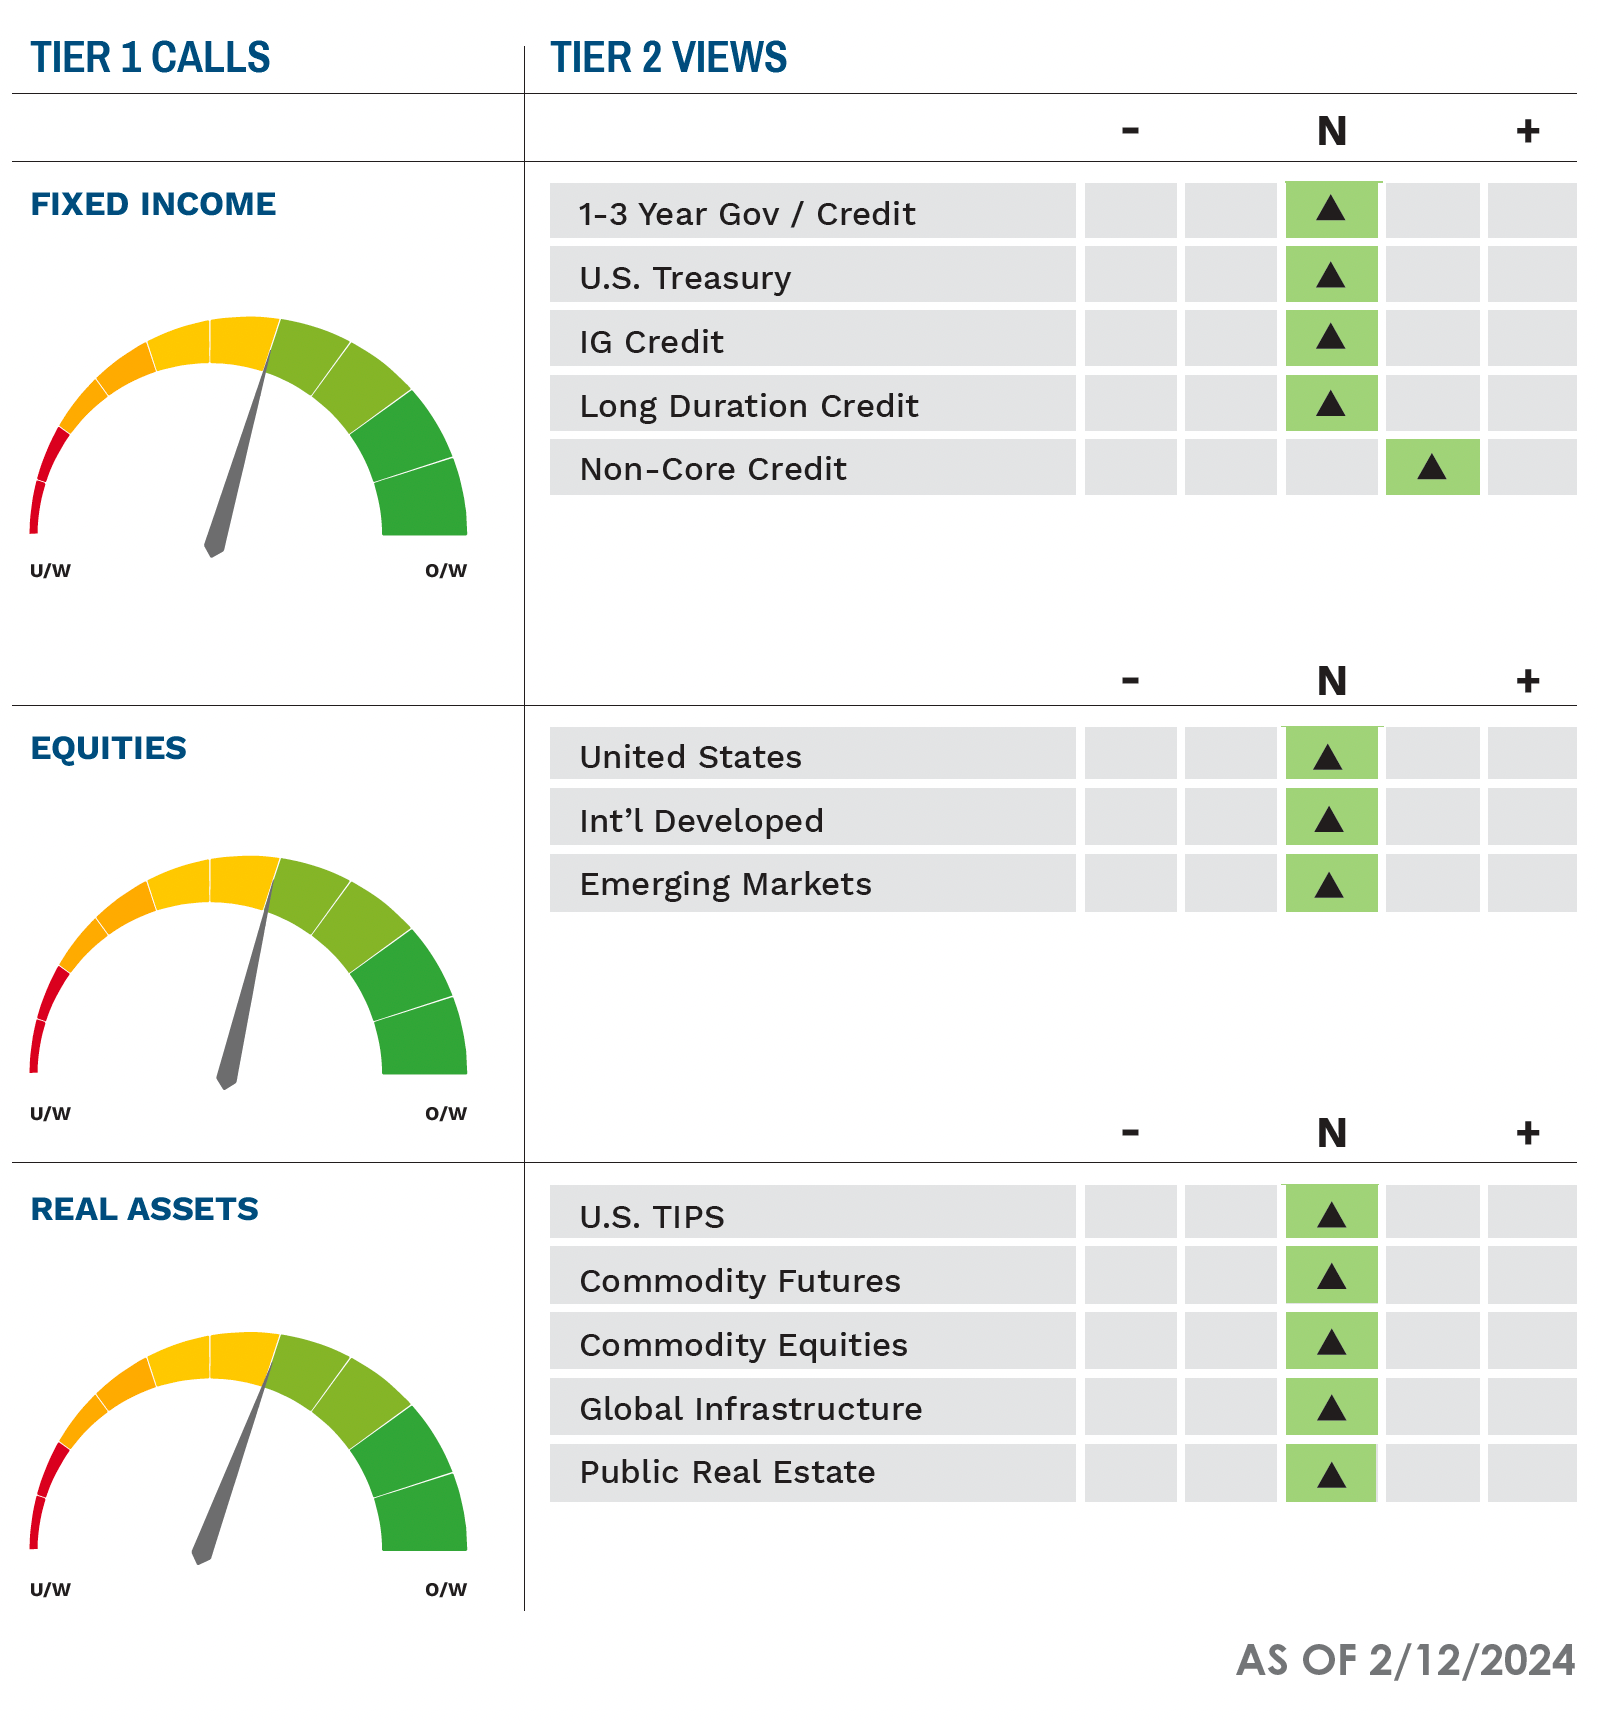
As of 02/12/2024
IMPORTANT DISCLOSURES: This publication has been prepared by the staff of Highland Associates, Inc. for distribution to, among others, Highland Associates, Inc. clients. Highland Associates is registered with the United States Security and Exchange Commission under the Investment Advisors Act of 1940. Highland Associates is a wholly owned subsidiary of Regions Bank, which in turn is a wholly owned subsidiary of Regions Financial Corporation. Research services are provided through Multi-Asset Solutions, a department of the Regions Asset Management business group within Regions Bank. The information and material contained herein is provided solely for general information purposes only. To the extent these materials reference Regions Bank data, such materials are not intended to be reflective or indicative of, and should not be relied upon as, the results of operations, financial conditions or performance of Regions Bank. Unless otherwise specifically stated, any views, opinions, analyses, estimates and strategies, as the case may be (“views”), expressed in this content are those of the respective authors and speakers named in those pieces and may differ from those of Regions Bank and/or other Regions Bank employees and affiliates. Views and estimates constitute our judgment as of the date of these materials, are often based on current market conditions, and are subject to change without notice. Any examples used are generic, hypothetical and for illustration purposes only. Any prices/quotes/statistics included have been obtained from sources believed to be reliable, but Highland Associates, Inc. does not warrant their completeness or accuracy. This information in no way constitutes research and should not be treated as such. The views expressed herein should not be construed as individual investment advice for any particular person or entity and are not intended as recommendations of particular securities, financial instruments, strategies or banking services for a particular person or entity. The names and marks of other companies or their services or products may be the trademarks of their owners and are used only to identify such companies or their services or products and not to indicate endorsement, sponsorship, or ownership by Regions or Highland Associates. Employees of Highland Associates, Inc., may have positions in securities or their derivatives that may be mentioned in this report. Additionally, Highland’s clients and companies affiliated with Highland Associates may hold positions in the mentioned companies in their portfolios or strategies. This material does not constitute an offer or an invitation by or on behalf of Highland Associates to any person or entity to buy or sell any security or financial instrument or engage in any banking service. Nothing in these materials constitutes investment, legal, accounting or tax advice. Non-deposit products including investments, securities, mutual funds, insurance products, crypto assets and annuities: Are Not FDIC-Insured I Are Not a Deposit I May Go Down in Value I Are Not Bank Guaranteed I Are Not Insured by Any Federal Government Agency I Are Not a Condition of Any Banking Activity.
Neither Regions Bank nor Regions Asset Management (collectively, “Regions”) are registered municipal advisors nor provide advice to municipal entities or obligated persons with respect to municipal financial products or the issuance of municipal securities (including regarding the structure, timing, terms and similar matters concerning municipal financial products or municipal securities issuances) or engage in the solicitation of municipal entities or obligated persons for such services. With respect to this presentation and any other information, materials or communications provided by Regions, (a) Regions is not recommending an action to any municipal entity or obligated person, (b) Regions is not acting as an advisor to any municipal entity or obligated person and does not owe a fiduciary duty pursuant to Section 15B of the Securities Exchange Act of 1934 to any municipal entity or obligated person with respect to such presentation, information, materials or communications, (c) Regions is acting for its own interests, and (d) you should discuss this presentation and any such other information, materials or communications with any and all internal and external advisors and experts that you deem appropriate before acting on this presentation or any such other information, materials or communications.
Source: Bloomberg Index Services Limited. BLOOMBERG® is a trademark and service mark of Bloomberg Finance L.P. and its affiliates (collectively “Bloomberg”). BARCLAYS® is a trademark and service mark of Barclays Bank Plc (collectively with its affiliates, “Barclays”), used under license. Bloomberg or Bloomberg’s licensors, including Barclays, own all proprietary rights in the Bloomberg Barclays Indices. Neither Bloomberg nor Barclays approves or endorses this material or guarantees the accuracy or completeness of any information herein, or makes any warranty, express or implied, as to the results to be obtained therefrom and, to the maximum extent allowed by law, neither shall have any liability or responsibility for injury or damages arising in connection therewith.