
Download Asset Allocation | February 2022
One Step Up
Economic Update
The “Yes, But” Economy
Regions Economic Division
It’s hard to know where you’re going if you’re not sure where you are. That is something we learned from experience in the dark days before the advent of GPS technology. Then again, not even GPS can tell you where to go if it doesn’t know where you’re starting from. That seems an appropriate analogy in the wake of the initial estimate of Q4 2022 GDP from the U.S. Bureau of Economic Analysis (BEA), which showed another quarter of solid real GDP growth despite mounting evidence that the pace of economic activity slowed over the latter stages of 2022. Indeed, mixed signals abound in the economic data, seemingly leaving us in a “yes, but” economy. Yes, inflation is slowing, but it remains much too high to suit the FOMC. Yes, job growth is slowing, but the labor market is showing few signs of cracking. Yes, the labor market is showing few signs of cracking, but employment is always a lagging indicator.
The beauty of a “yes, but” economy is that there is something for everyone; no matter what one’s outlook for the economy, there’s something in nearly every single data release to focus on, whether it’s the “yes” or the “but.” OK, sure, that’s a huge plus for fans of endless argument, but for those of us trying to drown out the noise and get a clear read on where the economy is heading, not so much. To that point, the BEA reports that real GDP grew at an annual rate of 2.9% in Q4 2022. While that matched our above-consensus forecast, the details of the data left us with a sinking feeling as the profile of Q4 GDP growth was much different than we anticipated. So, yes, our call on Q4 growth was right, but it was right for the wrong reasons.
More importantly, the details of the Q4 data set a weak base for current quarter growth. For instance, an unexpectedly large inventory builds in the nonfarm business sector and a smaller trade deficit teamed up to add over two percentage points to top-line real GDP growth in Q4, but neither will be repeated in Q1, meaning the two biggest drivers of Q4 growth will turn into drags on Q1 growth. We don’t look for much help from private domestic demand (combined consumer spending, business fixed investment, and residential fixed investment), which grew at an annual rate of just 0.2% in Q4. Real consumer spending on discretionary services declined in each of the final three months of 2022, and we expect further weakening over 1H 2023, and despite a jump in motor vehicle sales in January, we expect real consumer spending on goods to drift closer back toward its pre-pandemic trendline. Business investment in equipment and machinery contracted in Q4 2022, and we look for further declines in coming quarters as an increasingly uncertain outlook for both revenue growth and profits has led many firms to scale down planned capital spending. Weaker growth in consumer spending and business fixed investment will offset some of the benefit from what should be a smaller drag from residential fixed investment, thus weighing on growth in real private domestic demand, and in turn real GDP, over 1H 2023.
While the labor market may seem unambiguously strong, there are some questions beneath some notably robust headline numbers. For instance, nonfarm employment increased by 517,000 jobs in January, blowing away even the most ambitious forecast. But (and you just knew one of those was coming), that number was flattered by seasonal adjustment, as the decline in nonfarm payrolls on a not seasonally adjusted basis was much smaller than is typical for the month of January. Still, at the same time, revised data show job growth was even stronger over the back half of 2022 than had previously been reported, and the number of open jobs across the U.S. economy remains far above the number of potential workers. This makes it somewhat puzzling that the pace of wage growth has slowed over the past several months, to the point that the 4.4% year-on-year increase in average hourly earnings in January was the smallest such increase in 18 months.
The January surveys from the Institute for Supply Management (ISM) show the services sector bouncing back from what looks like a weather-related lull in December but a third straight month of contraction in the manufacturing sector. The ISM Manufacturing Index slipped to 47.4% in January, but of more concern is that new orders contracted for the seventh time in the past eight months while once-sizable backlogs of unfilled orders have been substantially whittled down, a combination that bodes poorly for employment and output in the factory sector in the months ahead. ISM did note, however, that many firms in the factory sector are engaging in labor hoarding, i.e., hanging on to workers despite slumping demand on the expectation of a return to growth over the second half of 2023. We do not think that practice to be unique to firms in the factory sector.
After suffering one of the largest declines on record in December, the ISM Non-Manufacturing Index posted one of its largest increases on record in January, with a spike in new orders and an increase in unfilled orders. We will, however, note that only 10 of the 18 broad industry groups in the ISM’s survey of the services sector reported growth in January, which, outside of the pandemic-related disruptions in 2020, is the fewest in any month since January 2016. Recall that the number of industry groups in the factory sector reporting growth began to gradually decline in the months before the ISM Manufacturing Index slipped into contraction. This isn’t a guarantee the services sector will follow a similar path but is nonetheless worth noting.
The ISM surveys show ongoing declines in prices for non-labor inputs in the manufacturing sector and a slowing pace of increases in the services sector. This is consistent with the broader inflation data showing ongoing declines in prices for core (non-food, non-energy) consumer goods and some modest slowing in core services prices. Inflation is clearly moderating but nonetheless remains far above the FOMC’s 2.0% target rate, and the FOMC continues to point to core services excluding housing as the most persistent pocket of inflation, with prices in this segment closely aligned with labor costs. This helps account for why the FOMC remains so keenly focused on growth in labor costs and for why the FOMC considers it far too soon to declare victory over inflation.
Fed Chair Powell said as much in his February 1 press conference following the FOMC’s decision to raise the Fed funds rate by 25 basis points. Though not as forcefully as he has done in the past, Chair Powell pushed back against unwarranted easing in broader financial conditions and market expectations of funds rate cuts by year-end 2023. Clearly, the FOMC and the markets see different paths ahead for inflation and the broader economy, but the economic data of late have done nothing to settle the question of which view will be closer to the mark. While we continue to expect another 25 basis point funds rate hike at the March FOMC meeting, beyond that, it’s anyone’s guess. All we can say with certainty right now is that a lot can, and probably will, happen by the time the May FOMC meeting rolls around.
Sources: U.S. Bureau of Economic Analysis; U.S. Bureau of Labor Statistics; Institute for Supply Management
Investment Strategy Update
By Highland Associates and Regions Multi-Asset Solutions
Quality seemed to be the last thing market participants wanted to own in January as they jettisoned last year’s outperformers to buy the highest beta and most heavily shorted stocks. An equal-weight basket of the 100 most heavily shorted names within the Russell 3000 rose 14.5%, while the S&P 500 High Beta ETF (SPHB) rose 13.5%, both easily outpacing the S&P 500’s 6.2% return and the S&P 500 Quality (SPHQ) ETFs 4.8% gain. January also saw stocks of companies with above-average foreign sales outperform, driven by encouraging economic data out of Europe and China, which contributed to weakness in the U.S. dollar. The MSCI Emerging Markets (EM) index rallied 9.1% during the month, and while the 12.8% gain out of the MSCI China index was a major contributor, strength was relatively broad-based, with Brazil, Mexico, South Korea, and Taiwan each putting up 8.5% or greater returns.
Is this the start of a new bull market? For now, our view remains unchanged; we continue to recommend more of a defensive posture. When the Highland Diffusion Index signaled risk-off at the end of August, the S&P 500 Index was priced at 3,955. The Index ended January at 4,077, a gain of only 3%. For the market to break out meaningfully from this range, we believe that data need to improve. While we have seen recovery in some market-based momentum and credit indicators, an inverted yield curve, select economic data, and an aggressive Fed remain a concern. In the meantime, we continue to favor shorter duration bonds and select alternative investments that are benefiting from a more favorable yield environment and are untethered to traditional stocks and bonds.
We remain relatively constructive on the prospects for international and emerging markets over the balance of this year as we expect the U.S. dollar to weaken further, but over the near-term, the greenbacks’ sell-off could be overdone and based off false hope of a dovish Fed pivot. With the investment community at large championing emerging markets to start the year, the sentiment pendulum may have swung too far, too fast, and some consolidation is likely now required. Despite a shift in momentum favoring emerging and international markets, we remain neutral relative to the MSCI ACWI Index and await a revaluation of both the U.S. dollar and international equities over the coming month(s), which would likely present better opportunities for long-term investors.
Alternatives Market Update
In January, hedge funds (as measured by the HFRI Fund Weighted Composite) had their best month in almost two years, but most meaningfully underperformed equities and below investment-grade credit. In early December, Goldman Sachs published a report detailing how 786 equity funds with $2.3 trillion in gross exposures had reached the lowest beta levels (averaging 0.11) since 2009. While this was intended to reflect a sharp downturn in sentiment, the insatiable investor demand for market-neutral, multi-strategy managers has also undoubtedly been a large driver. However, in the seven weeks since this report was published, net exposure has increased by 9%, a rate of change not seen since the second quarter of 2020. While there has been some notable rotation back into technology and other underperforming sectors, the net buying of Chinese equities (from net short to long) has driven the largest part of this change.
After a year of outperformance, non-directional hedge funds had a much more muted January, as macro and relative value strategies experienced modest gains. Credit strategies did meaningfully better as spreads aggressively tightened at the fastest pace since April of 2020. With higher rates, the forward return profile for many of these strategies has improved meaningfully. Credit return expectations have increased almost commensurately with rates, and relative value and macro strategies tend to benefit from short rebates and returns on substantial unencumbered cash. Ultimately, Highland believes that strategies like credit, relative value, and macro will experience more than half the benefit from the recent increase in rates, while remaining uncorrelated to traditional stocks and bonds.
Although private equity valuations remain elevated to their public counterparts, data suggest that the slowdown in fundamentals is deepening. PJT Parkhill noted that the supply/demand imbalance between funds in market (seeking to raise $2.9 trillion) and 2022 commitments ($1.3 trillion) was the biggest disparity ever. It has also led to longer average fundraising periods, with the average “on the road” fundraise reaching 20.7 months. While deal volume fell across buyout, growth, and venture stage investments, dry powder reached an all-time high of $3.3 trillion. Multiples for buyout transactions peaked in early 2022, and the year finished with an all-time peak in average EBITDA multiples (11.9x) for buyout transactions of all sizes.
While private equity vintages in recession years typically outperform on an absolute basis, these vintages typically experience below average PME (public market equivalent) returns. Pitchbook notes that IPOs and SPACs listed since 2020 are now trading 73% and 80% below initial offering prices, and they believe this will be a fertile ground for new deal activity. Spreads on new private loan originations averaged Sofr+4.8% in 2022, and despite spread tightening in public markets early in 2023, many new issues are now closing at double-digit yields. If yields remain higher for longer, what is a headwind for highly levered private equity strategies may be a tailwind for private debt.
In the near term, deal activity has slowed the least in the lower middle market, and the opportunity set remains robust. Despite the cost of debt increasing meaningfully for all buyout strategies, it is still accretive to the ROE for the lower middle market. With dry powder at all-time highs, and much of this concentrated in the upper middle market, large, and mega funds, there will be aggressive buyers waiting with open arms for lower middle market funds exiting larger buyers when the time comes.
Longer term, the very challenging fundraising environment is starting to make funds that have been inaccessible for several vintages accessible to some new investors. We are less constructive on venture in the short term, especially if there are more similarities than differences to the tech bubble of the early 2000s. However, it could prove to be a great opportunity to get access to higher-profile venture funds that have been hard to access for quite some time.
Lastly, we anticipate negative returns from open-end private real estate funds in 2023, as measured by the NCREIF ODCE Index, as valuations catch up with market comps. The Green Street Commercial Property Price Index, which captures the prices at which commercial real estate transactions are currently being negotiated and contracted, is down 14% from its March 2022 peak and serves as a decent proxy for the open-end fund space in this current environment. Investors are also experiencing limited liquidity as redemption queues for most open-end funds rise. These provisions are beneficial for long-term investors as they reduce forced selling of assets to meet elevated redemption requests.
Sources: Bloomberg; Goldman Sachs; NCREIF; Green Street
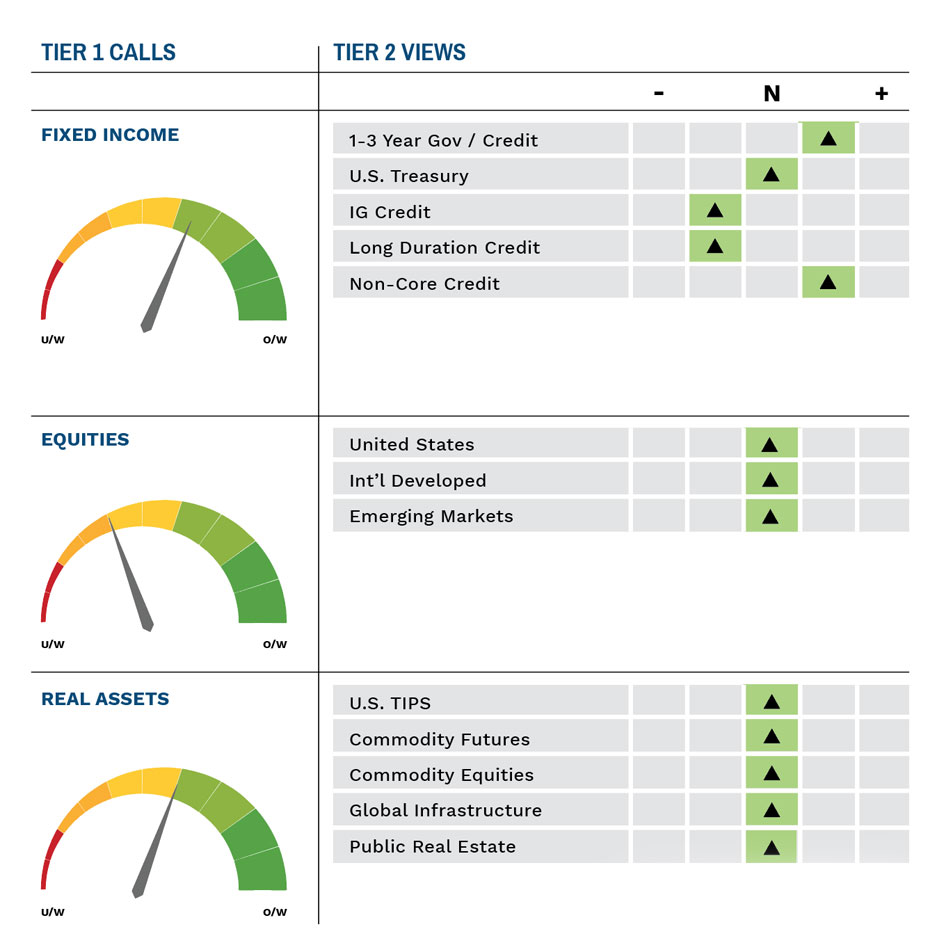
Highland Associates Cross Asset Views
As of February 17, 2023