
Download Asset Allocation | December 2025
Seven Nation Army
Year end is a time for reflection. It is a moment to ask- What has worked, and what will the future hold? For equity markets, the story of the Magnificent Seven has dominated not just the past year, but the last seven. Every single one has a story to tell— shaping trends from e-commerce and remote work to AI and data infrastructure. Together, they have powered one of the strongest bull runs in history. Since 2019, the S&P 500 has delivered an annualized return of over 17%, a pace unseen since the 1990s. Market cap has surged from $21 trillion to $58 trillion, with these seven names contributing $17 trillion—over 46% of the growth. Strip them out, and this seven-year era shifts from exceptional to below average. If the future echoes the recent past, the performance of these seven may continue to exert outsized influence relative to the broader index. For active managers, bears, and contrarian investors, it is not what they want to hear, but it is what may happen if enthusiasm around AI continues in 2026. However, a polyphony of critics has gotten louder in recent months citing valuations, circular transactions, the debt financed data center boom, and other late cycle behavior in markets. Will we see the reign of the Seven come to an end in 2026? Or does this bull market have room to run?
Source: Bloomberg
Economic Update
A Narrower Range of Outcomes
Regions Economic Division
Despite the shutdown of the federal government having ended and the various data producing agencies being back at work, the economic data calendar remains somewhat of a jumbled mess. While the economic data is flowing again, at least for now, most of the data releases now seeing the light of day are only helping fill in the remaining blanks in the Q3 growth puzzle rather than providing clues to how the economy is faring in Q4. As of this writing, the release schedules for the Q4 data points are still works in progress, with many key releases scheduled.
We continue to expect that when the Bureau of Economic Analysis (BEA) ultimately releases the data real GDP will be shown to have grown at an annual rate of between 3.5 and 4.0% in Q3. We do, however, now look for Q3 growth to come in closer to the low end of that range, whereas previously we expected growth to be at the higher end. The main reason for that change is that the BEA’s release of the September data on consumer spending shows Q3 growth in real consumer spending was a bit lighter than our forecast anticipated. We continue to expect that, with the shutdown taking around 1.5 percentage points off top-line growth, real GDP will be roughly flat in Q4 with most of the drag from the shutdown being reversed in the Q1 2026 data.
Thus far, we have little to go on in the way of data that would tell us whether Q4 real GDP growth is evolving as our forecast anticipates. For instance, while the BLS was able to compile the October data from the establishment survey, the source of the BLS’ estimates of nonfarm employment, hours, and earnings, the data was blended in with the November employment report released on December 16. The unemployment rate rose to 4.6%, the highest level since 2021.
The gaps in the data make it hard to resolve what is considerable debate about the state of the U.S. economy and the primary risk(s) today, a debate taking place amongst private sector analysts, market participants, and, perhaps more notably, within the FOMC. That said, we are not completely lacking timely reads on Q4 economic activity. The monthly surveys from the Institute for Supply Management (ISM) on the manufacturing and services sectors and their S&P Global counterparts, the weekly data on mortgage loan applications and claims for unemployment insurance, monthly reads on existing home sales and motor vehicle sales, and various trackers of consumer spending were all undisturbed by the shutdown. To our point, however, these and other available series are doing more to keep the debate about the state of the economy going rather than to settle it, which reflects the degree to which the data continues to send mixed messages.
The ISM Manufacturing Index remained below the 50% break between contraction and expansion in November, as has been the case in thirty-five of the past thirty-seven months. At the same time, however, the ISM Non-Manufacturing Index remains above that 50% break and in November rose to its highest point since January. The ISM’s surveys, however, show continued broadly based upward pressure on input prices, reinforcing the argument of those who stress upside risks to inflation. Private sector surveys suggest the pace at which firms are hiring workers remains, at best, anemic while at the same time the weekly jobless claims data continue to show workers being laid off at a rate slightly below pre-pandemic norms. In other words, the “low hire- low fire” labor market narrative continues to hold. The weekly data on applications for purchase mortgage loans suggest lackluster home sales but at the same time show prospective buyers remain responsive to dips in mortgage interest rates. Finally, despite what remain notably low reads on consumer confidence, spending on “Black Friday” and “Cyber Monday” was up sharply compared to last year, with the obvious caveat that higher prices are one factor behind this growth.
One thing that has been largely overlooked amid these mixed messages is how stable the underlying pace of economic activity has been for quite some time now. To be sure, that seems totally out of line with real GDP growth over the first three quarters of 2025, which has been anything but stable. To some extent, the GDP prints thus far this year (assuming real GDP growth at an annual rate between 3.5% and 4.0% for Q3) reflect firms and households reacting in anticipation of/in response to a markedly different tariff regime than that which had prevailed for decades. As we frequently point out, trade and inventories tend to be highly volatile from one quarter to the next even in the calmest of times and, as such, can and often do have outsized impacts on real GDP growth in any given quarter. This has been the case so far in 2025 despite what, by many measures, has been relative stability in the underlying pace of economic activity.
One such measure comes straight from the GDP data; growth in real private domestic demand, or, combined business and household spending, which we frequently point to as a reliable gauge of the underlying health of the economy, has been far more stable this year than real GDP growth has been. Where we really see stability, however, is looking at the longer-term patterns in data series such as the ISM surveys of the manufacturing and services sectors, industrial production, core capital goods orders, and sales of new and existing homes. These series have moved in notably narrow ranges since at least the beginning of 2024, and in almost every case the range has never been this narrow for this long.
Moreover, these ranges are mostly in line with those that prevailed prior to the pandemic. One interpretation is that the underlying pace of economic activity has largely settled back at or close to the pace that prevailed prior to the pandemic, with one key difference being sweeping changes in trade and immigration policies, the development of AI, and stubbornly persistent inflation pressures, which inject considerable uncertainty around the outlook. This makes it hard for anyone to have a great deal of confidence in their views on where the economy is and where it might be going, regardless of what those views are.
In stark contrast to the stability seen across a wide swath of the economic data, deepening divisions within the FOMC are being reflected in a notably wide range of views on the value of the “neutral” Fed funds rate, i.e., the value of the funds rate consistent with monetary policy neither stimulating nor restricting economic activity. While not something that can actually be observed, FOMC members’ perceptions of the neutral funds rate are nonetheless closely watched by market participants as a marker against which to assess the stance of monetary policy. For instance, after a twenty- five-basis point cut in the Fed funds rate target range at the December FOMC meeting left the target range mid-point at 3.625%, that still leaves the mid-point above the median estimate of the neutral funds rate which held at 3% in the updated dot plot. While that would imply more restrictively is still restrictive, Chair Powell did note in his post-meeting press conference that the funds rate is “within a broad range of estimates” of neutral.
“Broad range” may be a bit of an understatement given that the range of estimates of neutral is much broader over the past several meetings than has historically been the case despite the median estimate having not changed over that span. In the December dot plot, there were eleven unique estimates of the neutral funds rate, nine of which were above the median estimate. The wide range of estimates of the neutral funds rate suggests more fundamental divisions over the economy’s capacity to grow and the longer-term path of inflation. This, in turn, makes it harder for market participants to assess where the stopping point may be in the current rate-cutting cycle which is, keep in mind, aimed at making policy less restrictive as opposed to more accommodative. Either way, assessments of how restrictive policy still is are all over the map, but that would at some point change if the pace of underlying economic activity is as stable as implied by many of the economic data series.
Sources: BurSources: Bureau of Economic Analysis; Bureau of Labor Statistics; U.S. Census Bureau; Federal Reserve Board; Automatic Data Processing; Institute for Supply Management; The Conference Board; Adobe; Bloombergeau of Economic Analysis; Bureau of Labor Statistics; Institute for Supply Management, AutoData; ADP National Employment Report
Investment Strategy Update
Regions Multi-Asset Solutions & Highland Associates
Volatility returned in November as market participants appeared to de-risk and de-lever portfolios, contributing to a 5% peak-to-trough decline for the S&P 500 mid-month. Encouragingly, this portfolio repositioning and the sector rotation that accompanied it appeared to be orderly and was short-lived, allowing the S&P 500 to stage a rally into month-end to close higher by 0.2% on a total return basis to continue what is now a seven-month winning streak. Interestingly, while the broader S&P 500 closed the month virtually unchanged, under-the-surface price action was more encouraging as just two sectors – industrials (-1%) and information technology (-4.3%) – closed lower, while consumer staples, financials, healthcare, and materials each ended November with a monthly gain of 1.7% or more. The S&P 500 is going nowhere even as just two sectors fell during the month highlights how reliant the index is on the information technology (IT) sector to deliver gains, so IT needs to find its footing, and fast.
Q3 quarterly reporting season is by now wrapped up with a neat little bow. On balance, releases out of S&P 500 companies were deserving of upbeat investor sentiment and some enthusiasm into year-end as just shy of 67% of constituents bested the consensus estimate for sales and over 82% topped the consensus estimate for earnings per share (EPS). Companies have consistently done a good job managing costs but, more surprisingly, firms have been able to raise prices to maintain their near-record profit margins. The magnitude of the upside surprise to sales and EPS in the 3rd quarter forced estimates for S&P 500 earnings in both ‘26 and ‘27 higher, with the former at $308.20 and the latter at $349.51, implying 13% year-over-year earnings growth in both years. Simplistically, so long as forward earnings estimates continue to move higher, or just hold-up, there will be little reason to reduce exposure to U.S. stocks.
Cumulative Earnings Growth Shows Why U.S. Stocks Are More Expensive, And Why Small and Mid Sized Companies Could Play Catch Up
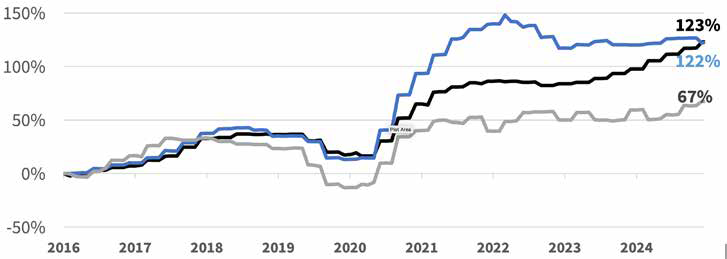
Source: Bloomberg
Despite the uptick in volatility and unsettling drawdown U.S. indices experienced in November, there was a marked improvement in market breadth as we approached month-end, which warrants attention. In early December, over two-thirds of the constituents held in the S&P 500, S&P Midcap 400, and S&P Small Cap 600 indices were trading above their 20-day moving average, evidence that investors were eager to buy dips and a broad swath of industries and sectors benefitted, not just the U.S. large and mega cap names tied to AI. The rally that took root at month-end was due in large part to optimism that the FOMC would deliver another cut to the Fed funds rate this month, which spurred a rotation into economically sensitive sectors and small cap stocks, specifically. But with corporate buybacks set to ramp up and tax-loss selling ending, a seasonal lift into January is still possible.
What could derail a year-end rally? A backup in Treasury yields is at the top of our list of things to watch. The Bloomberg Commodity index has broken out to a level last seen in January of 2023, despite both gold and crude oil moving sideways. Reflation in the commodity complex due to an expected reacceleration of global economic growth would likely mean that the floor for yields does not lie too far below current levels. Upward pressure on Japanese Government Bond yields forced yields on U.S. Treasuries, German bunds, and U.K. gilts, among others, higher earlier this month, and a rate hike out of the Bank of Japan may be required this month to stem weakness in the Japanese yen. Subject to change, sovereign bond yields to move higher in the new year, and stock prices can digest higher rates if they rise gradually and for the right reason, i.e., better economic growth. But should global rates push higher into year-end due to fiscal spending fears, equity valuations and stock prices could come under pressure.
Expansionary fiscal policy is set to meet restrictive monetary policy in Japan. The MSCI EAFE developed markets index produced a 0.4% return in November, doubling up the S&P 500’s 0.2% gain, but under the surface one shift worth watching was the 5.4% drop in Japan’s Nikkei 225 index in U.S. dollar terms during the month. The catalyst for the selloff was weakness in the Japanese yen that coincided with a move higher in Japanese Government Bond (JGB) yields in the lead-up to Japan’s cabinet approving a $135B fiscal stimulus package on November 20. Currency weakness alongside rising sovereign bond yields is an unwelcome combination and is a potential sign of capital flight. In response to the weaker yen, market participants began to price in a rate hike out of the Bank of Japan (BoJ) in December which, along with expectations the FOMC would cut this month, allowed the yen to stabilize. Inflation in Japan has been above the BoJ’s 2% target for three years which combined with expansionary fiscal policy has led to fears that the BoJ may need to hike its key policy rate by more than just 25-basis points over coming quarters to prevent the yen from weakening further. More restrictive monetary policy would act as an offset to expansionary fiscal policy and potentially temper enthusiasm surrounding Japanese stocks.
Tailwinds remain for emerging markets, but more modest gains are expected in the near term. Elevated equity volatility stateside in mid-November spilled over into emerging markets, with the MSCI Emerging Equity index ending the month lower by 2.4%. The November misstep for the MSCI EM index stands out as the only negative month in 2025, with a year-to-date total return of 30.4% through the end of November. Even after such a strong run, opportunities in the asset class remain in our view, but shifting macro forces suggest investors should expect more modest gains in the near term. Currency momentum in developing markets has faded in recent months as capital flows have tapered off, and the path taken by emerging currencies plays a meaningful role in driving return for U.S. investors. With the MSCI EM Currency index trading sideways to lower from the July peak, it remains unclear if the index is carving out a base to move higher or if it is running out of steam. Either way, emerging markets, broadly speaking, are unlikely to rocket higher before 2026 and moves by the major emerging economies reinforce that view.
Investors hiding out in sleepy high-quality bonds have been handsomely rewarded for doing so this year as the all-investment grade Bloomberg Aggregate Bond index, or Agg, produced a 7.4% year-to-date total return through November. We expected core fixed income to generate a coupon-plus type return in 2025, but the drop in Treasury yields this year has been larger than anticipated and the primary driver of these outsized returns, with tighter credit spreads contributing as well. However, we do not expect 2025’s gains to be replicated in 2026.
The yield-to-worst on the Agg at the start of last year was 4.90% but had fallen to 4.27% by the end of November, so investors in core bonds should expect a smaller income stream, or baseline return from core fixed income moving forward. The 10-year U.S. Treasury yield, specifically, entered this year at 4.58% and sat at 4.19% at the time of this writing, but given our view that the U.S. economy will grow by 2.1% in the coming year and that inflation, as measured by core PCE, will be 2.7% in the twelve months to come, we see limited downside for Treasury yields in the belly of the curve. We also expect fiscal spending to put upward pressure on global sovereign bond yields, and if yields on 10-year German bunds and Japanese Government Bonds move higher, it is unlikely that Treasury yields would buck that trend.
10-Year Global Sovereign Yields Rarely Run In Opposite Directions
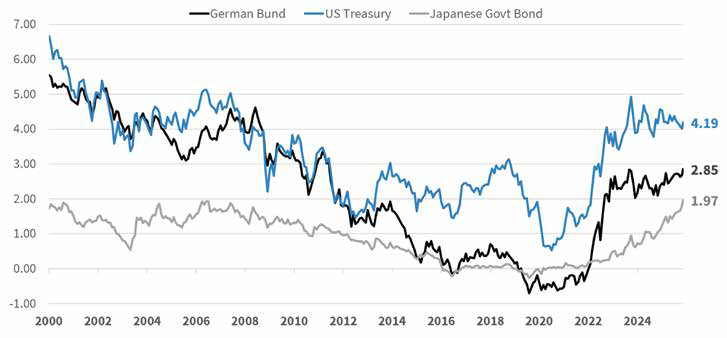
Source: Bloomberg
Lastly, the technical picture for the 10-year yield points to staunch resistance around 3.95% as the 10-year yield bounced off that level in October and on subsequent retests failed to close below 3.99%. This is notable, in our view, as even with the government shutdown ongoing and economic slowdown fears making the rounds in November, the 10-year yield failed to break lower and remained entrenched around 4.10% to 4.15% for much of the month.
High yield and investment grade bonds have been mirror Images of one another. Resilient U.S. economic growth and easier monetary policy over the course of 2025 proved to be a rising tide that lifted all credits, regardless of quality, with both the Bloomberg High Yield and Investment Grade Corporate indices rising by 8% year-to-date as of the end of November. The two opposite ends of the credit spectrum have not finished within 1% of another since 2019, which was another bull-market for bondholders as both indices turned out to be double-digit gains. There are still a few calendar days left for dispersion to crop up, but even if its smooth sailing into January, current valuations are hovering near the richest levels seen in decades as we enter 2026. Corporate bonds continue to play a valuable role within diversified portfolios as income generators and volatility dampeners, but investors should not expect another year of outsized returns as the starting point for yields and credit spreads matters. Entering the new year, those two variables pose modest headwinds for the asset class, but we expect dislocations and interest rate volatility to create opportunities to tactically adjust positions along the way.
As 2025 comes to a close, Technology has shown some signs of weakness into year end, and we have seen the performance gap between the S&P 500 and the equal-weighted S&P 500 begin to converge. Earnings for domestic equities have been strong, but despite positive performance, forward guidance has been mixed. Technology and communication (the sectors to which most Magnificent Seven constituents belong) make up approximately 45% of the S&P 500. These sectors have driven performance in the benchmark this year and helped drive much of the performance over the past several years. However, these names could also become a headwind if investors sour on forward expectations. Regionally, both international developed and emerging market equities have outperformed US equities for the first time since 2017. We currently favor emerging markets over developed markets and believe the trend of outperformance for these countries will continue in 2026. Interest rates have moved as expected throughout the year, with yields at the short end of the curve falling more than at the long end. Looking ahead, fixed income markets continue to show signals that there are few reasons to be concerned over the near-term as credit spreads continue to trade tightly. We continue to favor higher-quality bonds at these levels but will look to opportunistically rotate into lower-rated issues during market dislocations. Inflation continues to remain near 3% and we currently see limited catalysts for a material decline in 2026. If anything, the full effects of tariffs are likely to become fully baked into prices over the coming months and we could see inflation rise in 2026. Going into 2026, we will continue to monitor the markets for opportunities and risks and position portfolios to take advantage of changes. As 2025 comes to an end, we would like to take this time to wish everyone a Happy Holiday and look forward to a prosperous 2026.
IMPORTANT DISCLOSURES: This publication has been prepared by the staff of Highland Associates, Inc. for distribution to, among others, Highland Associates, Inc. clients. Highland Associates is registered with the United States Security and Exchange Commission under the Investment Advisors Act of 1940. Highland Associates is a wholly owned subsidiary of Regions Bank, which in turn is a wholly owned subsidiary of Regions Financial Corporation. Research services are provided through Multi-Asset Solutions, a department of the Regions Asset Management business group within Regions Bank. The information and material contained herein is provided solely for general information purposes only. To the extent these materials reference Regions Bank data, such materials are not intended to be reflective or indicative of, and should not be relied upon as, the results of operations, financial conditions or performance of Regions Bank. Unless otherwise specifically stated, any views, opinions, analyses, estimates and strategies, as the case may be (“views”), expressed in this content are those of the respective authors and speakers named in those pieces and may differ from those of Regions Bank and/or other Regions Bank employees and affiliates. Views and estimates constitute our judgment as of the date of these materials, are often based on current market conditions, and are subject to change without notice. Any examples used are generic, hypothetical and for illustration purposes only. Any prices/quotes/statistics included have been obtained from sources believed to be reliable, but Highland Associates, Inc. does not warrant their completeness or accuracy. This information in no way constitutes research and should not be treated as such. The views expressed herein should not be construed as individual investment advice for any particular person or entity and are not intended as recommendations of particular securities, financial instruments, strategies or banking services for a particular person or entity. The names and marks of other companies or their services or products may be the trademarks of their owners and are used only to identify such companies or their services or products and not to indicate endorsement, sponsorship, or ownership by Regions or Highland Associates. Employees of Highland Associates, Inc., may have positions in securities or their derivatives that may be mentioned in this report. Additionally, Highland’s clients and companies affiliated with Highland Associates may hold positions in the mentioned companies in their portfolios or strategies. This material does not constitute an offer or an invitation by or on behalf of Highland Associates to any person or entity to buy or sell any security or financial instrument or engage in any banking service. Nothing in these materials constitutes investment, legal, accounting or tax advice. Non-deposit products including investments, securities, mutual funds, insurance products, crypto assets and annuities: Are Not FDIC-Insured I Are Not a Deposit I May Go Down in Value I Are Not Bank Guaranteed I Are Not Insured by Any Federal Government Agency I Are Not a Condition of Any Banking Activity.
Neither Regions Bank nor Regions Asset Management (collectively, “Regions”) are registered municipal advisors nor provide advice to municipal entities or obligated persons with respect to municipal financial products or the issuance of municipal securities (including regarding the structure, timing, terms and similar matters concerning municipal financial products or municipal securities issuances) or engage in the solicitation of municipal entities or obligated persons for such services. With respect to this presentation and any other information, materials or communications provided by Regions, (a) Regions is not recommending an action to any municipal entity or obligated person, (b) Regions is not acting as an advisor to any municipal entity or obligated person and does not owe a fiduciary duty pursuant to Section 15B of the Securities Exchange Act of 1934 to any municipal entity or obligated person with respect to such presentation, information, materials or communications, (c) Regions is acting for its own interests, and (d) you should discuss this presentation and any such other information, materials or communications with any and all internal and external advisors and experts that you deem appropriate before acting on this presentation or any such other information, materials or communications.
Source: Bloomberg Index Services Limited. BLOOMBERG® is a trademark and service mark of Bloomberg Finance L.P. and its affiliates (collectively “Bloomberg”). BARCLAYS® is a trademark and service mark of Barclays Bank Plc (collectively with its affiliates, “Barclays”), used under license. Bloomberg or Bloomberg’s licensors, including Barclays, own all proprietary rights in the Bloomberg Barclays Indices. Neither Bloomberg nor Barclays approves or endorses this material or guarantees the accuracy or completeness of any information herein, or makes any warranty, express or implied, as to the results to be obtained therefrom and, to the maximum extent allowed by law, neither shall have any liability or responsibility for injury or damages arising in connection therewith.