
Download Asset Allocation | December 2023
Brand New Day
Economic Update
Here we go again…
By Regions Economic Division
As we close in on year-end, there are concerns that the U.S. economy will slip into recession in the new year, and even though inflation remains well above the Federal Open Market Committee’s (FOMC) 2.0% target rate, the committee finds itself trying to push back against market expectations of aggressive Fed funds rate cuts. If this sounds familiar, that’s probably because 2022 ended with us having the exact same discussion. That 2023 is ending on the same note does not mean that nothing has changed over the past year. Indeed, little about the economy in 2023 played out as was expected a year ago, with the U.S. economy proving to be surprisingly resilient in the face of elevated inflation and significantly higher interest rates. By way of a not-so-bold prediction, we’ll offer that we won’t be having this same discussion as 2024 nears its close. Us going any further out the proverbial limb will have to wait for next month’s edition.
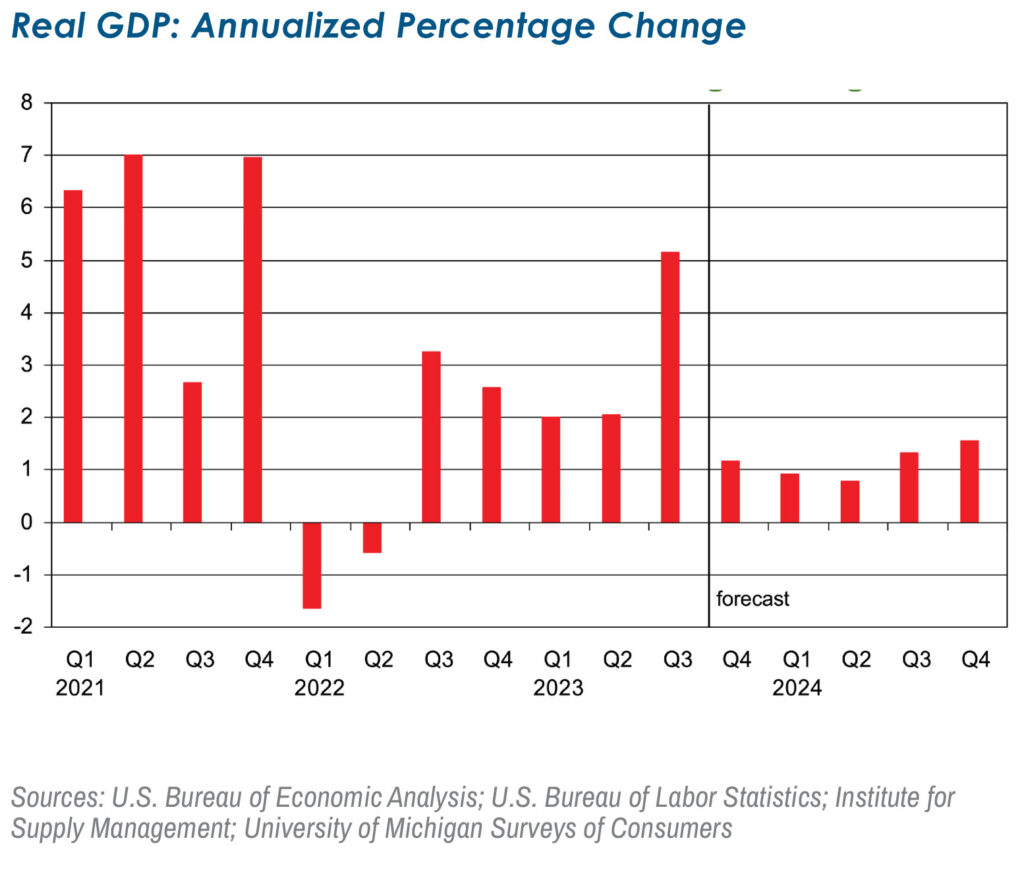
The U.S. economy is clearly slowing as 2023 draws to a close. The second estimate from the U.S. Bureau of Economic Analysis (BEA) puts Q3 real GDP growth at an annual rate of 5.2%, up from the original estimate of 4.9% on upward revisions to the initial estimates of business spending on structures and government spending. That said, the pronounced slowdown in growth in Q4 that we’ve for some time expected seems to be well underway. The Institute for Supply Management’s (ISM) November survey showed a 13th straight month of contraction in the manufacturing sector, with new orders having contracted in each of the past 15 months, the longest such streak since 1980-81. At the same time, backlogs of unfilled orders thinned further in November while firms’ assessments of their customers’ inventories point to those inventories being in the “just right to too high” range. Doing the math, contracting new orders, shrinking backlogs of unfilled orders, and customers at best not looking to build inventories all add up to a weak outlook for employment and production in the factory sector. That this comes 13 months into a contraction makes it all the more discouraging. Recall that earlier in the year ISM was reporting firms holding on to workers on the premise that demand would rebound over the second half of this year. With those expectations having largely been dashed, manufacturing layoffs have become more common.
Though none of the official measures of consumer spending for the month of November have yet been released, various spending trackers suggest a somewhat lackluster month for consumer spending after what was only modest growth in October. Not exactly an encouraging start to the holiday shopping season. While various trackers of consumer spending show November was a strong month for online sales, that strength seems to have come at the expense of in-store shopping. Still, there is one hopeful sign for holiday season spending, with the University of Michigan’s early-December survey showing consumers feeling a bit more upbeat and a bit less stressed about inflation, with falling gasoline prices largely accounting for this shift. One may be excused for wondering what took so long, as retail gasoline prices have been falling sharply since September and yet, in stark contrast to historical patterns, falling pump prices did nothing to improve consumers’ moods. It could be that, even if November spending is as soft as the various spending trackers suggest, spending perks up in December. That still leaves the question of how consumer spending will fare once the calendar turns, and we continue to expect fairly tepid growth in real consumer spending in 2024.
Real business investment in equipment and machinery contracted in Q3, the third contraction in the past four quarters, and the monthly data on core capital goods orders suggest spending on equipment and machinery will continue to contract well into 2024. While real business investment in structures has been notably strong over the past four quarters, there is reason to question how much longer that will remain the case. Much of that growth has come from the construction of facilities to produce semiconductor chips, electric vehicles, and electric vehicle batteries, activity that has benefitted from government subsidies, and there are signs that this wave of construction is cresting. If so, should business investment in equipment and machinery continue to soften, that would leave outlays on intellectual property products as the driver of growth in overall business investment.
Falling gasoline prices have helped push down headline inflation, which has decelerated faster than had been anticipated. Also acting as a weight on inflation is that prices for core (i.e., nonfood, nonenergy) consumer goods have been declining over the past five months. Though this is obviously at odds with the experience of the past few years, keep in mind that core goods price deflation was the norm over the seven years prior to the pandemic, and the recent string of monthly declines suggests this could again be the case. Given the relative weightings, however, even should mild declines in core goods prices again become the norm, inflation will remain above the FOMC’s 2.0% target until pressures on core services prices dissipate further.
That the FOMC left the Fed funds rate target range unchanged at this month’s meeting came as absolutely no surprise. That didn’t mean the committee was incapable of springing a surprise, which is exactly what they did. In addition to softening the language of their post-meeting policy statement, the committee signaled an additional funds rate cut in 2024, moving closer to where the markets are as opposed to trying to pull the markets to where the committee is, or at least had been. Though not explicitly coming out and saying so, the committee sent a strong signal that their most recent tightening cycle has run its course. Moreover, that the updated dot plot added an additional 25 basis points of funds rate cuts in 2024 suggests those cuts will come sooner than had been anticipated. This seems quite a turn in a relatively short period of time. It is, however, worth noting that there is considerable dispersion around the median year-end 2024 dot, and the committee remains meaningfully divided on the appropriate path of the funds rate. We will note that eight committee members see a funds rate above the 4.625% median as being appropriate at year-end 2024, compared to the six at that median. By the same token, there are more members above the median year-end 2025 and 2026 rates than are at those medians. In other words, the FOMC is far from having settled at a consensus view, making the median year-end dots more of a math question than a policy statement.
We have, over the past two years, been in the small minority of forecasters who at no point have had recession as their base case. At the same time, though, we have expected only middling growth, and the economy easily outperformed our expectations in 2023. We’re setting a similarly low bar for economic growth in 2024, and while the economy may well clear that bar, it could be a much closer call than was the case in 2023.
Investment Strategy Update
Stocks: The Calendar Remains Kind into January
Regions Multi-Asset Solutions & Highland Associates
November held true to form as a good month for stocks as the S&P 500 rose 9.1% on a total return basis and the small-cap stocks turned out an equally impressive 9.2% return. While market breadth improved to begin the month, December’s gains may be backloaded as stocks entered the month on the doorstep of overbought territory and may need to digest November’s run-up. As tax loss harvesting concludes in early/mid-December, investors could gravitate back into cyclical value and/or smaller capitalization stocks that have lagged in 2023 as they position for a possible rebound in 2023’s “dogs” in the coming year. This could benefit small-cap indices as well as the consumer discretionary, financial services, industrials, and materials sectors, among others, over the near-term. However, the path forward for the S&P 500 likely rests squarely on the shoulders of this year’s mega-cap growth leaders, and as the “Magnificent 7” go, so likely goes the broader market into year-end.
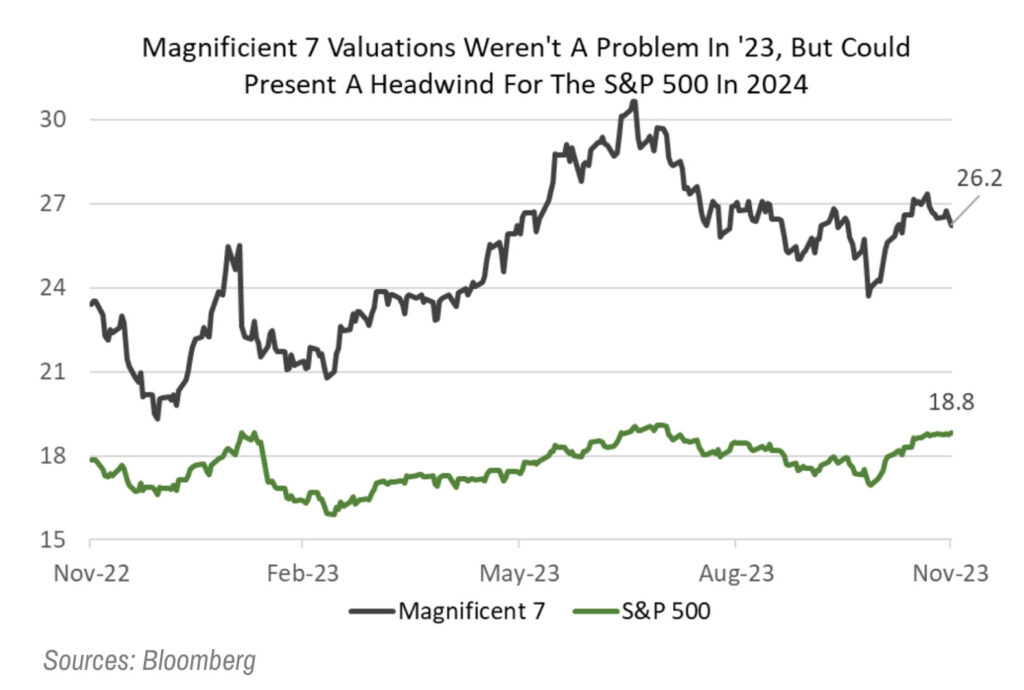
December has a well-earned reputation as a good month for stocks but has a particularly strong track record in calendar years such as this in which the S&P 500 enters the month with a year-to-date return of greater than 10%. A positive seasonal backdrop, improved market breadth during November’s rally, and range-bound interest rates with a bias lower through year-end are all potential catalysts for stocks to end the year higher than where they were at the start of this month. However, after a 9.1% return in November, the S&P 500 is now higher by over 21% year-to-date, and we would temper our expectations as a result. The Magnificent 7 are richly valued relative to the broader S&P 500, with an average price-to-earnings (P/E) ratio on expected 2024 earnings of 26 for the group versus the S&P 500 at just under 19. This could pose a headwind for the S&P 500 next year once investors are no longer chasing their benchmark.
While we continue to expect the S&P 500 to outperform SMid into year-end, a rotation was afoot at the start of December, and a melt-up can’t be ruled out as positive price momentum for small-caps and value-oriented areas could draw contrarian buyers in as they position for this year’s laggards to rebound in the coming year. Historically, December’s leadership tends to persist into the following calendar year, which would make a sustained rotation out of mega-cap growth and into pockets of relative value and SMid this month notable. That could, however, present a headwind for the S&P 500 next year should the heavyweights in the index pull back as investors raise capital to deploy into this year’s laggards for a catch-up trade. We remain neutral across all equity sub-asset classes into year-end as we await opportunities to tactically take advantage of opportunities as they arise.
Emerging Markets Gain Amid U.S. Dollar Pain
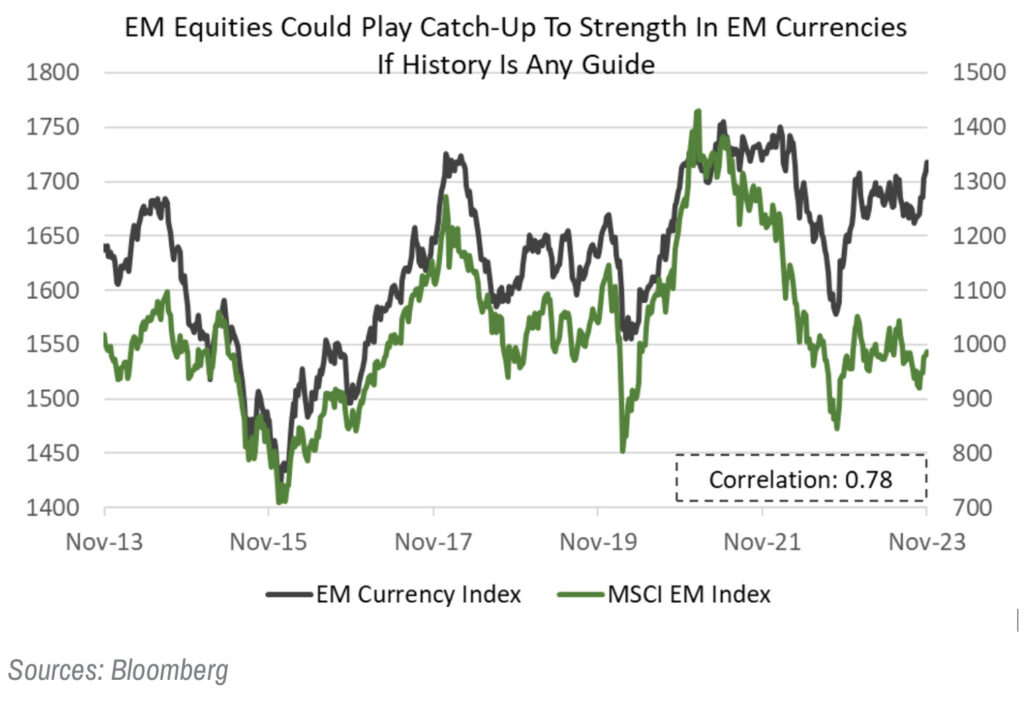
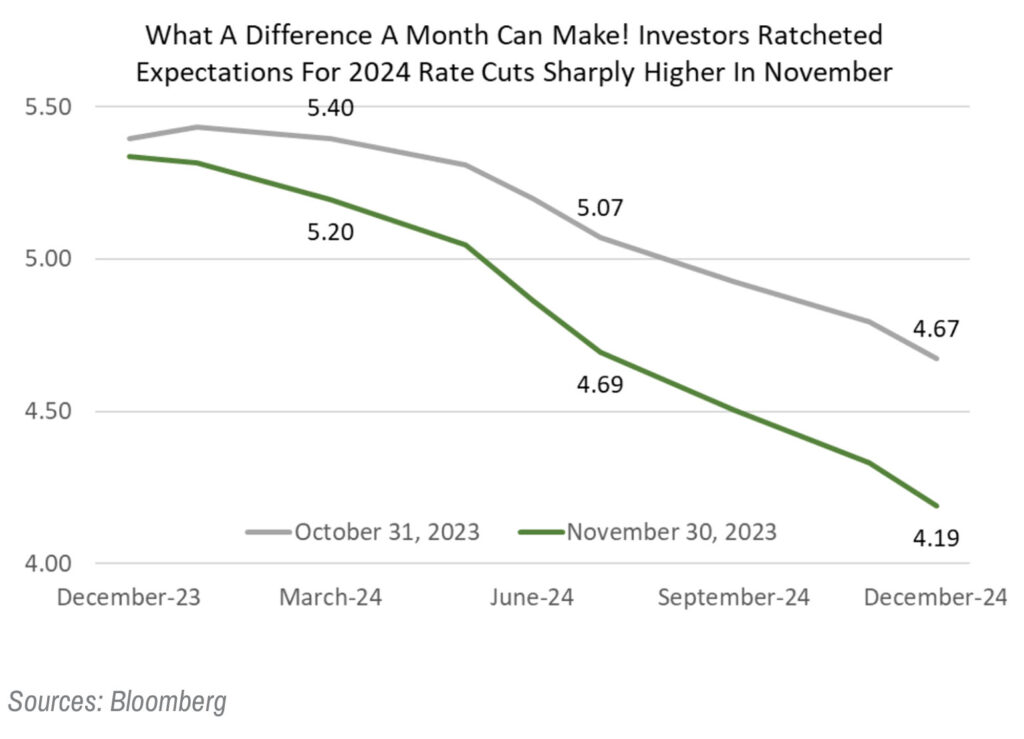
On the heels of cooler U.S. inflation readings in recent months, market participants have pulled forward expected cuts to the Fed funds rate. Fed funds futures now place the likelihood of at least a 25-basis point rate cut by May of 2024 at greater than 98%. Due to this shift in expectations, the U.S. dollar has weakened materially, giving ground versus both developed and emerging market currencies in November. The dollar’s weakness relative to emerging market currencies is particularly notable as the Mexican peso, South Korean won, and Brazilian real, among others, rallied sharply, propelling equity indices tied to each of those three countries to 14% or greater monthly gains. The impact of China on the MSCI Emerging Markets (EM) index is always cited as cause for concern, and well documented issues facing the country have weighed on investor demand for broader emerging markets exposure. Emerging market central banks beginning to cut rates to spur growth could give investors a nudge early in the coming year and provide a tailwind for EM stocks. Active managers willing to run a portfolio that appears different from their benchmark should have opportunities at the country and individual security levels to drive alpha in 2024, and while we remain neutral on emerging markets relative to our strategic benchmark, should the U.S. dollar weaken further and return to pre-COVID levels, emerging markets could be set up to outperform our expectations.
Bonds: Move Lower in Yields Makes Sense, But May Be Overdone
Interest rates moved lower throughout November as inflation eased and Fed officials struck a less hawkish tone. Investors who stayed the course and remained allocated to bonds despite a volatile and painful first 10 months of the year were finally compensated for doing so as they benefitted from a remarkable rally in bonds with greater sensitivity to falling interest rates. The Bloomberg Aggregate Bond Index returned 4.5% during November, and some longer duration Treasury bonds were knocking on the door of a double-digit total return for the month. The yield on 10-year U.S. Treasury notes fell from 4.88% at the end of October to close out November at 4.37%, marking the largest one-month drop in the 10-year yield dating back to December of 2008. The reference to 2008 could come across as more ominous than intended as the steep decline in rates back then can be attributed to a recession and skyrocketing unemployment, while this time around positive developments on the inflation front have forced inflation expectations lower, providing a more constructive backdrop for bonds. The “why” behind the drop in rates matters, and the reasons behind the drop in yields in November are far more encouraging for investors and consumers alike than they were in 2008-2009.
At the time of this writing, the 10-year Treasury yield was trading on either side of 4% after the FOMC struck a surprisingly dovish tone at its December meeting. This equates to a greater than 100-basis point, or 1%, move lower in just under two months’ time. After such a sizable move in a short period of time, it’s rational to prepare for a reversal in trend as markets tend to move too far too fast, and that may yet prove to be the case for Treasury yields as the extreme move lower in yields may be overdone. With that said, momentum is a powerful driver, and bonds, broadly speaking, are still likely under-owned due to abysmal trailing performance in recent years and relatively attractive yields on cash. For the 10-year Treasury yield, we’re eyeing the 3.9% to 4% zone as a potential area of resistance that could cap gains for bonds into year-end. The 10-year traded below 4% as recently as July, and a yield 25 +/- basis points around that level is defensible assuming inflation returns to 2% in the coming year. Our base case call is for a range-bound 10-year yield between 3.9% and 4.35% into year-end, with 4.50% potentially in the cards in 1Q24 should the FOMC finally feel the need to push back on rate cut expectations. At the same time, an end to Japan’s negative interest rate policy is another relevant risk factor that could put upward pressure on yields. We maintain a duration profile in line with that of the Bloomberg Aggregate Bond index and expect 2024 to be a better year for fixed income investors than 2023 proved to be.
Corporate Bonds Remain an Area of Interest Into 2024
Investment-grade (IG) corporate bonds rallied alongside Treasuries during November, evidenced by a 5.9% monthly gain out of the Bloomberg U.S. Corporate Bond index. That index carries a duration of around seven years, making it more sensitive to falling interest rates than the Bloomberg Aggregate Bond index. Should yields in the two- to five-year portion of the Treasury curve fall as inflationary pressures continue to wane and the FOMC cuts rates in the back-half of 2024, investors in IG corporate bonds could fare better than the index’s current 5.4% yield-to-worst (YTW) in the coming year. Lower quality, shorter duration high-yield bonds have fared well in 2023, exhibited by the Bloomberg U.S. Corporate High Yield index’s 9.3% year-to-date total return through November. Market participants appear to be growing more confident that the U.S. economy is going to achieve a soft landing. A soft landing would likely provide a constructive backdrop for both investment-grade and high-yield corporate bonds, although we do expect bankruptcies and defaults to rise modestly over the coming year as Fed funds rate hikes are felt. As a result of this view, it’s reasonable to expect the U.S. Corporate High Yield index to generate a total return modestly below the index’s 8.25% YTW in the coming year.
Highland Diffusion Index Signaling “Risk-On”
Monetary policy, credit spread, and momentum indicators are now signaling a more favorable environment for risk assets in the months ahead. However, context is always key: Typically monetary policy easing, combined with narrowing spreads and positive momentum, would historically signal the economy is firming, normally after an economic slowdown, but that’s not exactly the case this time. This should be viewed in a positive light and as an improved outlook for risk assets, but it shouldn’t be taken as an “all-clear.” We would need to see this score persist to increase our level of conviction.
Highland Associates Cross Asset Views
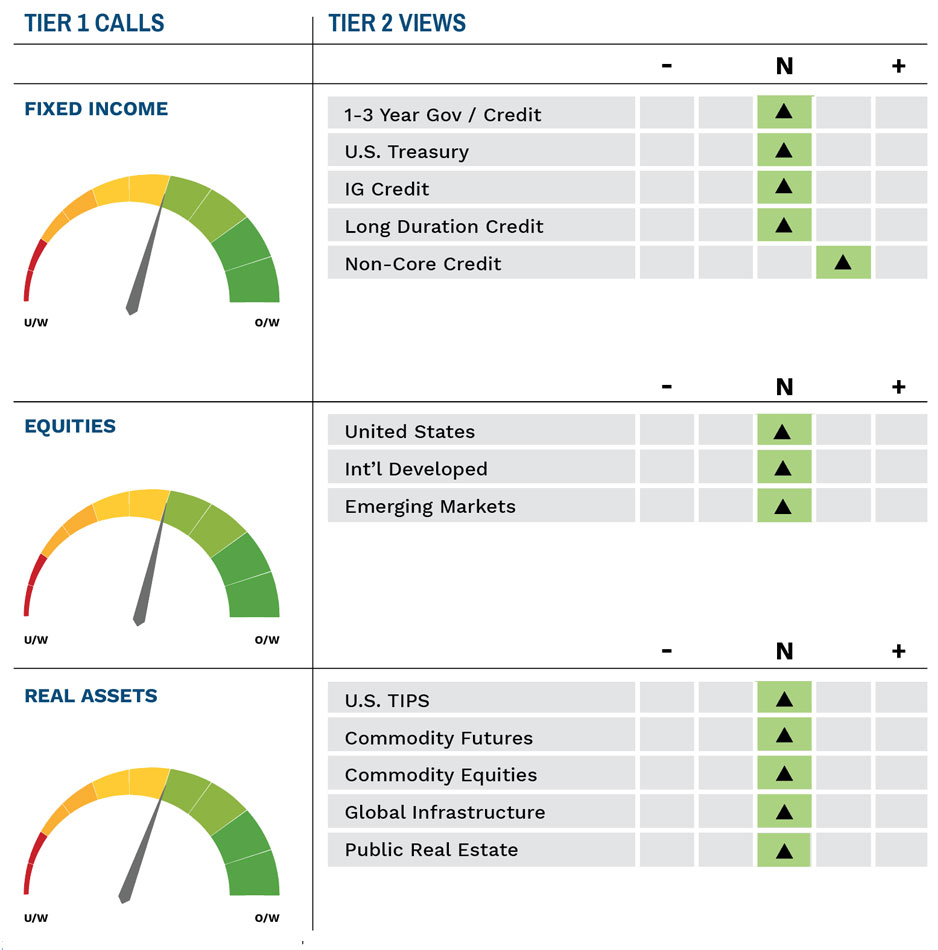
As of 12/18/2023
IMPORTANT DISCLOSURES: This publication has been prepared by the staff of Highland Associates, Inc. for distribution to, among others, Highland Associates, Inc. clients. Highland Associates is registered with the United States Security and Exchange Commission under the Investment Advisors Act of 1940. Highland Associates is a wholly owned subsidiary of Regions Bank, which in turn is a wholly owned subsidiary of Regions Financial Corporation. Research services are provided through Multi-Asset Solutions, a department of the Regions Asset Management business group within Regions Bank. The information and material contained herein is provided solely for general information purposes only. To the extent these materials reference Regions Bank data, such materials are not intended to be reflective or indicative of, and should not be relied upon as, the results of operations, financial conditions or performance of Regions Bank. Unless otherwise specifically stated, any views, opinions, analyses, estimates and strategies, as the case may be (“views”), expressed in this content are those of the respective authors and speakers named in those pieces and may differ from those of Regions Bank and/or other Regions Bank employees and affiliates. Views and estimates constitute our judgment as of the date of these materials, are often based on current market conditions, and are subject to change without notice. Any examples used are generic, hypothetical and for illustration purposes only. Any prices/quotes/statistics included have been obtained from sources believed to be reliable, but Highland Associates, Inc. does not warrant their completeness or accuracy. This information in no way constitutes research and should not be treated as such. The views expressed herein should not be construed as individual investment advice for any particular person or entity and are not intended as recommendations of particular securities, financial instruments, strategies or banking services for a particular person or entity. The names and marks of other companies or their services or products may be the trademarks of their owners and are used only to identify such companies or their services or products and not to indicate endorsement, sponsorship, or ownership by Regions or Highland Associates. Employees of Highland Associates, Inc., may have positions in securities or their derivatives that may be mentioned in this report. Additionally, Highland’s clients and companies affiliated with Highland Associates may hold positions in the mentioned companies in their portfolios or strategies. This material does not constitute an offer or an invitation by or on behalf of Highland Associates to any person or entity to buy or sell any security or financial instrument or engage in any banking service. Nothing in these materials constitutes investment, legal, accounting or tax advice. Non-deposit products including investments, securities, mutual funds, insurance products, crypto assets and annuities: Are Not FDIC-Insured I Are Not a Deposit I May Go Down in Value I Are Not Bank Guaranteed I Are Not Insured by Any Federal Government Agency I Are Not a Condition of Any Banking Activity.
Neither Regions Bank nor Regions Asset Management (collectively, “Regions”) are registered municipal advisors nor provide advice to municipal entities or obligated persons with respect to municipal financial products or the issuance of municipal securities (including regarding the structure, timing, terms and similar matters concerning municipal financial products or municipal securities issuances) or engage in the solicitation of municipal entities or obligated persons for such services. With respect to this presentation and any other information, materials or communications provided by Regions, (a) Regions is not recommending an action to any municipal entity or obligated person, (b) Regions is not acting as an advisor to any municipal entity or obligated person and does not owe a fiduciary duty pursuant to Section 15B of the Securities Exchange Act of 1934 to any municipal entity or obligated person with respect to such presentation, information, materials or communications, (c) Regions is acting for its own interests, and (d) you should discuss this presentation and any such other information, materials or communications with any and all internal and external advisors and experts that you deem appropriate before acting on this presentation or any such other information, materials or communications.
Source: Bloomberg Index Services Limited. BLOOMBERG® is a trademark and service mark of Bloomberg Finance L.P. and its affiliates (collectively “Bloomberg”). BARCLAYS® is a trademark and service mark of Barclays Bank Plc (collectively with its affiliates, “Barclays”), used under license. Bloomberg or Bloomberg’s licensors, including Barclays, own all proprietary rights in the Bloomberg Barclays Indices. Neither Bloomberg nor Barclays approves or endorses this material or guarantees the accuracy or completeness of any information herein, or makes any warranty, express or implied, as to the results to be obtained therefrom and, to the maximum extent allowed by law, neither shall have any liability or responsibility for injury or damages arising in connection therewith.